


Article Figures & Data
Figures
- FIGURE 1.
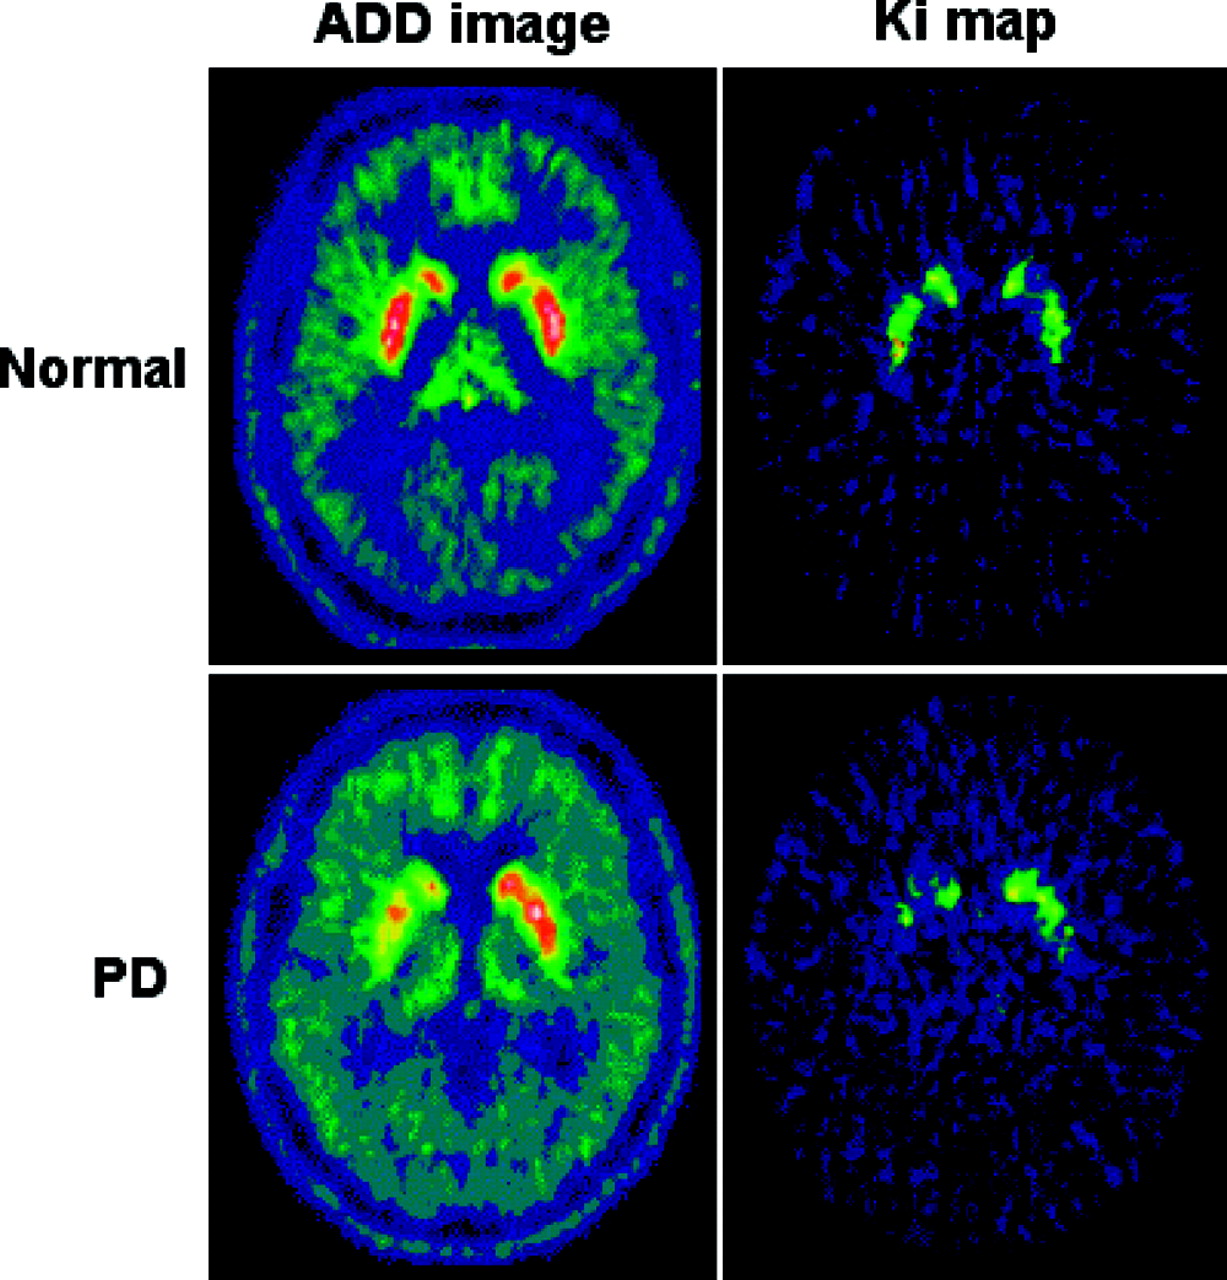
ADD (summed) and net influx rate constant (Ki) maps of single slice from healthy subject (top) and subject with PD (bottom). In these images, normalization to Montreal Neurological Institute (MNI) space has been performed. High signal, demonstrating high 18F-DOPA uptake, is shown in red bilaterally in caudate nucleus and putamen. In subject with PD, there is reduction of uptake in caudate and putamen that is greater on right-hand side.
- FIGURE 2.
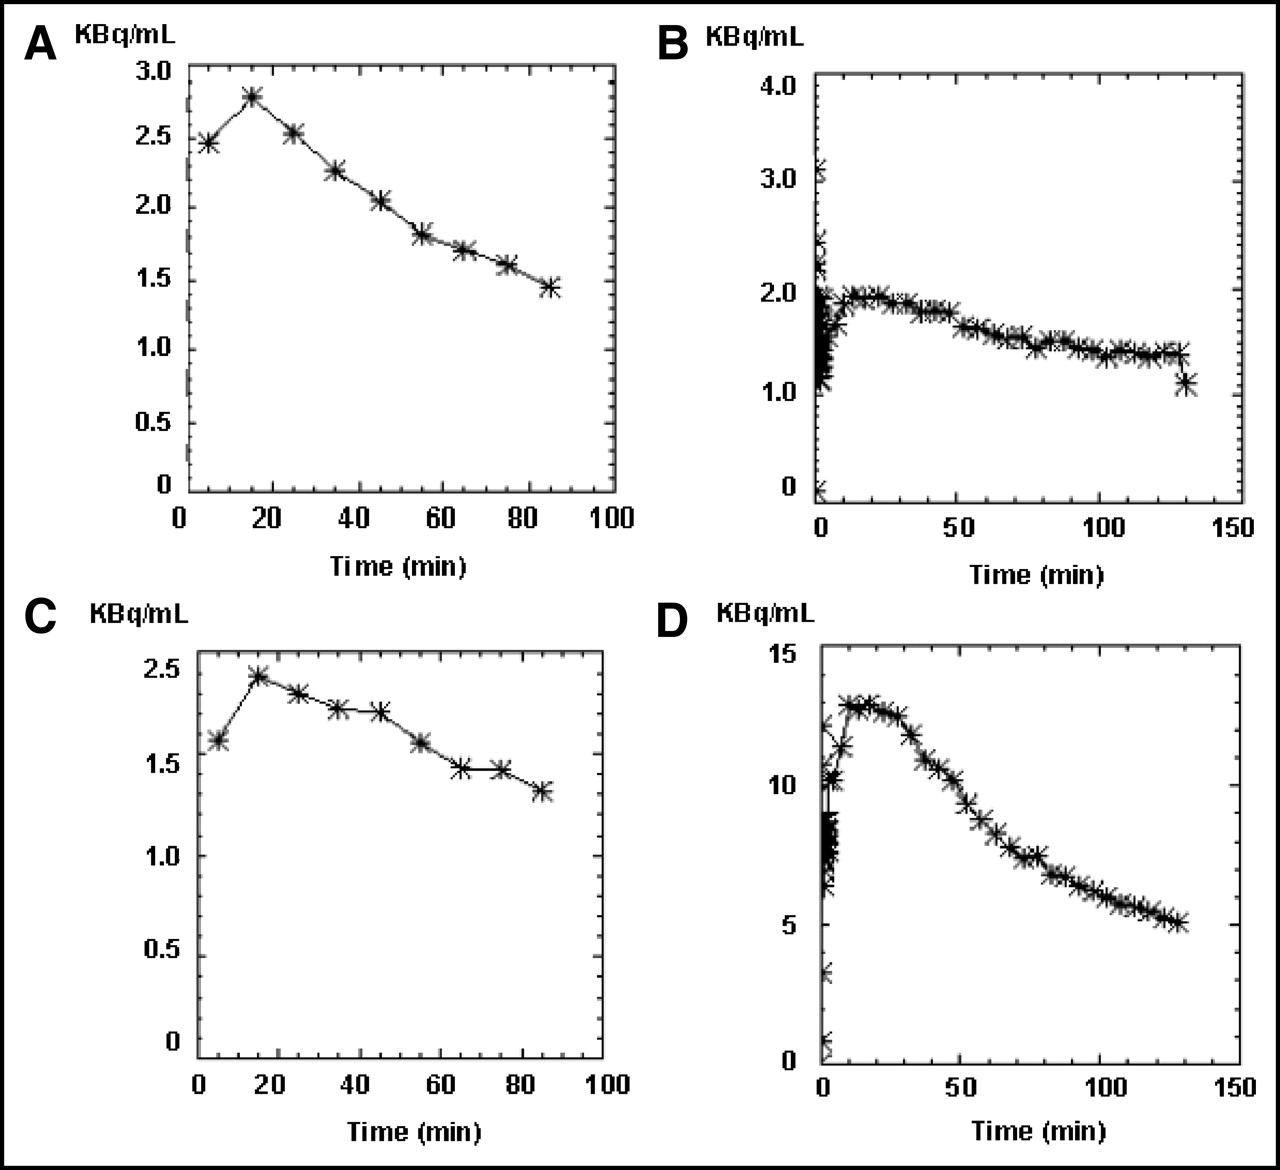
Four input function curves are shown from 2 subjects, (A + C) and (B + D). Input curves (A + B) are from baseline scans and input curves (C + D) are from follow-up scans. (A + D) input function curves are within normal acceptable limits. C is an example of a jagged input function curve, suggesting excessive head movement during scan. B is an example of a flat input function curve, suggesting either poor radiotracer delivery or decay before injection. In B (baseline scan), peak is factor of 10 lower than in D (follow-up scan). Both subjects (A + C) and (B + D) were excluded from analysis on basis of these aberrant curves (C + B).
- FIGURE 3.
Template region object map (white outlines) overlying putamen and caudate nucleus bilaterally in normalized ADD (summed) image, 18F-DOPA template, and single subject T1 MRI found in SPM99.
- FIGURE 4.
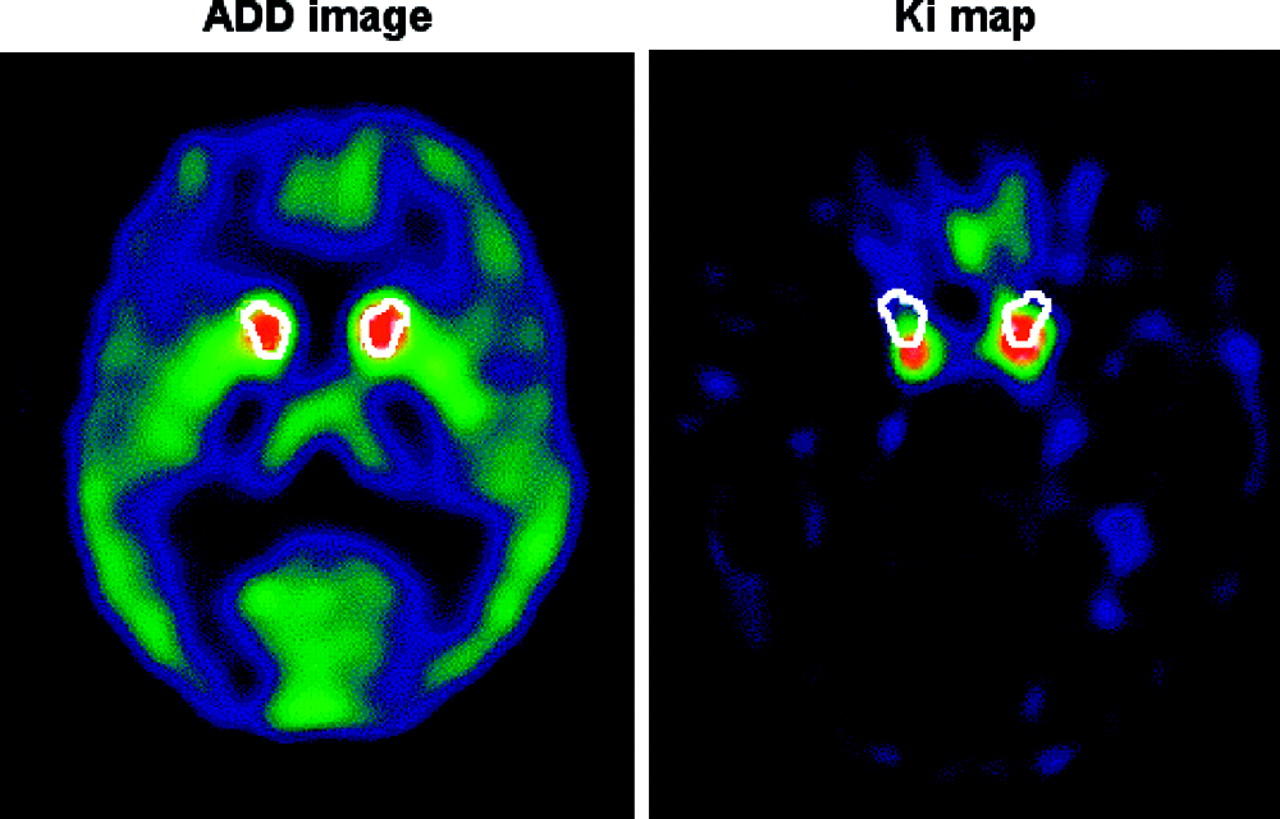
Example of poor alignment between ADD (summed) and Ki image in x-axis at level of caudate nucleus (red). Consequently, object map (white circles) is correctly localized in ADD image but not in Ki map. In this situation, manual adjustment would be made so that object map (white circles) would lie over caudate nucleus (red) in Ki map before Ki values are extracted.
- FIGURE 5.
Flow diagram outlining various stages in this distributed acquisition/centralized analysis methodologic approach. QA = quality analysis; ROIL = local ROI analysis; ROIC = centralized ROI analysis; SPMC = centralized SPM analysis.


Tables
PET center Scanner model Reported in-plane spatial resolution Acquisition protocol (frame sequence) No. of subjects in study* FWHM (mm) Reference United Kingdom ECAT HR++ 4.5 11 26 frames; higher frame frequency acquisition initially, 95-min duration 34 baseline scans: 16 r, 18 l Hammersmith Outcome population: 12 r, 12 l France ECAT HR+ 4.6 12 9 frames; frame frequency acquisition constant throughout, 90-min duration 39 baseline scans: 19 r, 20 l Orsay Outcome population: 17 r, 16 l United States ECAT EXACT47 6.0 13 29 frames; higher frame frequency acquisition initially, 120-min duration 39 baseline scans: 19 r, 18 l Atlanta Outcome population: 15 r, 11 l Germany ECAT EXACT47 6.0 13 9 frames; frame frequency acquisition constant throughout, 90-min duration 25 baseline scans: 15 r, 10 l Ulm Outcome population: 10 r, 6 l Canada ECAT 953B 4.8 14 25 frames; higher frame frequency acquisition initially, 95-min duration 20 baseline scans; 11 r, 9 l UBC Outcome population: 10 r, 7 l Canada ECAT ART 6.2 15 58 frames; frame frequency acquisition constant throughout, 150-min duration 15 baseline scans; 5 r, 10 l McMaster Outcome population: 4 r, 7 l ↵* Subjects undergoing baseline scans at each center and subjects from each center in primary outcome population (after patient withdrawals).
FWHM = full width at half maximum; r = ropinirole; l = l-DOPA; UBC = University of British Columbia.
Data format versions used for each scanner were CTI proprietary formats, either ECAT6 or ECAT7.
Reason for rejecting scan Baseline PET Follow-Up PET Scans identified from subjects considered to be unevaluable Incomplete frame sequence 2 3 Input function suggestive of poor radiotracer delivery/status 1 2 Attenuation correction not applied 0 1 Abnormal input function suggestive of excessive head movement 1 1 Gross misalignment between ADD and Ki images suggestive of excessive head movement 0 1 Scans identified from baseline subjects who subsequently withdrew considered to be unevaluable Dynamic image not sent 2 Scans identified as problematic and data resent from local center Wrong scan contained on CD-ROM 0 1 Attenuation correction not applied 1 0 Scans not contained on CD-ROM 2 2 In addition, 1 center was asked to send all datasets using the same attenuation correction method for both baseline and follow-up scans; another center was asked to send their images in native space only and not reorientated to AC–PC line.
Setting Procedure 3.1 SPM settings and procedures used to effect spatial normalization A SPM defaults were set so that bounding box was same as MNI MRI templates found in SPM99 and orientation changed to radiologic convention. B Individual ADD images were normalized to 18F-DOPA template created in-house in MNI space (ADD images were used for this iterative maneuver as ADD images contain information reflecting cerebral blood flow and nonspecific binding and, therefore, have greater anatomic detail than Ki maps.). C Having normalized ADD images to MNI space, Ki maps were normalized by applying ADD image transformation parameters (This is problematic if native space ADD and Ki images are not in alignment.). D Normalization quality was inspected in SPM99, comparing spatially normalized Ki and ADD images with 18F-DOPA template and MNI single-subject MRI. 3.2 SPM settings used when performing within-group and between-group analysis A Subjects were entered into SPM such that baseline and follow-up smoothed normalized Ki maps were conditions 1 and 2, respectively. B There were no covariates and SPM options were set to no global normalization, no nuisance variables, and no grand mean scalings. C Analysis lower threshold was set to zero and upper threshold to absolute. By choosing these options, it was variance in voxel-by-voxel Ki values that were being compared, rather than differences in scaled or proportional values. ADD image in this case is summed image of integrated 18F-DOPA signal from 30 to 90 min; MRI is magnetic resonance image.
- TABLE 4
Difference in Ki Decline Between Ropinirole vs. l-DOPA Groups in Striatal Subregions
Striatal subregion Absolute % difference in Ki decline between treatment groups Relative % difference in Ki decline between treatment groups Putamen 6.86 33.4 Caudate nucleus 4.6 31.5 Ventral striatum 1.28 13 In each region, the absolute and percentage Ki loss was in favor of ropinirole—that is, group mean Ki decline was greater in l-DOPA group compared with that of ropinirole group. Mean scan-to-scan interval: ropinirole, 615 ± 97.7 d; l-DOPA, 613 ± 103.3 d.
In this issue


Jump to section
Related Articles
Cited By...
- Serotonin Neuron Loss and Nonmotor Symptoms Continue in Parkinson's Patients Treated with Dopamine Grafts
- Seasonal Effects on Human Striatal Presynaptic Dopamine Synthesis
- Age-related changes in midbrain dopaminergic regulation of the human reward system
- Assessment of 11C-PE2I Binding to the Neuronal Dopamine Transporter in Humans with the High-Spatial-Resolution PET Scanner HRRT
- Improving Influx Constant and Ratio Estimation in FDOPA Brain PET Analysis for Parkinson's Disease