


Abstract
During the acute phase after traumatic brain injury (TBI), the metabolic state is regionally heterogeneous. The purpose of this study was to characterize contusional, pericontusional, and remote regions of TBI by estimating glucose transporter and hexokinase activities on the basis of 18F-FDG kinetic modeling. Methods: A standard 2-compartment model was used to measure 18F-FDG kinetic parameters in 21 TBI patients with cerebral contusions studied during the acute phase (3.1 ± 2.1 [mean ± SD] d after injury). Nineteen patients also underwent 15O-water PET to measure regional cerebral blood flow (CBF). A control study (18F-FDG and 15O-water) was done with 18 healthy volunteers. The rate constants Ki, K1, and k3 were assumed to represent the uptake, transport, and hexokinase activity of 18F-FDG, respectively; Ki was calculated as K1 × [k3/(k2 + k3)]. Results: The areas of contusional and pericontusional tissues located 4.5, 13.5, and 22.5 mm away from the contusion (PC4.5, PC13.5, and PC22.5, respectively) demonstrated significantly reduced K1 values, whereas the K1 values for remote areas remained normal. The k3 values were significantly reduced regardless of the distance from the contusion. Pericontusional areas with CT- or MRI-evidenced tissue damage showed significantly lower Ki (P < 0.001), CBF (P < 0.01), and K1 (P < 0.0001) values than did areas without such damage, whereas the k3 values did not differ significantly. Seven patients showed regionally increased 18F-FDG uptake (hot spots) in pericontusional areas. The k3 value for the hot spots (0.086 ± 0.024/min) was significantly higher than that for the remote cortex (P < 0.01), whereas the Ki, CBF, and K1 values did not show significant differences. Patients with hot spots showed significantly higher Ki and k3 values in PC4.5 (P < 0.05) and higher k3 values in PC22.5 (P < 0.05) than did patients without hot spots, whereas the K1 and CBF values did not differ significantly. Conclusion: Brain tissue 18F-FDG kinetics in TBI patients were consistent with reduced hexokinase activity in the whole brain (including apparently uninjured cortex), whereas glucose transport was impaired only in the area immediately around the contusion. Pericontusional high levels of 18F-FDG uptake observed in a subgroup of patients could have been the result of regionally increased hexokinase activity.
In the acute phase after traumatic brain injury (TBI), the cerebral metabolic state is complex, dynamic, and regionally heterogeneous. Acute-phase 18F-FDG PET studies have revealed that some areas of the brain show a relative increase in glucose utilization compared with other areas. Laboratory animal TBI experiments predicted such a response and suggested that this phenomenon occurs as a result of activated glycolysis in response to intracellular ionic perturbation (1–4). Human TBI PET studies showed patterns strikingly similar to those from animal autoradiography studies, albeit at a later time relative to the time of injury (5–9). As a result, it is not clear whether these 2 sets of findings are attributable to the same stimulus. Because the increase in glucose uptake has been seen predominantly adjacent to hemorrhagic lesions, the disruption of the blood–brain barrier (BBB) has been raised as a possible explanation for increased glucose uptake through a mechanism that bypasses endothelial membrane glucose transporters.
In addition to the areas showing increased glucose uptake, the human TBI studies also demonstrated decreased glucose utilization in pericontusional and remote (seemingly uninjured) areas (5,6). It is unclear whether this decreased glucose utilization is the result of limited transport of glucose across the BBB or reduced phosphorylation attributable to a loss of hexokinase activity. If it is the former, then one could invoke a presumed scenario of cerebral glucose deprivation (despite normal or elevated plasma glucose concentrations) as the etiology of reduced cerebral metabolism.
With human 18F-FDG PET studies, dynamic image acquisition (measuring the rate of accumulation of 18F-FDG in the brain over time) allows modeling of regional 18F-FDG transport and phosphorylation rates (10,11). The model separates 18F-FDG uptake into 2 tissue compartments with flux rates characterized by kinetic parameters (K1, k2, k3, and k4), as shown in Figure 1. This modeling technique offers the ability to determine the rate constants K1 and k3, which represent 18F-FDG transport and hexokinase activity, respectively. Given the validity of certain assumptions, one can infer similar kinetic characteristics for glucose because 18F-FDG is a glucose analog.

Schematic expression of a 2-compartment model for 18F-FDG kinetics. 6P = 6-phosphate.
The purpose of this study was to characterize contusional, pericontusional, and remote regions of TBI by measuring glucose transporter and hexokinase activities on the basis of 18F-FDG kinetic modeling. The analysis suggests that hexokinase activity is the key determinant of glucose utilization in areas of apparently intact tissue, whereas transporter activity plays a role in limiting glucose utilization in damaged tissue.
MATERIALS AND METHODS
Patients and Healthy Volunteers
From September 15, 1998, through March 6, 2002, 38 patients with head injuries underwent PET imaging at the University of California at Los Angeles (UCLA) Medical Center. The inclusion criteria for this prospective study were as follows: TBI patient with a Glasgow Coma Scale (GCS) score of <9 or a GCS score of 9–15 and positive CT findings, an age of >16 y, no prior known history of neurologic or psychiatric disease, and a clinically “stable” status for PET imaging from hemodynamic, pulmonary, and intracranial pressure standpoints. From this cohort, 21 patients (17 male and 4 female) showing clear evidence of a cerebral contusion on CT scans were included in this study. The mean ± SD age was 44 ± 16 y (range, 21–81 y), the median initial GCS score was 11 (range, 3–15), and the mean ± SD PET study date was 3.1 ± 2.1 d after injury.
The head injury characteristics (number of patients) were as follows: motor vehicle–related accident (7), fall (7), gunshot wound (2), and unknown (5). Initial papillary abnormalities were observed in 8 of 21 patients. All patients had at least 1 cerebral contusion (12 had multiple contusions). At the time of 18F-FDG PET, 1 or more of the following sedative or analgesic medications were used in 13 patients: propofol in 3 of 21 (mean ± SD, 15.9 ± 9.2 μg/kg/min; range, 24.9–6.4 μg/kg/min), midazolam in 10 of 21 (4.3 ± 3.2 mg/h; range, 1–12 mg/h), morphine sulfate in 9 of 21 (3.4 ± 1.1 mg/h; range, 2–5 mg/h), and fentanyl in 1 of 21 (250 μg/h).
Twenty-seven healthy volunteers were recruited as control subjects (July 2000 through March 2002) to undergo an identical PET protocol. The inclusion criteria for recruitment were as follows: an age of 20–50 y, no prior history of head injury, no history of neurologic or psychiatric disease, and no current use of a medication or drug known to affect cerebral metabolism. From this control group, 18 subjects (12 male and 6 female) were included. Study data for these subjects (number of subjects) were not included in the analysis for the following reasons: inappropriate preparation (fasting) (1), significant movement during the PET study (6), and cross-calibration error (2). The mean ± SD age was 34 ± 8 y (range, 21–47 y).
All study procedures were performed with informed consent and were approved by the UCLA Institutional Review Board and the UCLA Radiation Safety Office.
Study Protocol
For TBI patients, routine clinical CT scans were obtained at admission as well as within 48 h of the PET studies. Patients were admitted to the intensive care unit after initial stabilization or surgical evacuation of an intracranial hematoma and were treated in accordance with previously described guidelines for the management of severe head injury (12). None of the contusions analyzed were surgically removed. PET scanning was performed at the earliest possible time after injury. Delays in PET scanning commonly were attributable to one or more of several factors, including pending informed consent, surgical procedures, hemodynamic stability, and PET facility availability.
PET
Each patient underwent a single PET session that consisted of 4 separate PET scans: 15O-CO, 15O-H2O, and 15O-O2 studies followed by the 18F-FDG study. For the purposes of this analysis, only the 15O-H2O PET study (for cerebral blood flow [CBF]) and the 18F-FDG PET study are considered.
Enteral and parenteral sources of glucose were withheld for at least 4 h before the PET study. TBI patients supported on mechanical ventilation received neuromuscular paralytic agents in addition to morphine sulfate or a benzodiazepine. Nonintubated TBI patients received either mild sedation (morphine sulfate, midazolam, or droperidol) or no additional medication. The healthy control subjects received no sedation. The lights in the room were dimmed, and the subjects were kept in an unstimulated condition. First, a transmission study was obtained for attenuation correction. Dynamic acquisition of PET and serial arterial blood sampling were started immediately after an intravenous injection of radiotracer. The 15O-water PET study preceded the 18F-FDG PET study. Administered doses were 555 MBq for 15O-water and 185 MBq for 18F-FDG. The acquisition protocol consisted of 26 frames (6 × 5 s, 9 × 10 s, 6 × 30 s, and 5 × 60 s) for 15O-water and 18 frames (4 × 30 s, 4 × 120 s, and 10 × 300 s) for 18F-FDG. Total acquisition times were 10 min for 15O-water and 60 min for 18F-FDG.
All PET data were acquired with a Siemens CTI ECAT HR+ scanner in the 3-dimensional acquisition mode (collimating septa retracted). To minimize the effect of scatter originating in activities outside the field of view, acquisition was done after manual installation of a lead shield annulus (Siemens CTI Neuro-Insert) with a 9-mm thickness and a 35-cm aperture. The scanner has 32 rings yielding 63 planes covering a 15.5-cm axial field of view. The intrinsic spatial resolution of the scanner is 4.3 mm in full width at half maximum at the center of the central axis of the gantry.
Acquired image sets were reconstructed by use of a filtered-backprojection method with a Hanning filter (cutoff frequency, 0.3 cycle per projection element) to generate 128 × 128 matrices. The spatial resolution of the resulting images was ∼5.5 mm in full width at half maximum. All dynamic scans were corrected for dead time, attenuation (with a 10-min transmission scan obtained immediately before the dynamic studies), scatter, and decay before image reconstruction.
Image Analysis
In order to anatomically localize contusions on the PET images, CT (obtained within 48 h of the PET study) and MR images were first rotated and shifted along a 3-dimensional axis to coregister to the 18F-FDG PET images. The coregistration algorithm was based on maximization of the mutual information between 2 images (13). Powell’s multidimensional search algorithm then was applied to search for the set of transformation parameters that maximized the mutual information (14,15). Finally, MR and CT images were rigidly transformed by use of these parameters to match the 18F-FDG PET images. The coregistered CT and MR images then were resliced into 63 planes to produce the same planes as the 18F-FDG PET images.
Regions of interest (ROIs) were defined on the coregistered CT or MR images superimposed on the 18F-FDG PET images. First, an ROI was defined to trace the contour of cortical contusional damage on a slice at the level of the contusion center (contusion area). The contusion was determined visually as the area showing a complete defect in 18F-FDG uptake accompanied by an abnormal CT or MRI appearance. The pericontusional cortex was defined as the cortex immediately adjacent to the contusion and located on the same plane as the contusion. A set of 3 circular ROIs, each 9 mm in diameter, was placed on the pericontusional cortex immediately to the right of the contusion. They were designated PC1, PC2, and PC3. The centers of PC1, PC2, and PC3 were located 4.5, 13.5, and 22.5 mm from the edge of the contusion, respectively. Similarly, another set of 3 ROIs (PC4, PC5, and PC6) was placed immediately to the left of the contusion. To evaluate the influence of the contusion on the surrounding tissues on the basis of the distance from the contusion boundary, quantitative values for PC1 and PC4 were averaged to represent the pericontusional cortex, which was located 4.5 mm from the contusion. This ROI was designated PC4.5. Similarly, the averages were calculated for PC2 and PC5 (PC13.5) and for PC3 and PC6 (PC22.5) (Fig. 2).

Examples of pericontusional ROIs. Average quantitative values for PC1 and PC4, for PC2 and PC5, and for PC3 and PC6 were calculated and designated PC4.5, PC13.5, and PC22.5, respectively.
To evaluate the influence of the contusion on the surrounding tissues on the basis of anatomic tissue damage, each pericontusional ROI was inspected visually to determine whether the ROI was placed on anatomically damaged tissue on the basis of coregistered MR or CT images. Anatomic tissue damage was defined as coregistered MR or CT images showing a significant signal change suggesting mechanical or nonmechanical tissue damage. Finally, an additional brain region was selected in the parietofrontal cortex at the level of the centrum semiovale. This region was identified as anatomically intact cortex, which visually showed 18F-FDG uptake comparable to that of other remote cortex regions, a normal CT or MRI appearance, and normal T2* intensity signals in the subcortical white matter. An ROI then was manually placed to surround the parietofrontal cortex on the side distant from the center of the contusion. This region was designated the remote cortex.
The 18F-FDG kinetic parameters were calculated from the dynamic activities obtained from tissue ROIs. Five parameters (K1, k2, k3, k4, and blood volume) were estimated by use of a nonlinear least-squares fitting technique (10). As an index of the glucose cerebral metabolic rate (CMRglc), the 18F-FDG uptake constant (Ki) was calculated as K1 × [k3/(k2 + k3)]. With an appropriate lumped constant (LC) (16) and the arterial plasma glucose concentration (Caglc), absolute values for CMRglc were related to Ki as (Caglc × Ki)/LC.
Regional CBF was obtained after generating a parametric image of CBF (in mL/g/min). The parametric image was calculated by use of a 1-compartment (2 parameters, K1 and k2) kinetic model for 15O-water. The first-pass extraction of water was fixed at 0.85 (17). Noise was reduced in the CBF image by use of a ridge-regression method (18–20).
Statistical Analysis
All parametric data were expressed as mean ± SD. For comparison of 2 groups, continuous and noncontinuous variables were analyzed with the Student t test and the Mann–Whitney nonparametric test, respectively. To examine the adequacy of the 18F-FDG model for tissue 18F-FDG kinetics, a runs test was applied to residuals of the model fit (21). Statistical significance was set at a P value of <0.05.
RESULTS
18F-FDG Uptake Patterns
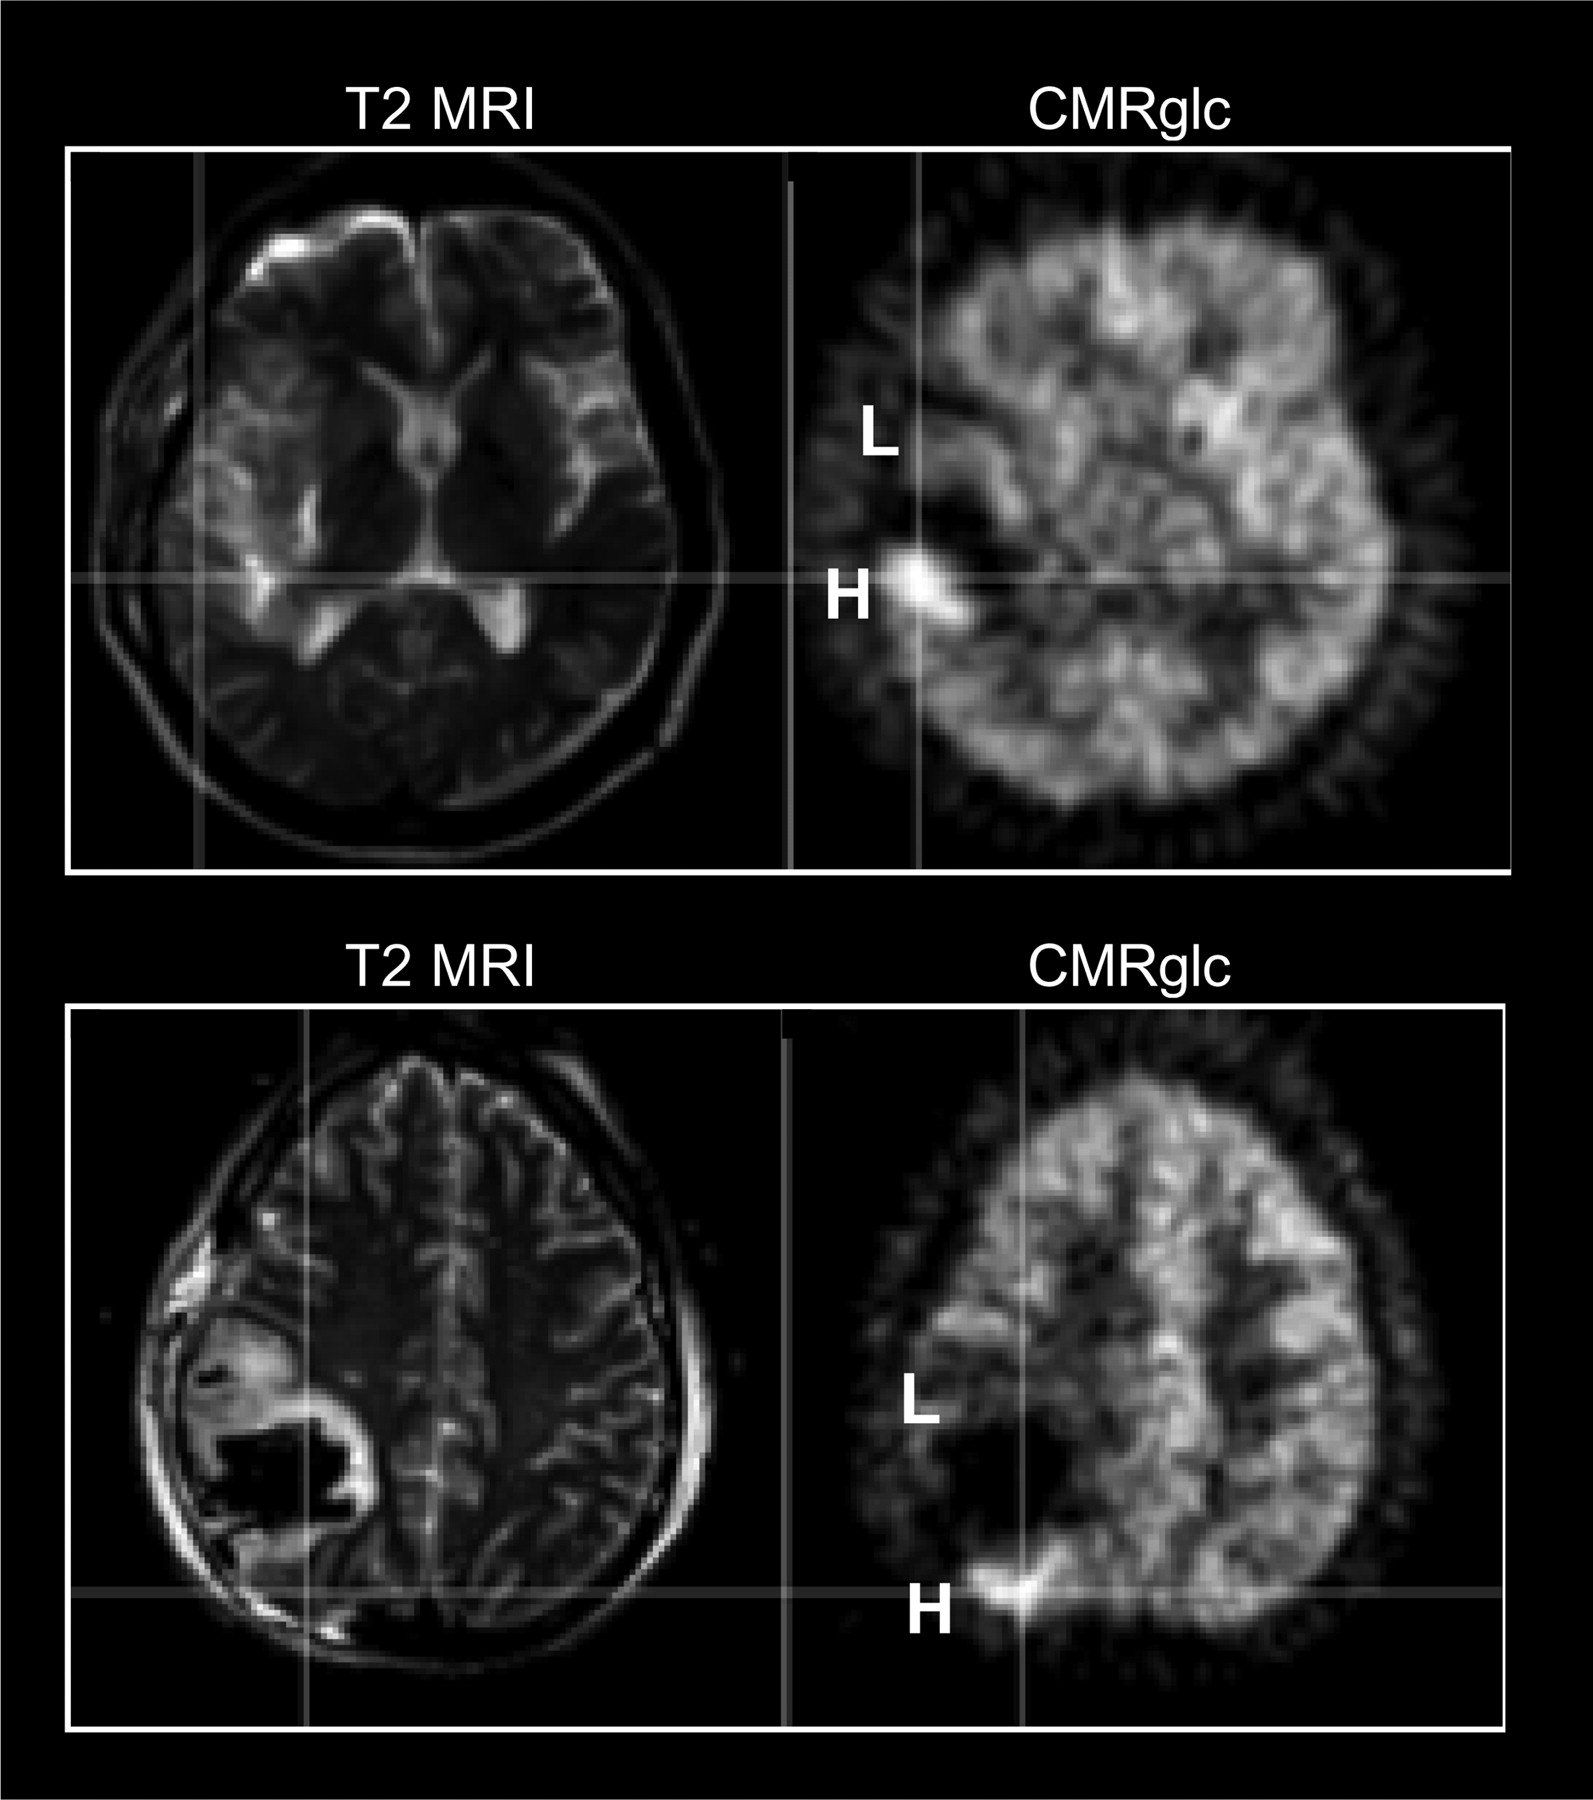
Visually, all patients showed a defect in 18F-FDG uptake (corresponding to the contusion) surrounded by a pericontusional area with heterogeneous 18F-FDG uptake. All patients had a pericontusional area showing reduced 18F-FDG uptake, as evidenced by high signal intensities on T2-weighted MR images. In addition, in 7 of 21 patients, portions of pericontusional areas showed increased 18F-FDG uptake (hot spots), as judged by visual inspection (Fig. 3). The CT or MRI findings for the hot spots were heterogeneous. In 4 of the 7 patients, the MRI or CT appearance was normal. One patient showed a slightly high signal intensity on T2-weighted MR images, whereas the remaining 2 patients showed hot spots at the interface of the contusion and tissue that appeared normal on MR images.

Examples of pericontusional hot spots. Pericontusional areas had either low (L) or high (H) CMRglc and were located immediately adjacent to the defect attributable to contusion. Coregistered T2-weighted MR images showed a slightly high T2 signal intensity (top) or an almost normal T2 signal intensity (bottom) in H areas, whereas signal intensity was mostly high in L areas.
Table 1 compares clinical parameters between patients with and patients without pericontusional hot spots on 18F-FDG PET images. There was no significant difference in age, initial GCS score, or timing of the PET scan (interval between the date of injury and the PET study) between patients with and patients without hot spots on 18F-FDG PET images. Diffuse axonal injury (punctate white matter hemorrhages on MRI) was observed in 3 patients with hot spots and in 7 patients without hot spots.
Comparison of Clinical Parameters
Kinetic Parameter Analysis
Kinetic parameters for 18F-FDG and CBF are summarized in Table 2. Compared with healthy volunteers, TBI patients showed significantly lower Ki values for 18F-FDG, even in the remote cortex, whereas CBF values did not differ significantly. In addition to Ki values, k3 and k4 values were significantly lower in the remote cortex of TBI patients than in the healthy cortex, whereas K1 and k2 values did not differ significantly. Fitting of tissue 18F-FDG kinetics with the 18F-FDG model showed that the model was consistent with 18F-FDG kinetics in TBI patients. The results of a runs test on the residuals of the model fit did not show systematic deviations in the residuals of the fit for TBI patients (z score, −0.03 ± 1.0; n = 168; P > 0.05) or for healthy volunteers (z score, −0.24 ± 0.95; n = 18; P > 0.05).
Summary of PET Parameters
In comparisons of pericontusional ROIs in patients, K1 and CBF values were found to be lower in ROIs near contusions, whereas k3 values did not show a clear trend with distance from contusions (Table 2). In addition, variations in data were larger for k3 values, particularly in pericontusional areas proximal to contusions. To examine the large variability in pericontusional areas, we compared kinetic parameters between 2 groups of ROIs—those placed in areas with anatomic tissue damage, as evidenced by CT or MRI (n = 70), and those placed in areas without anatomic tissue damage (n = 56). Pericontusional areas with tissue damage showed significantly lower Ki (0.015 ± 0.007 vs. 0.021 ± 0.010 mL/min; P < 0.001), CBF (0.31 ± 0.14 vs. 0.39 ± 0.12 mL/g/min; P < 0.01), and K1 (0.061 ± 0.028 vs. 0.086 ± 0.030 mL/min; P < 0.0001) values than did areas without such damage; the k3 values did not differ significantly between the 2 groups (0.058 ± 0.038 vs. 0.073 ± 0.065/min; the P value was not significant) (Fig. 4).
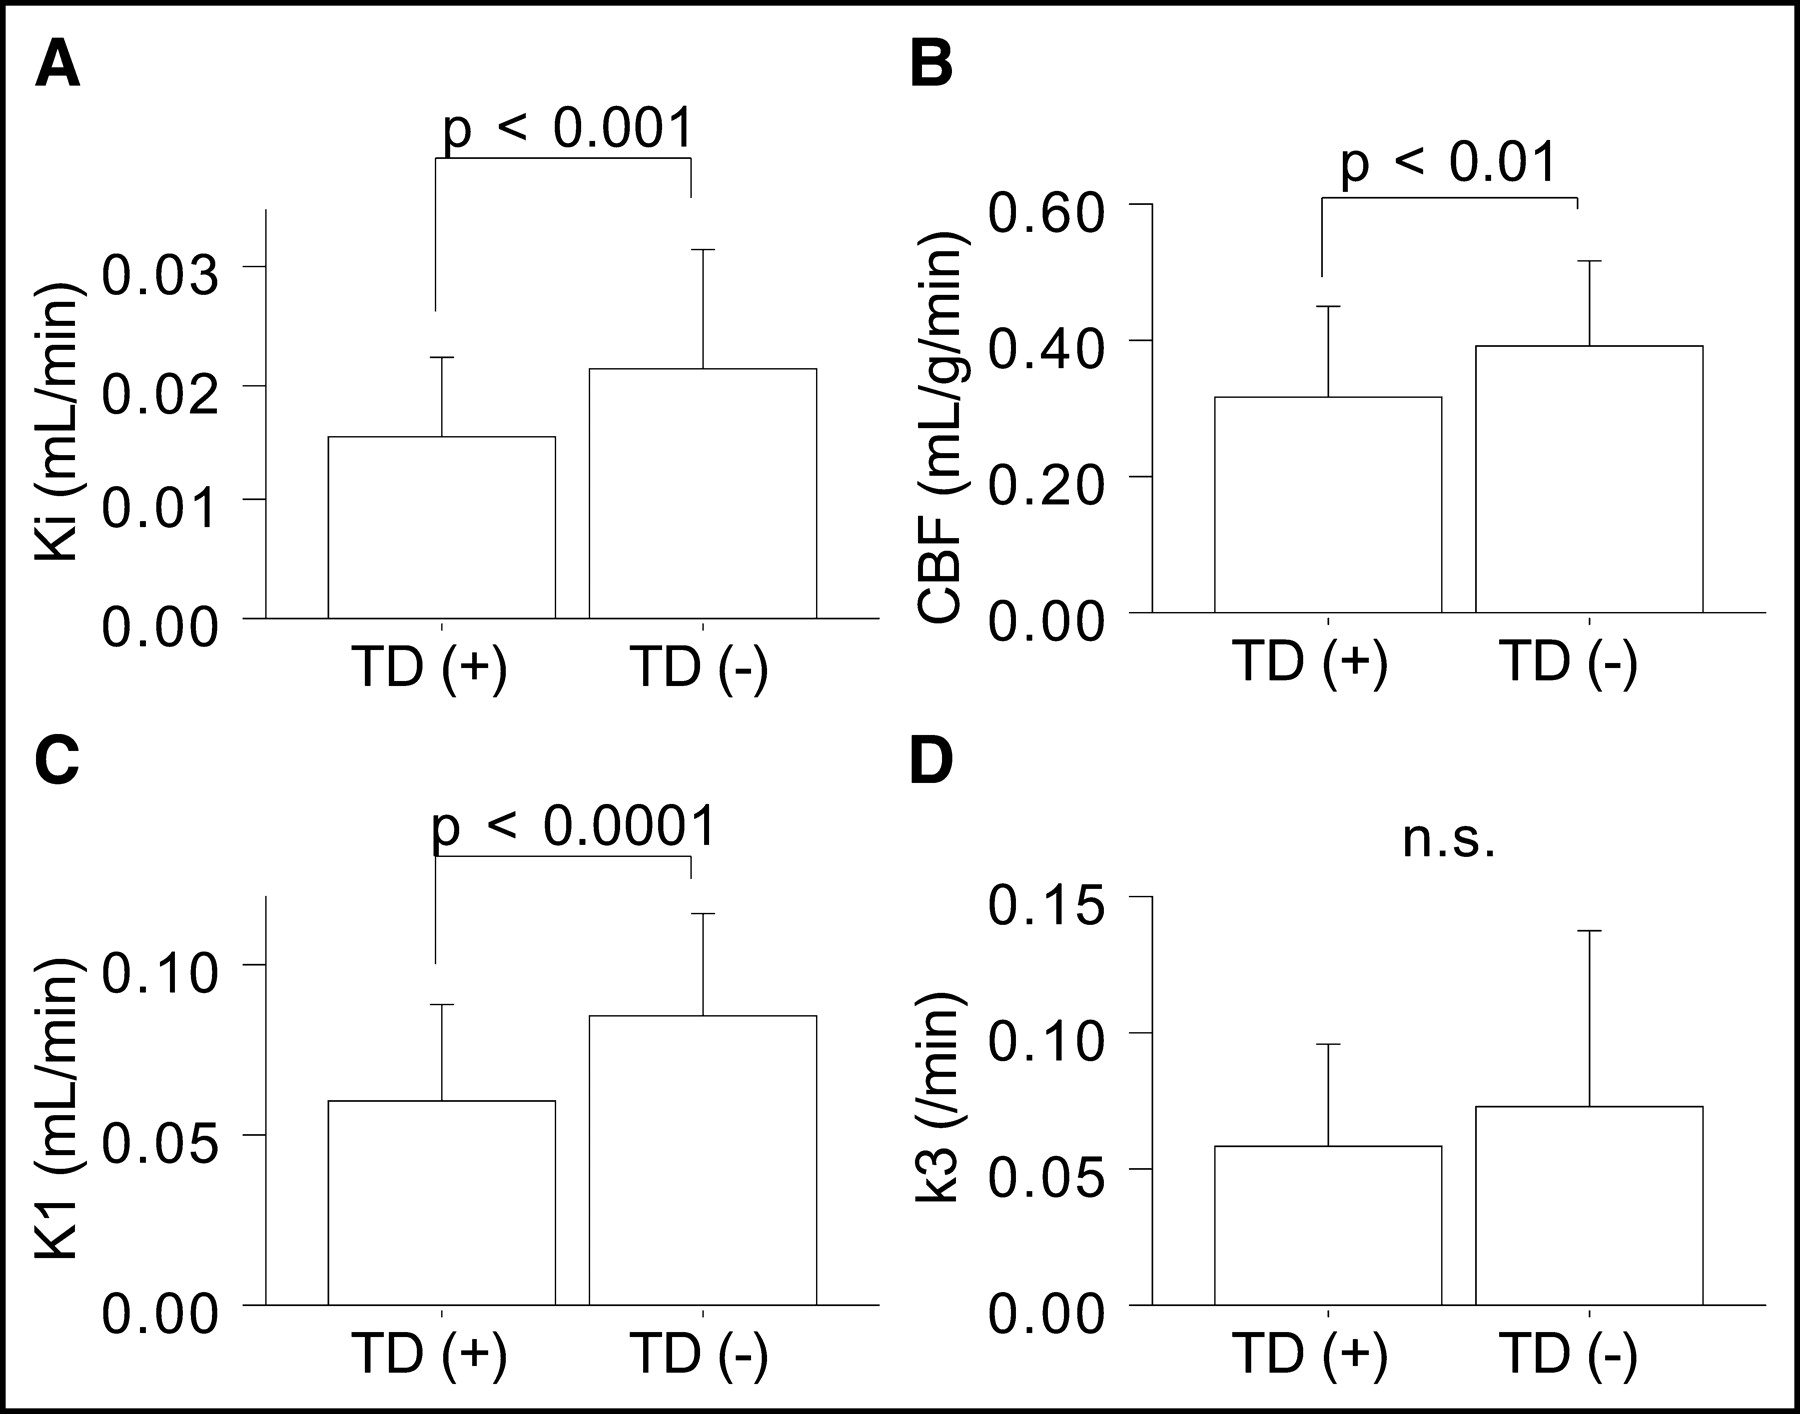
Comparison of CBF and 18F-FDG kinetic parameters between ROIs with (n = 70) and ROIs without (n = 56) anatomic tissue damage (TD) in pericontusional areas. n.s. = not significant.
Pericontusional Hot Spots
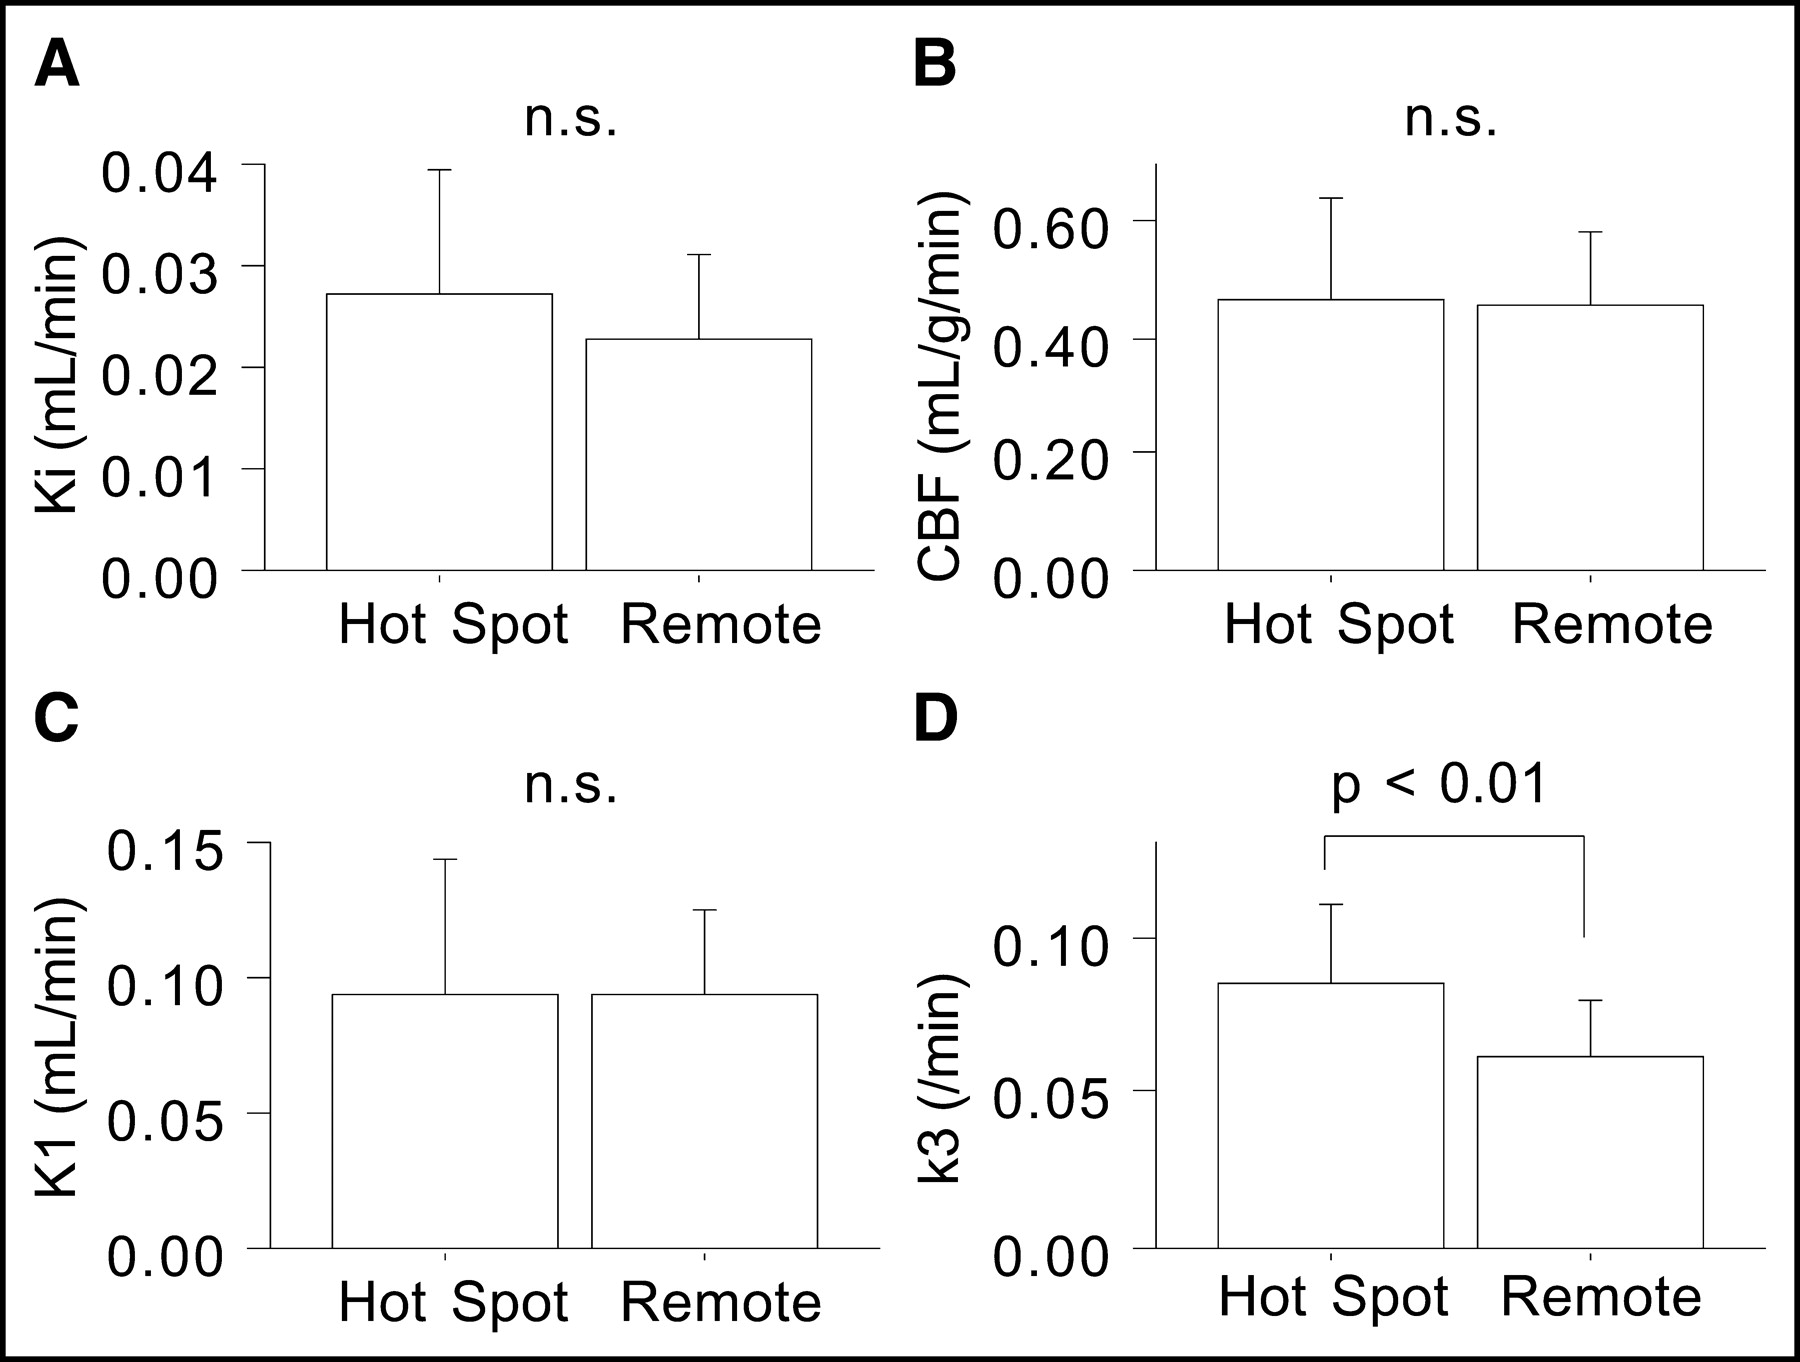
Investigating 18F-FDG PET images more closely, we found regional 18F-FDG uptake at >117% of the mean remote cortex value to be consistent with visually determined hot spots. When kinetic parameters for the hot spots (n = 7) were compared with parameters for the remote cortex (n = 21), only the k3 value (0.086 ± 0.024/min) was significantly higher (P < 0.01); Ki (0.027 ± 0.012 mL/min), CBF (0.47 ± 0.18 mL/g/min), and K1 (0.094 ± 0.050 mL/min) values were not significantly different (Fig. 5). In pericontusional areas, patients with hot spots (n = 7) had significantly higher Ki and k3 values in PC4.5 (P < 0.05) and higher k3 values in PC22.5 (P < 0.05) than did patients without hot spots (n = 14) (Fig. 6); K1 and CBF values were not significantly different in any of the pericontusional areas.

Comparison of CBF and 18F-FDG kinetic parameters between regions with hot spots (n = 7) and the remote cortex (n = 21). n.s. = not significant.
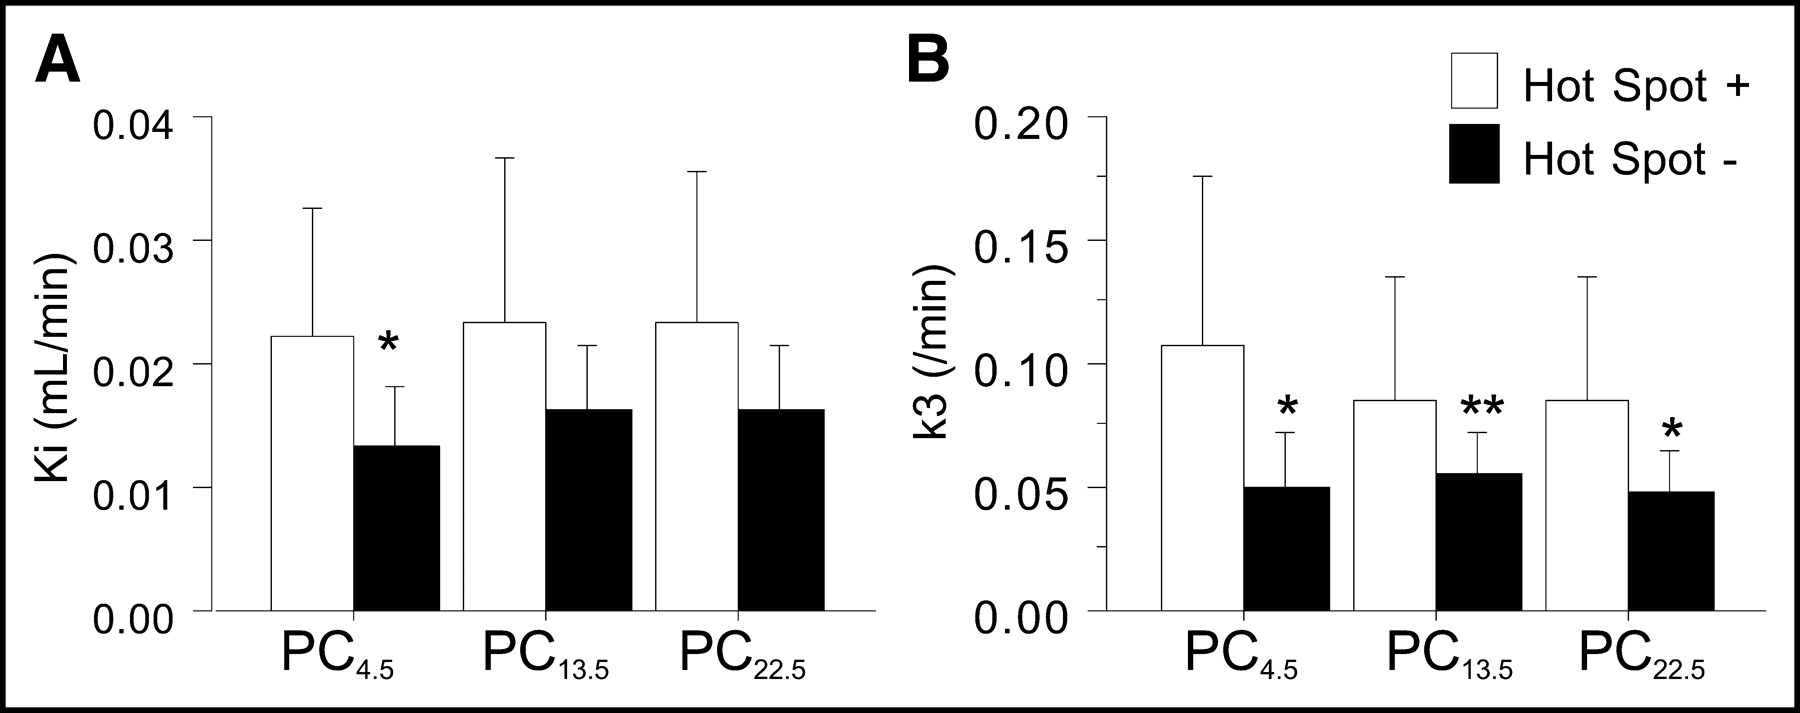
Comparison of Ki and k3 values between patients with (n = 7) and patients without (n = 14) pericontusional hot spots. Single and double asterisks indicate differences between the 2 groups (P < 0.05 and P < 0.1, respectively).
Medication Effect
Among the 13 patients receiving sedatives or analgesics during the PET protocol, 1 was receiving an analgesic (fentanyl), 3 were receiving sedation (propofol or midazolam), and 9 were receiving both a sedative and an analgesic (morphine with propofol or midazolam). The effect of medication on Ki values was not significant in the remote cortex (analgesic only, 0.014 mL/min; sedative only, 0.019 ± 0.005 mL/min; both medications, 0.027 ± 0.009 mL/min; and no medication, 0.019 ± 0.007 mL/min) or in pericontusional areas. Similarly, no significant medication effect was observed for CBF or for any of the kinetic parameters for 18F-FDG.
DISCUSSION
The results of this study demonstrated significantly lower K1 values in pericontusional regions than in remote regions. In addition, the K1 values in the remote cortex in TBI patients were preserved, showing no significant difference from cortical K1 values in healthy volunteers. On the other hand, k3 values were significantly reduced in TBI patients, even in remote areas. This study assumed a standard 2-compartment model for 18F-FDG kinetics (Fig. 1). In this model, the movement of 18F-FDG from the plasma to the tissue compartment represents primarily the BBB-related transport of 18F-FDG and thus reflects the activity of the glucose transporter. The boundary between 18F-FDG and 18F-FDG-6-phosphate in tissue represents enzyme-catalyzed chemical reactions and thus may reflect hexokinase activity (11).
The model for 18F-FDG kinetics and its interpretation originally were proposed for healthy cerebral tissue. It may be argued that the application of this model to TBI in this study requires a new model for 18F-FDG kinetics with more complicated compartments or a unique interpretation of the 2-compartment model. For example, K1 also may include extravasation of the tracer into the extracellular space. However, a modified model for 18F-FDG kinetics would affect the interpretation of the data more (i.e., glucose transport vs. BBB disruption). In this study, there were no systematic deviations in the model fit of 18F-FDG kinetics in TBI patients (a runs test showed random arrangements of the residuals of the fit). These findings suggest that 18F-FDG kinetics in TBI patients are consistent with the standard model for 18F-FDG kinetics and therefore do not require a new model.
It may also be argued that the current observations on 18F-FDG kinetics cannot be applied to estimating the kinetics of physiologic glucose metabolism because the results of this study were based on the assumption that transport and phosphorylation ratios for 18F-FDG and native glucose are fixed (22). We consider this assumption to be theoretically valid because these ratios are related to ratios for Michaelis constants that reflect the different affinities of the relevant proteins for the 2 substrates (23,24). The LC is commonly used to account for this difference. We did not calculate absolute values for CMRglc in this study, because no consensus has yet been established on the value of LC (particularly its regional variations) in patients with TBI. Although Hattori et al. previously determined absolute values for CMRglc by using different pooled LC values for healthy control subjects (LC, 0.66) and TBI patients (LC, 0.40) (25), we did not use these global (whole-brain) LC values because they were calculated solely from remote (nonpericontusional) cortex. There is greater uncertainty about the stability of the LC in pericontusional regions.
If one uses the standard interpretation of the model for 18F-FDG kinetics, pericontusional reduction of K1 values and global reduction of k3 values in TBI suggest that glucose transporter activity is relatively resistant but that hexokinase activity is sensitive to TBI. We found that pericontusional areas with tissue damage had significantly lower Ki, CBF, and K1 values than did areas without such damage, whereas k3 values did not differ significantly between the 2 groups. The difference in the susceptibility to traumatic impact may explain the different findings for K1 and k3 values in the remote cortex or in areas with and areas without anatomic tissue damage. Previous animal experiments indicated that glucose transporters are resistant to traumatic impact (26,27). The results of this study are in agreement with the results of previous experiments in that glucose transporter activity was impaired in the pericontusional areas but not in the remote cortex. A clinical histopathologic study with light microscopic immunochemical analysis also revealed reduced glucose transporter levels in areas close to contusions (28).
The mechanism of reduced hexokinase activity in apparently noninjured cortical (remote) areas is unknown. After being transported into brain tissue, 18F-FDG is phosphorylated immediately and is effectively trapped inside the cell. The enzyme hexokinase catalyzes this initial step irreversibly at the expense of ATP. Although glucose may follow the glycolytic (aerobic or anaerobic), pentose phosphate, or glycogen synthesis pathways, the initial step is common for all pathways. Hexokinase is an allosteric enzyme that is strongly inhibited by its product (glucose-6-phosphate) (29); therefore, reduced hexokinase activity (k3) may reflect the regional accumulation of glucose-6-phosphate. From this point of view, reduced k3 values in the remote cortex may indicate a reduction in the overall metabolic activity of glucose. Because remote areas showed no anatomic damage, it is reasonable to consider that the reduction in k3 values reflects a functional reduction in regional brain activities. Either traumatic impact itself or the use of medication may suppress cerebral function in patients with TBI. In this study, 20 of the 21 patients examined had an impaired consciousness level (GCS score, ≤10) at the time of the PET scan, a factor that may have directly reduced CMRglc (25). In addition, a sedative or an analgesic was used in 13 of the 21 patients. It was reported that therapeutic doses of diazepam and morphine might decrease by 20% and by 5%–15%, respectively, the CMRglc found during normal awake conditions (30,31). Although we did not observe a significant effect of drug use on PET parameters, it is not clear whether these drugs affect hexokinase activity specifically to suppress brain activities in the acute posttraumatic state.
Another key finding of this study was that the patterns of 18F-FDG uptake were heterogeneous in pericontusional areas. All patients had pericontusional areas showing visually decreased 18F-FDG uptake (Fig. 3, L), and portions of pericontusional areas showed regionally increased 18F-FDG uptake (Fig. 3, H) in a subgroup of patients (7/21). Changes in glucose utilization after TBI were first studied systematically in animal experiments with concussive head injury (1). TBI caused an immediate increase in cerebral glucose metabolism in the ipsilateral cortex (up to 30 min) and then a relatively long period (up to 10 d) of decreased metabolism (1). The initial hypermetabolic state, however, is not a universal finding with respect to cerebral contusions. Glucose metabolism can be either decreased (32) or increased (3) with experimental cerebral contusions. The results of this study generally agree with those of these animal experiments, showing lower 18F-FDG uptake in the ipsilateral cortex (especially in contusional and pericontusional areas) and focally higher 18F-FDG uptake in a subgroup of patients (7/21). Compared with the animal experiments showing a hemispheric increase in 18F-FDG uptake, the hot spots in this human 18F-FDG PET study were limited to small areas around contusions. The longer interval between traumatic injury and PET investigation in this human study might have allowed partial recovery of the disturbance of glucose metabolism, explaining the smaller presentation of regionally increased 18F-FDG uptake (hot spot).
Kinetic analysis demonstrated particularly higher k3 values in hot spots, whereas other kinetic parameters did not differ significantly from those in the remote cortex. As a result, when we compared 18F-FDG PET parameters in pericontusional areas in patients with and patients without hot spots, we observed significantly higher k3 values in pericontusional areas in patients with hot spots, whereas K1 and CBF values were not significantly different. If k3 reflects hexokinase activity, then the results of this study may suggest regionally increased hexokinase activity rather than increased glucose transporter activity as the mechanism responsible for pericontusional hot spots. Although previous animal and human experiments did not identify the mechanism responsible for high levels of 18F-FDG uptake after TBI, several hypotheses were proposed; these included anaerobic glycolysis similar to ischemia or hypoxia (33), ionic perturbation (34), and release of excitatory amino acids (35). In particular, recent evidence suggested that glutamate-mediated glycolysis is the mechanism responsible for increased 18F-FDG uptake after TBI (35–38). A recent study reporting activated excitatory neurotransmitter release during the acute phase of human TBI also can explain increased glycolysis (39). Considering the putative preference of glycolysis for glial cells as the energy source (40), it is also possible that the results of this study suggest regionally increased glial metabolic activity.
The results of this study did not conflict with the above hypotheses because activation in any step of glycolysis will result in higher levels of hexokinase activity. However, BBB leakage or cerebral ischemia is unlikely to explain the increased 18F-FDG uptake. Although located in the pericontusional areas, the hot spots appeared mostly normal on CT or MRI. We did not use contrast-enhanced MRI to visualize BBB leakage, but it is known that destruction of the BBB is observed only during the hyperacute phase (within 30 min after TBI) (41–43). Considering the timing of PET imaging (3.1 ± 2.1 d after injury) and the normal appearance on nonenhanced MRI, it is unlikely that our patients would have shown any signs of BBB leakage in the areas of the hot spots. In addition, CBF was not significantly lower in patients with hot spots than in patients without hot spots. In fact, k3 values were associated with slightly higher K1 and CBF values, although the differences were not significant. Considering the preserved level of regional CBF, ischemic activation of anaerobic glycolysis is not likely to explain regionally increased k3 values.
CONCLUSION
On the basis of the standard interpretation of a 2-compartment model for 18F-FDG kinetics for TBI, hexokinase activity was found to be reduced even in apparently uninjured cortex, whereas glucose transporter activity was impaired only in the areas immediately around the contusions, particularly those with anatomic tissue damage. Pericontusional high levels of 18F-FDG uptake observed in a subgroup of patients could have been a result of regionally increased hexokinase activity.
Acknowledgments
The study was supported by NINDS 30308, DOE DEFC0387-ER630615, and the Lind Lawrence Foundation.
Footnotes
Received Oct. 10, 2003; revision accepted Dec. 16, 2003.
For correspondence or reprints contact: Naoya Hattori, PhD, Department of Molecular and Medical Pharmacology, David Geffen School of Medicine, University of California at Los Angeles, Box 956948, Los Angeles, CA 90095-6948.
E-mail: nhattori{at}mednet.ucla.edu


