


Article Figures & Data
Figures
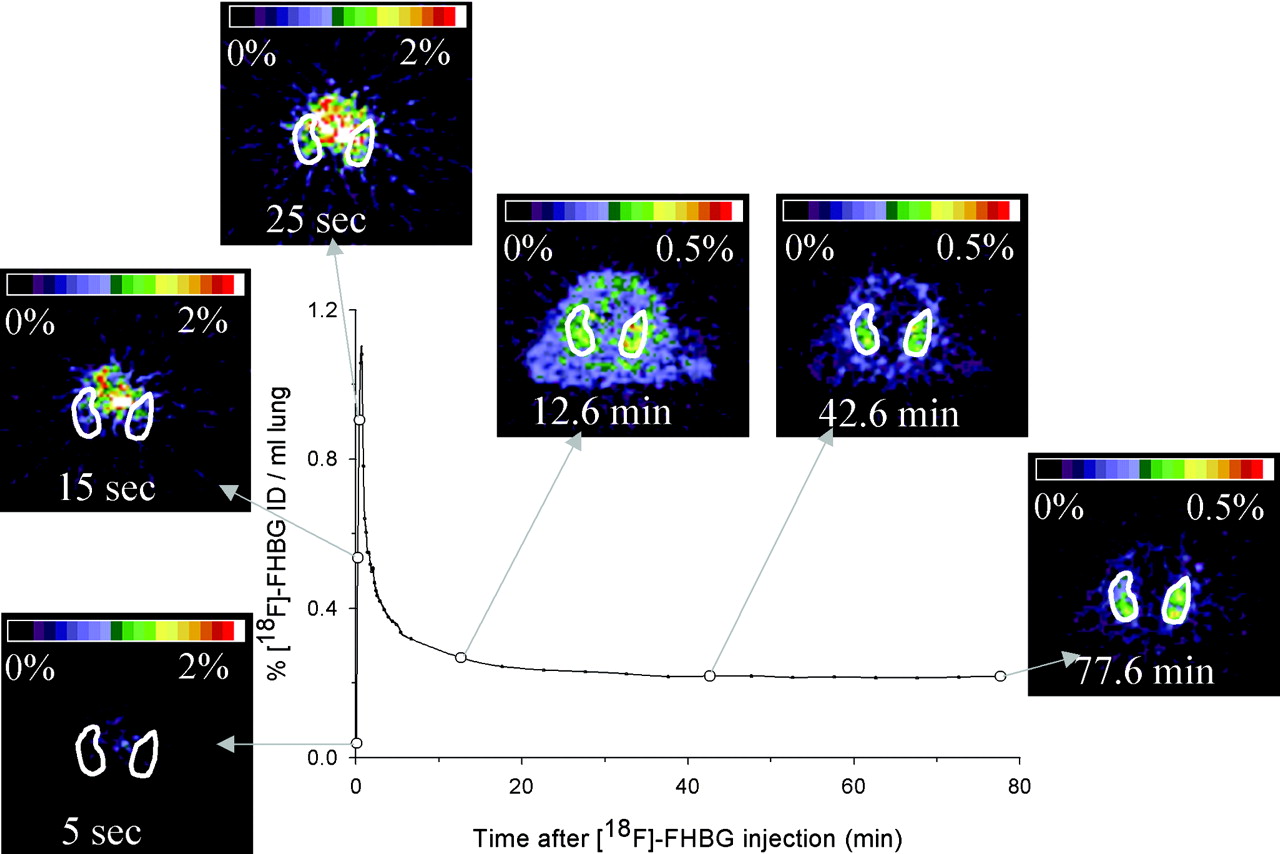
- FIGURE 1.
Generation of pulmonary time–activity curve from multiple-image dataset from 1 experimental animal. Pulmonary ROIs are drawn on multiple transverse slices of PET image and subsequently merged to obtain measurement of pulmonary radioactivity originating from whole lung volume at time of PET image data acquisition. These ROIs are then superimposed on images obtained at each sampling time with PET, to generate lung time–activity curve. For clarity, only 1 of multiple transverse thoracic slices is displayed at 6 of 37 time points. Color scale is shown on top of each PET image and expressed as percentage of 18F-FHBG injected dose. ID = injected dose.
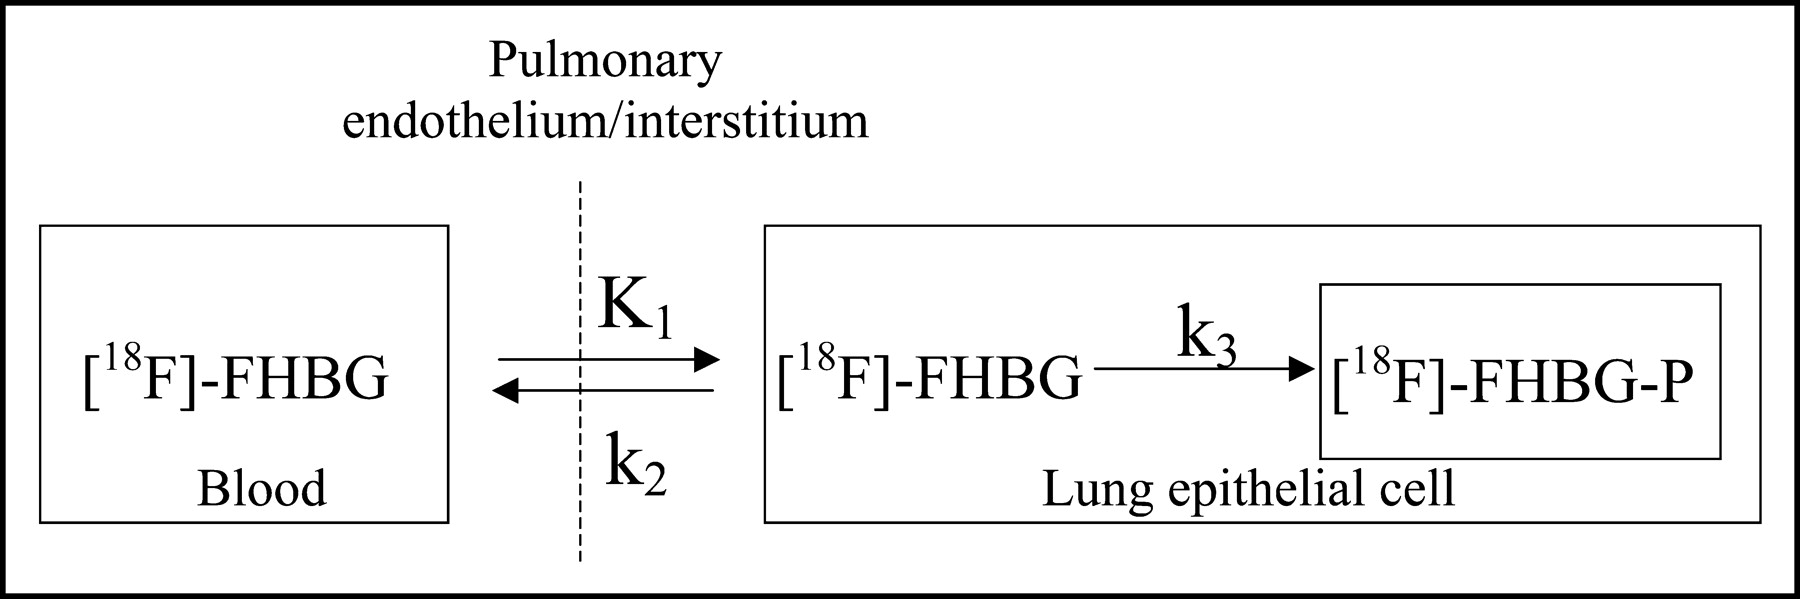
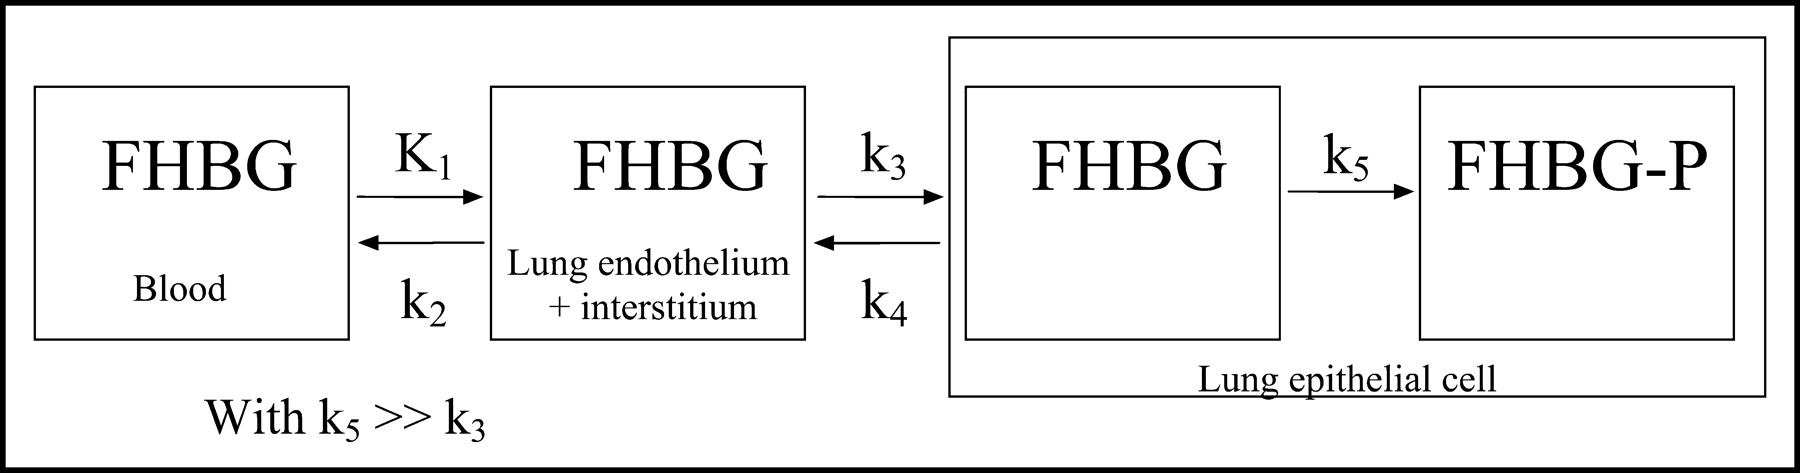
- FIGURE 2.
Diagram of 3-compartment model representing 18F-FHBG kinetics within lungs. In this model, K1 and k2 are rate constants representing transport of 18F-FHBG into and out of cells, and k3 represents rate of phosphorylation of 18F-FHBG in cells expressing viral TK. Since 18F-FHBG-P is assumed to be trapped intracellularly, k4 (rate constant representing 18F-FHBG dephosphorylation) was not included in model.
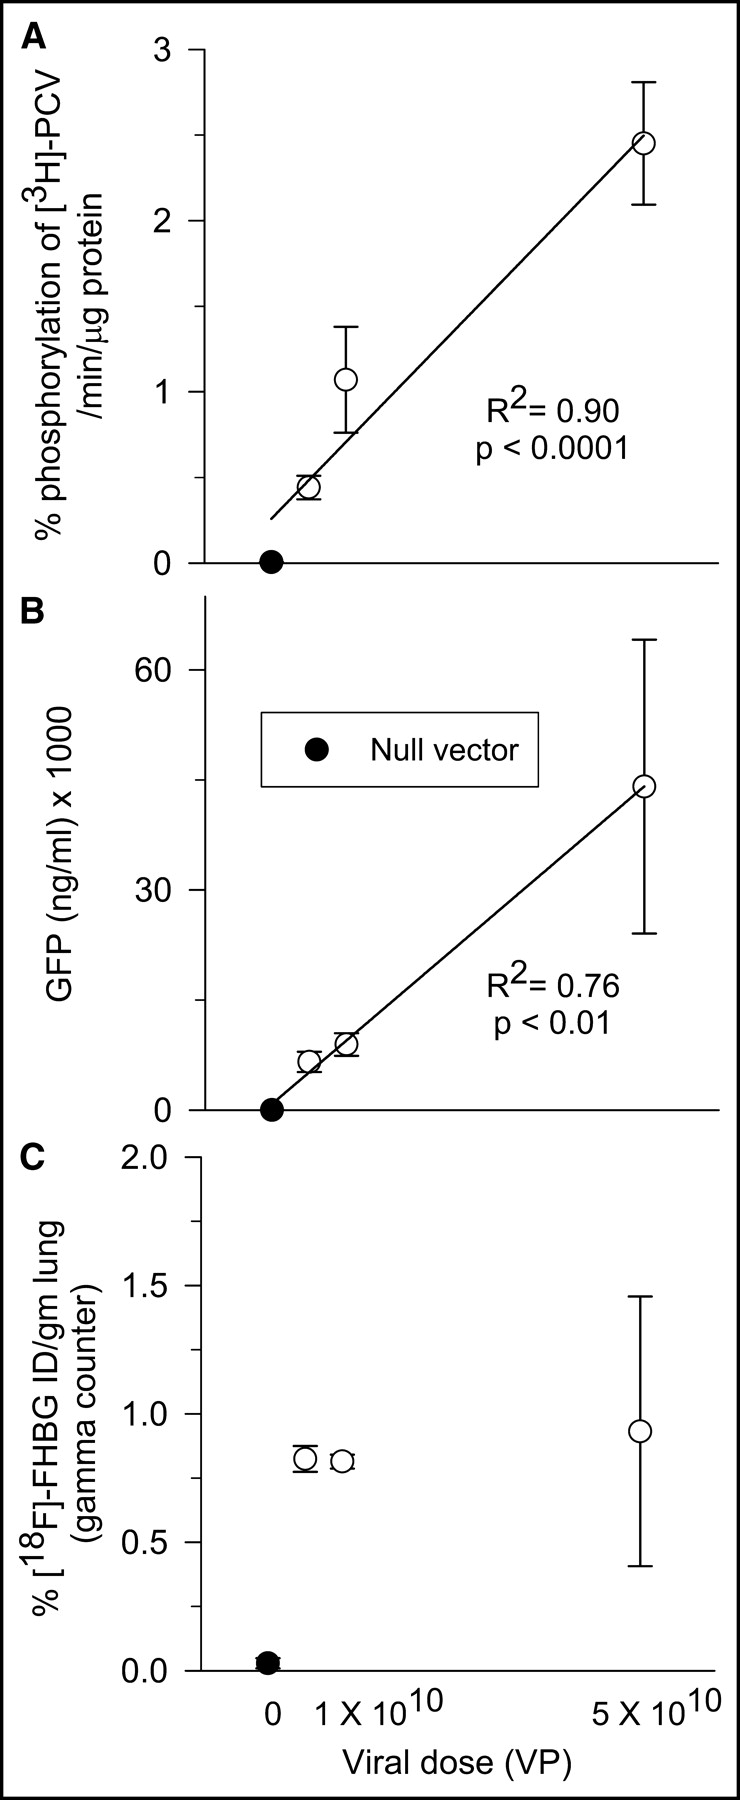
- FIGURE 3.
Quantitation of mHSV1-TK enzyme activity (A), eGFP levels (B), and 18F-FHBG lung uptake (C) as function of viral dose in 9 rats without lung injury. ○, Mean values at each of viral doses of Ad-CMV-mNLS-HSV1sr39tk-egfp (5 × 10⁹ VP [n = 2 rats], 1 × 10¹⁰ VP [n = 2 rats], 5 × 10¹⁰ VP [n = 3 rats]). •, Mean values measured in control animals (n = 2). Bars are SDs. Linear regression was performed on data points from all rats and corresponding regression line is displayed when slope was statistically significant compared with slope of zero. PCV = penciclovir.
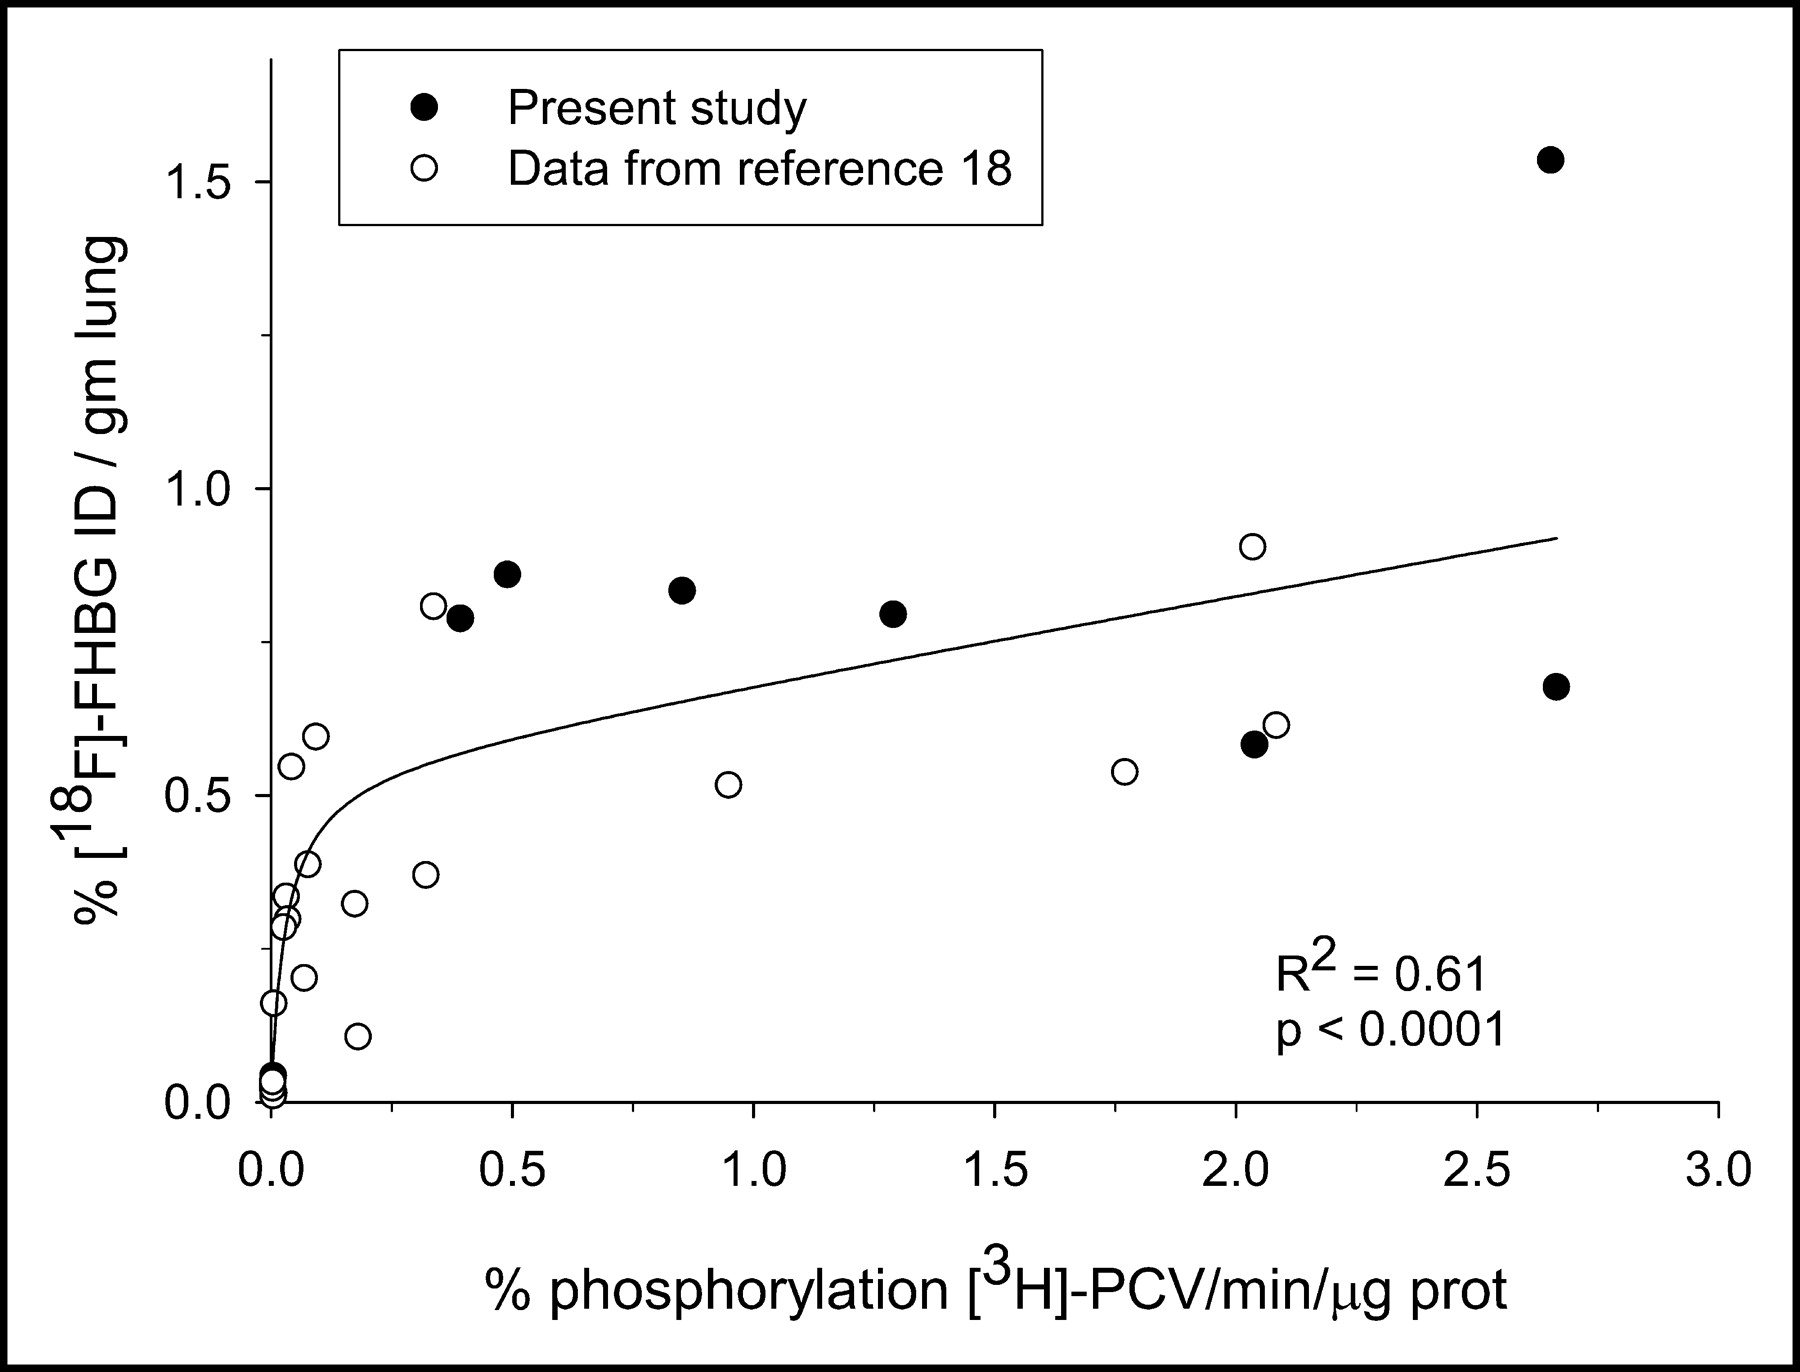
- FIGURE 4.
Relationship between lung uptake of 18F-FHBG and mHSV1-TK enzyme activity in 28 rats. Results of 9 rats of this study without lung injury (•) are combined with data of 19 rats from previous study of our group (○ (18)). Data were fitted to a hyperbolic equation, and corresponding regression curve and R2 are displayed. PCV = penciclovir.
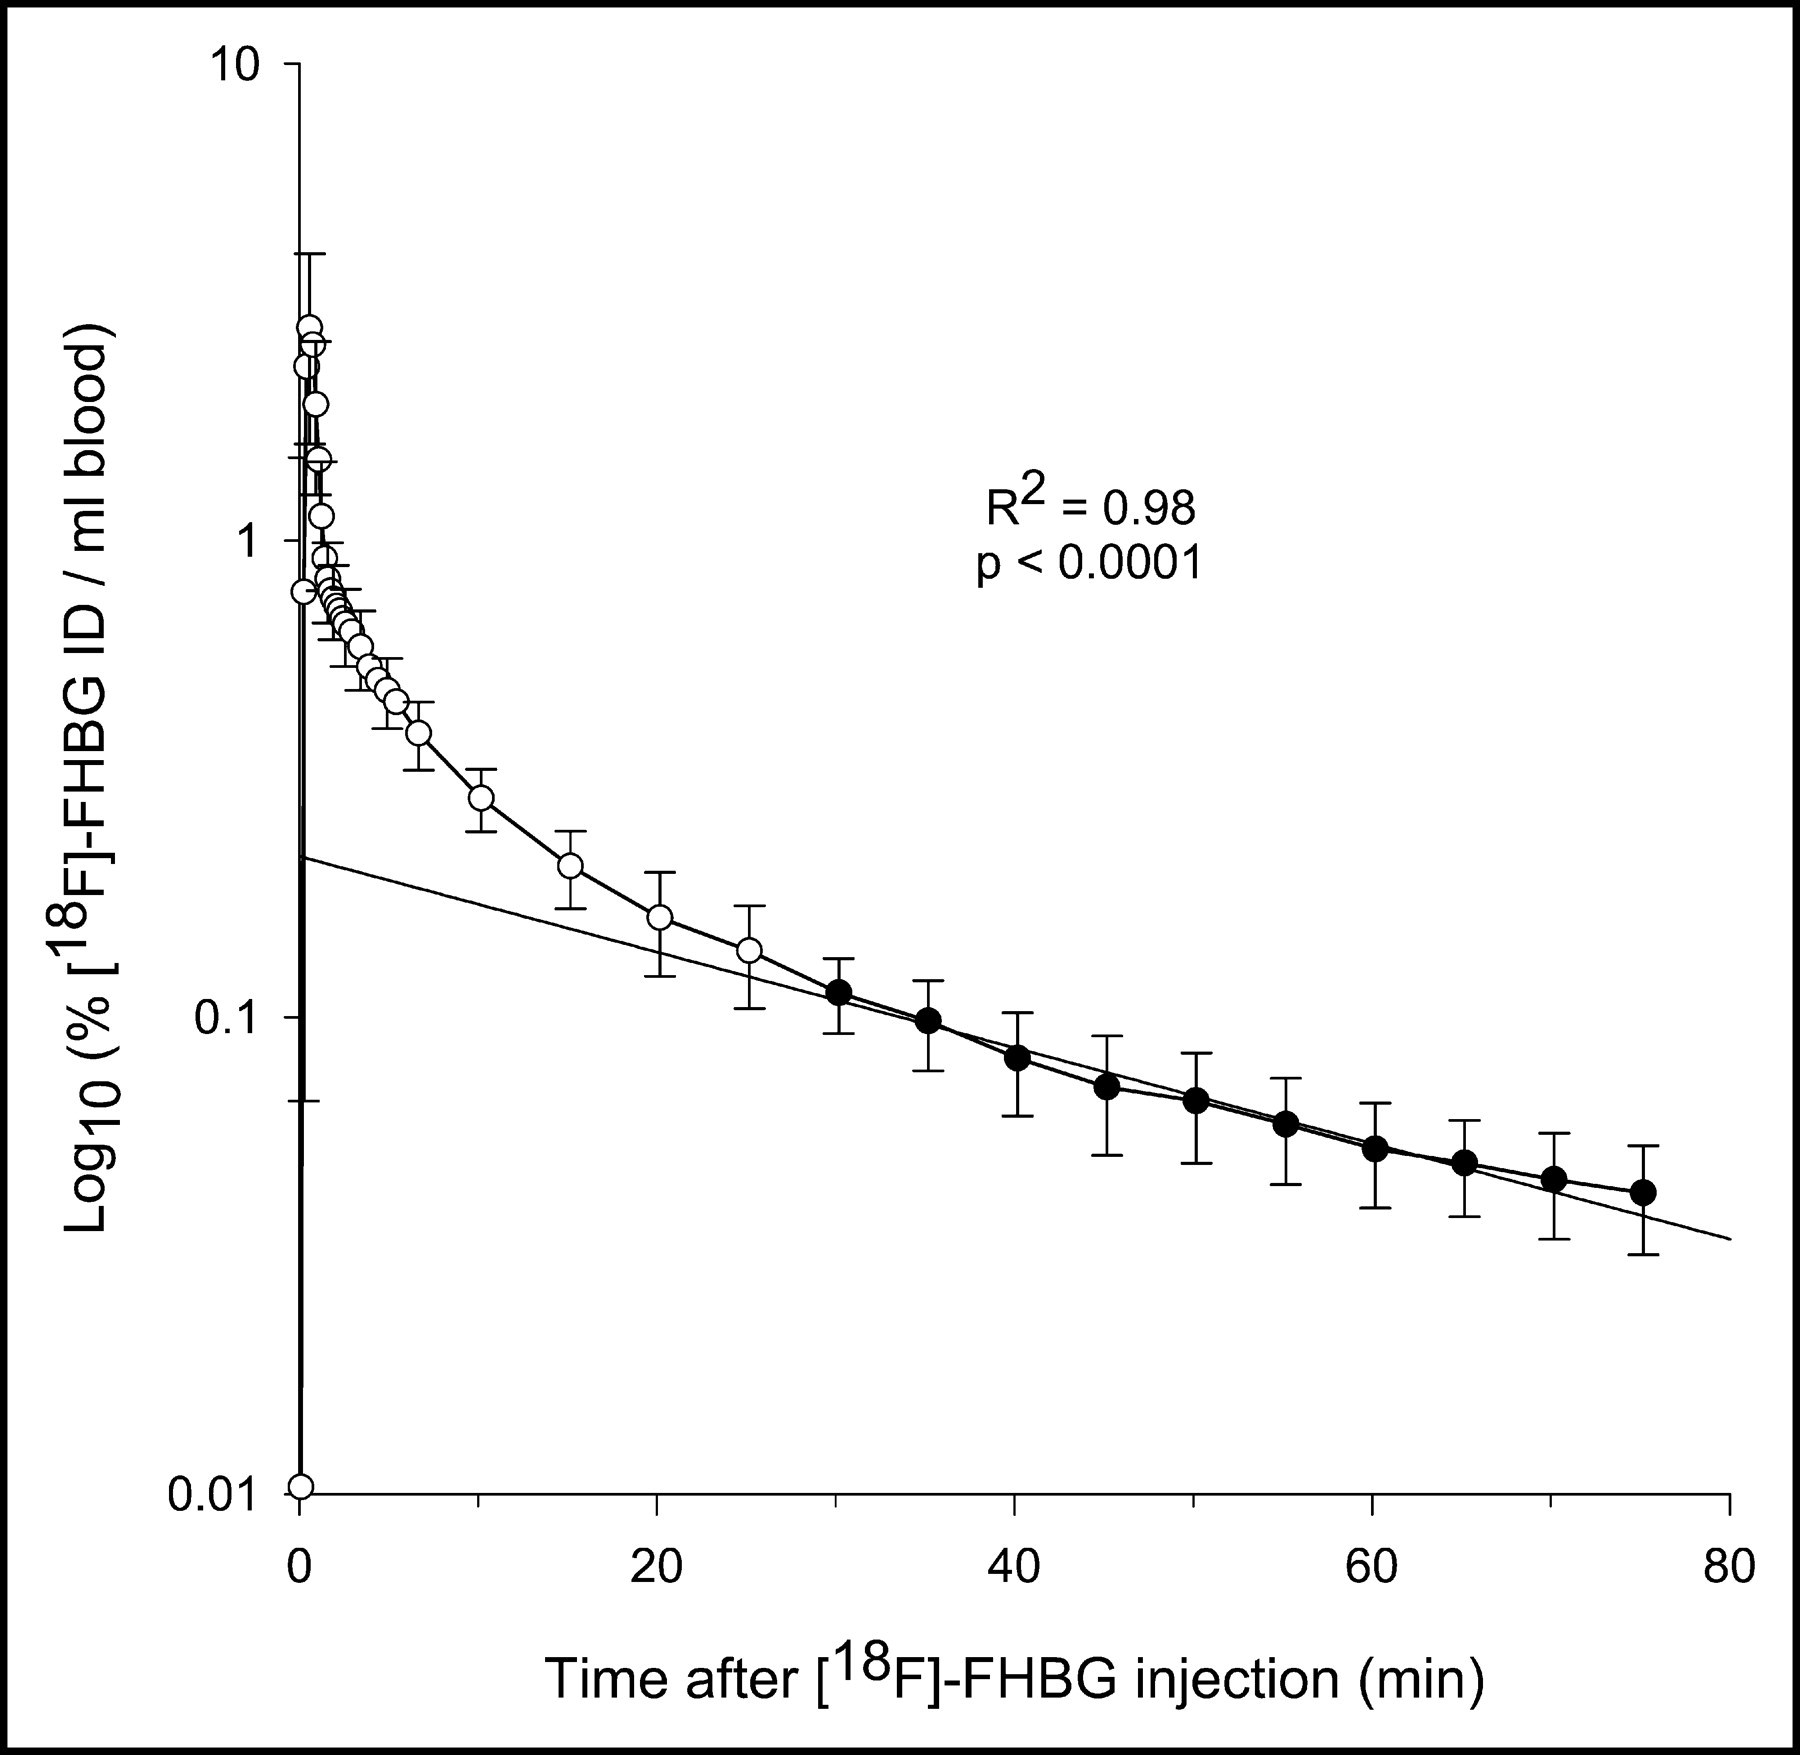
- FIGURE 5.
Blood pharmacokinetics of 18F-FHBG. Data points are average values of blood radioactivity for 9 rats of study and bars are SDs. ○, Data points collected during first 30 min. •, Subsequent data points fitted with monoexponential equation. Corresponding regression line coefficients of determination R2 are displayed. For clarity, some SD bars were omitted.
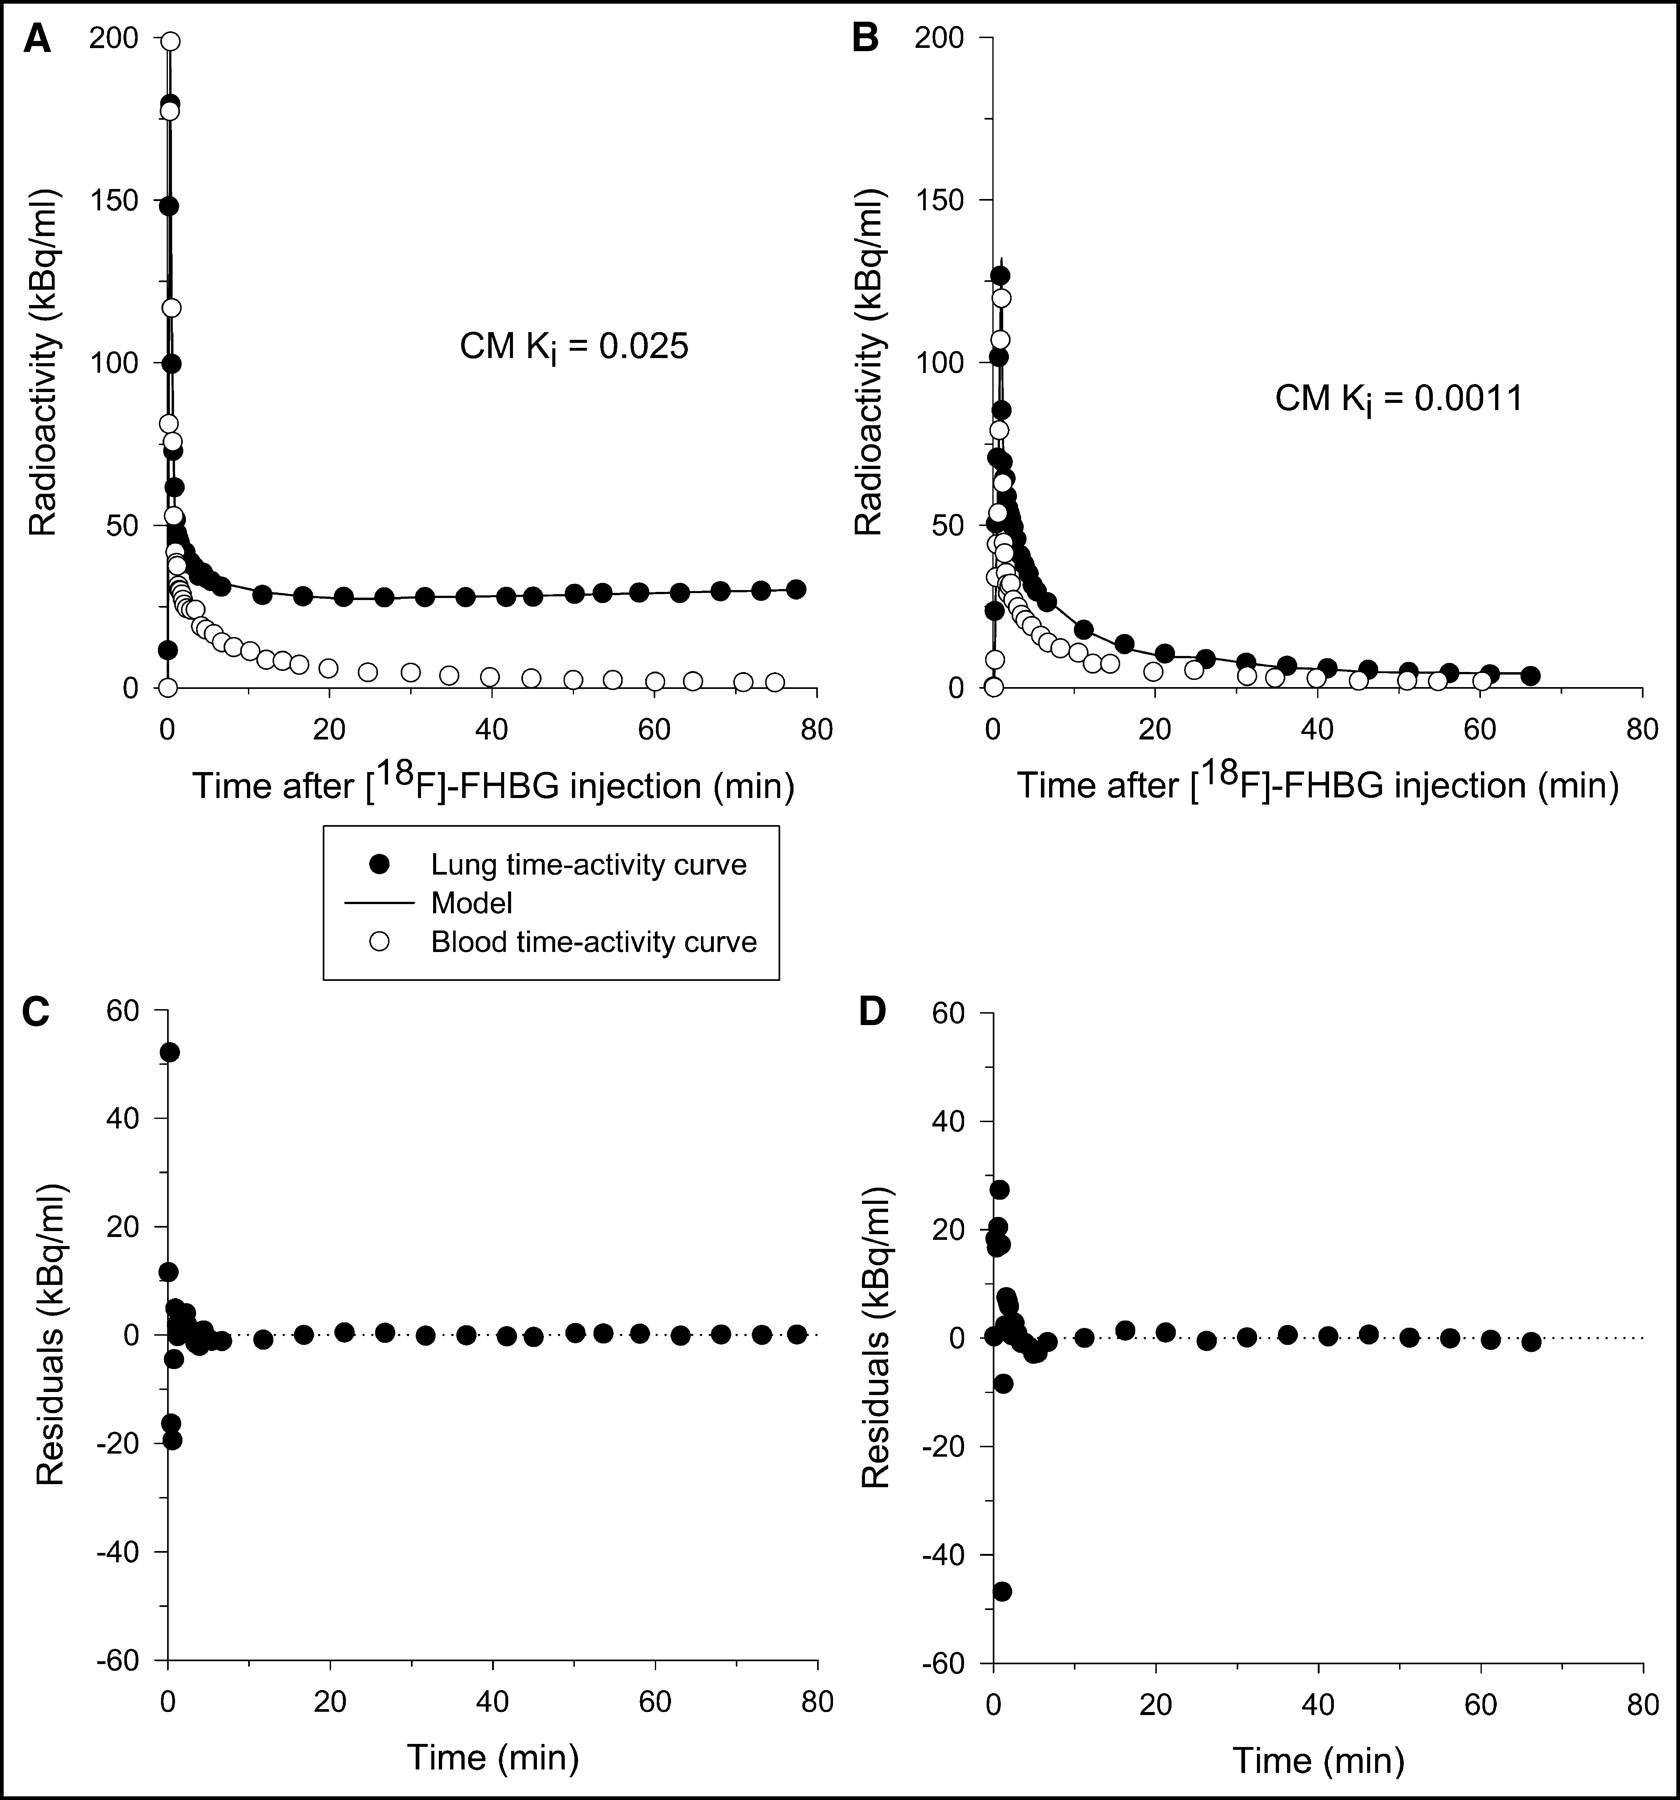
- FIGURE 6.
Examples of curve fitting using compartmental modeling obtained in 2 rats infected with Ad-CMV-mNLS-HSV1sr39tk-egfp (A) and with null vector (B), respectively. Blood (○) and lung (•) time–activity curves are displayed. Continuous line represents fitted lung data points using 3-compartment model shown in Figure 2. (C and D) Corresponding plots of residuals over time from regression analysis. CM Ki = influx constant calculated from individual rate constants shown in Figure 2 (see Eq. 3); BV = blood volume expressed as percentage of ROI volume.
- FIGURE 7.
Patlak graphical analysis of 18F-FHBG pulmonary kinetics in rat whose compartmental modeling fits are presented in Figure 6A. Animal was infected with Ad-CMV-mNLS-HSV1sr39tk-egfp. •, Early experimental data points on which assumption of curve linearity assumed by model is not satisfied. ○, Experimental data points on which linear regression analysis was performed. Slope (Ki), intercept, and coefficient of determination (R2) of straight line fit are displayed. Ki = Patlak influx constant.
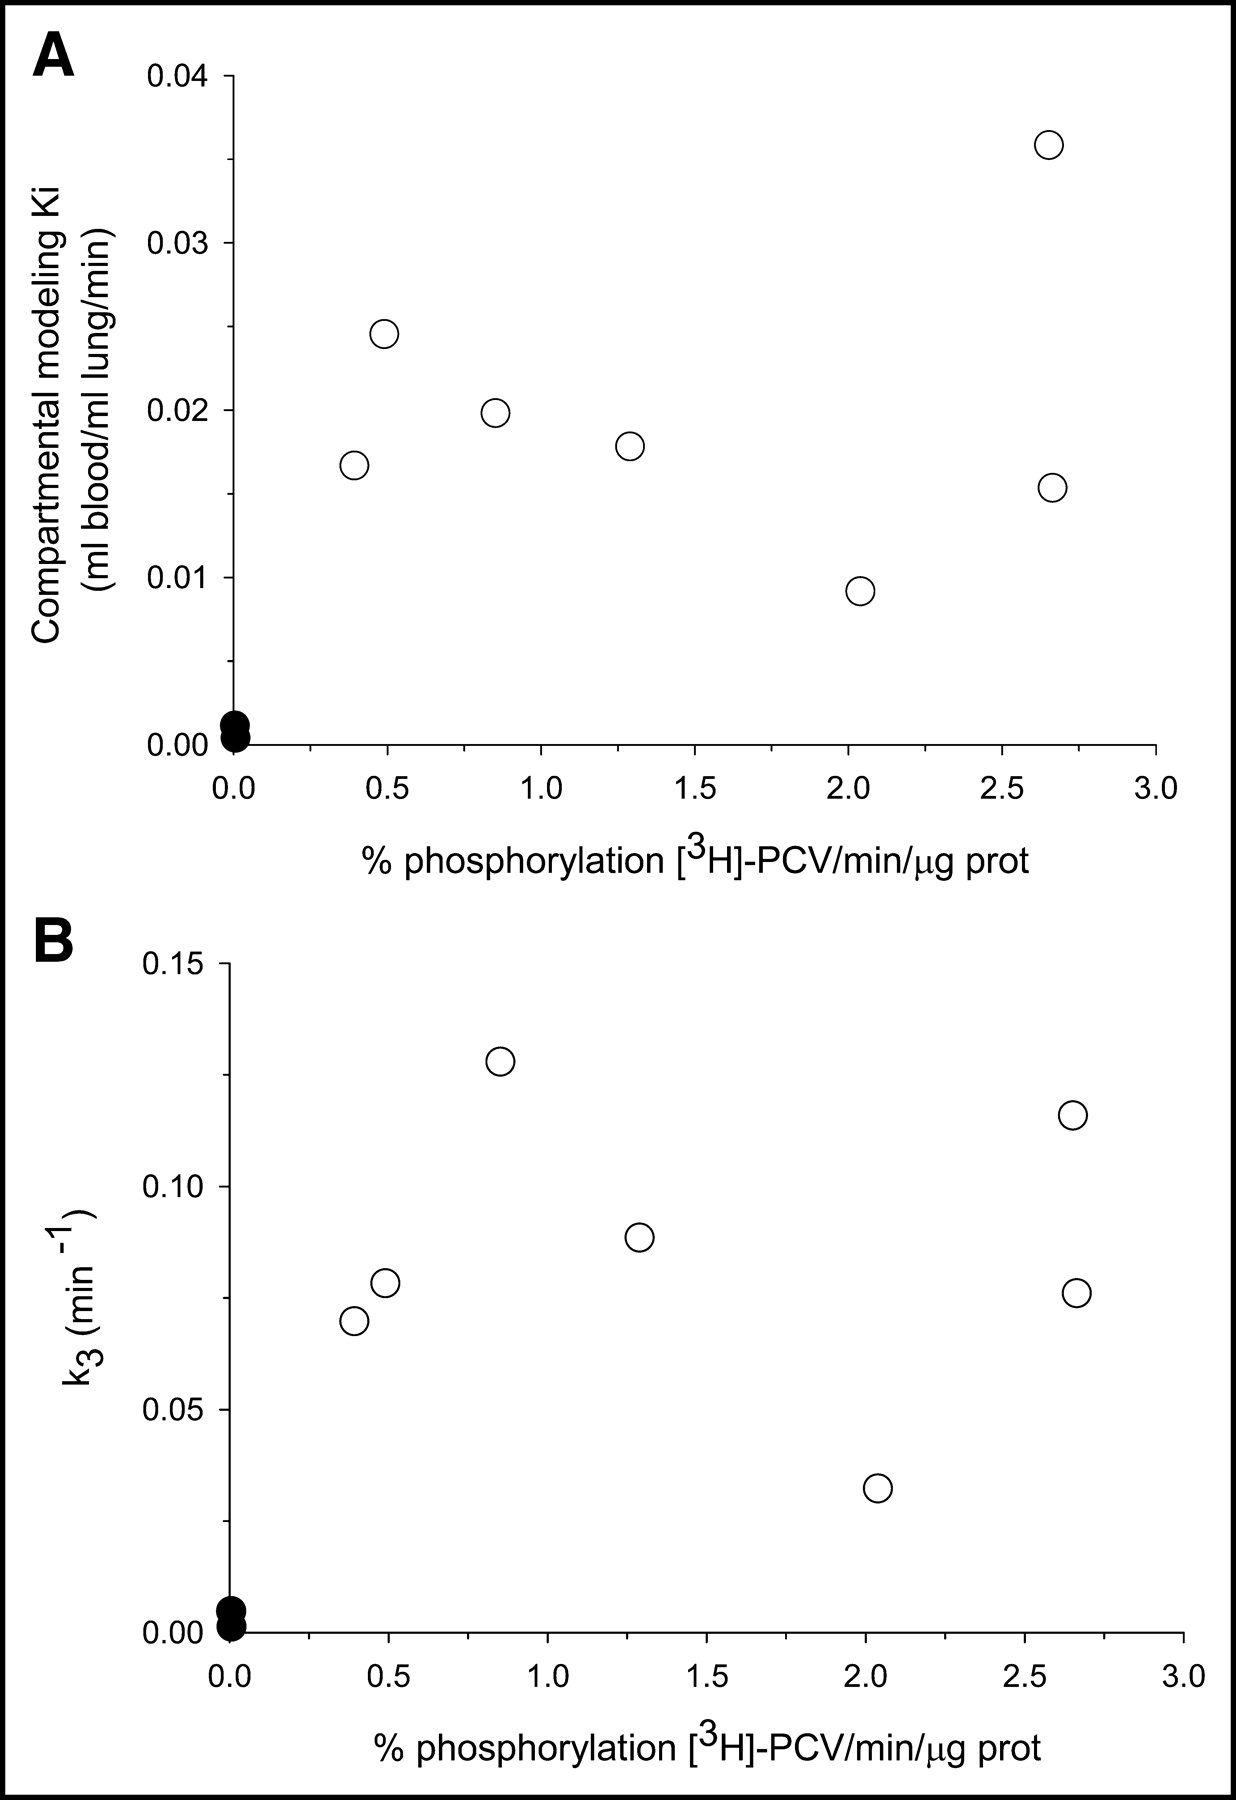
- FIGURE 8.
Relationships between mHSV1-TK enzyme activity assessed in vitro and compartmental modeling results (using 3-compartment model shown in Fig. 2). ○, Data points obtained in each individual rat infected with Ad-CMV-mNLS-HSV1sr39tk-egfp (n = 7). •, Data points obtained in 2 animals infected with control virus (n = 2). Ki (influx constant) represents net uptake of tracer into irreversibly bound compartment. K1 and k3 are individual rate constants shown in Figure 2. PCV = penciclovir.
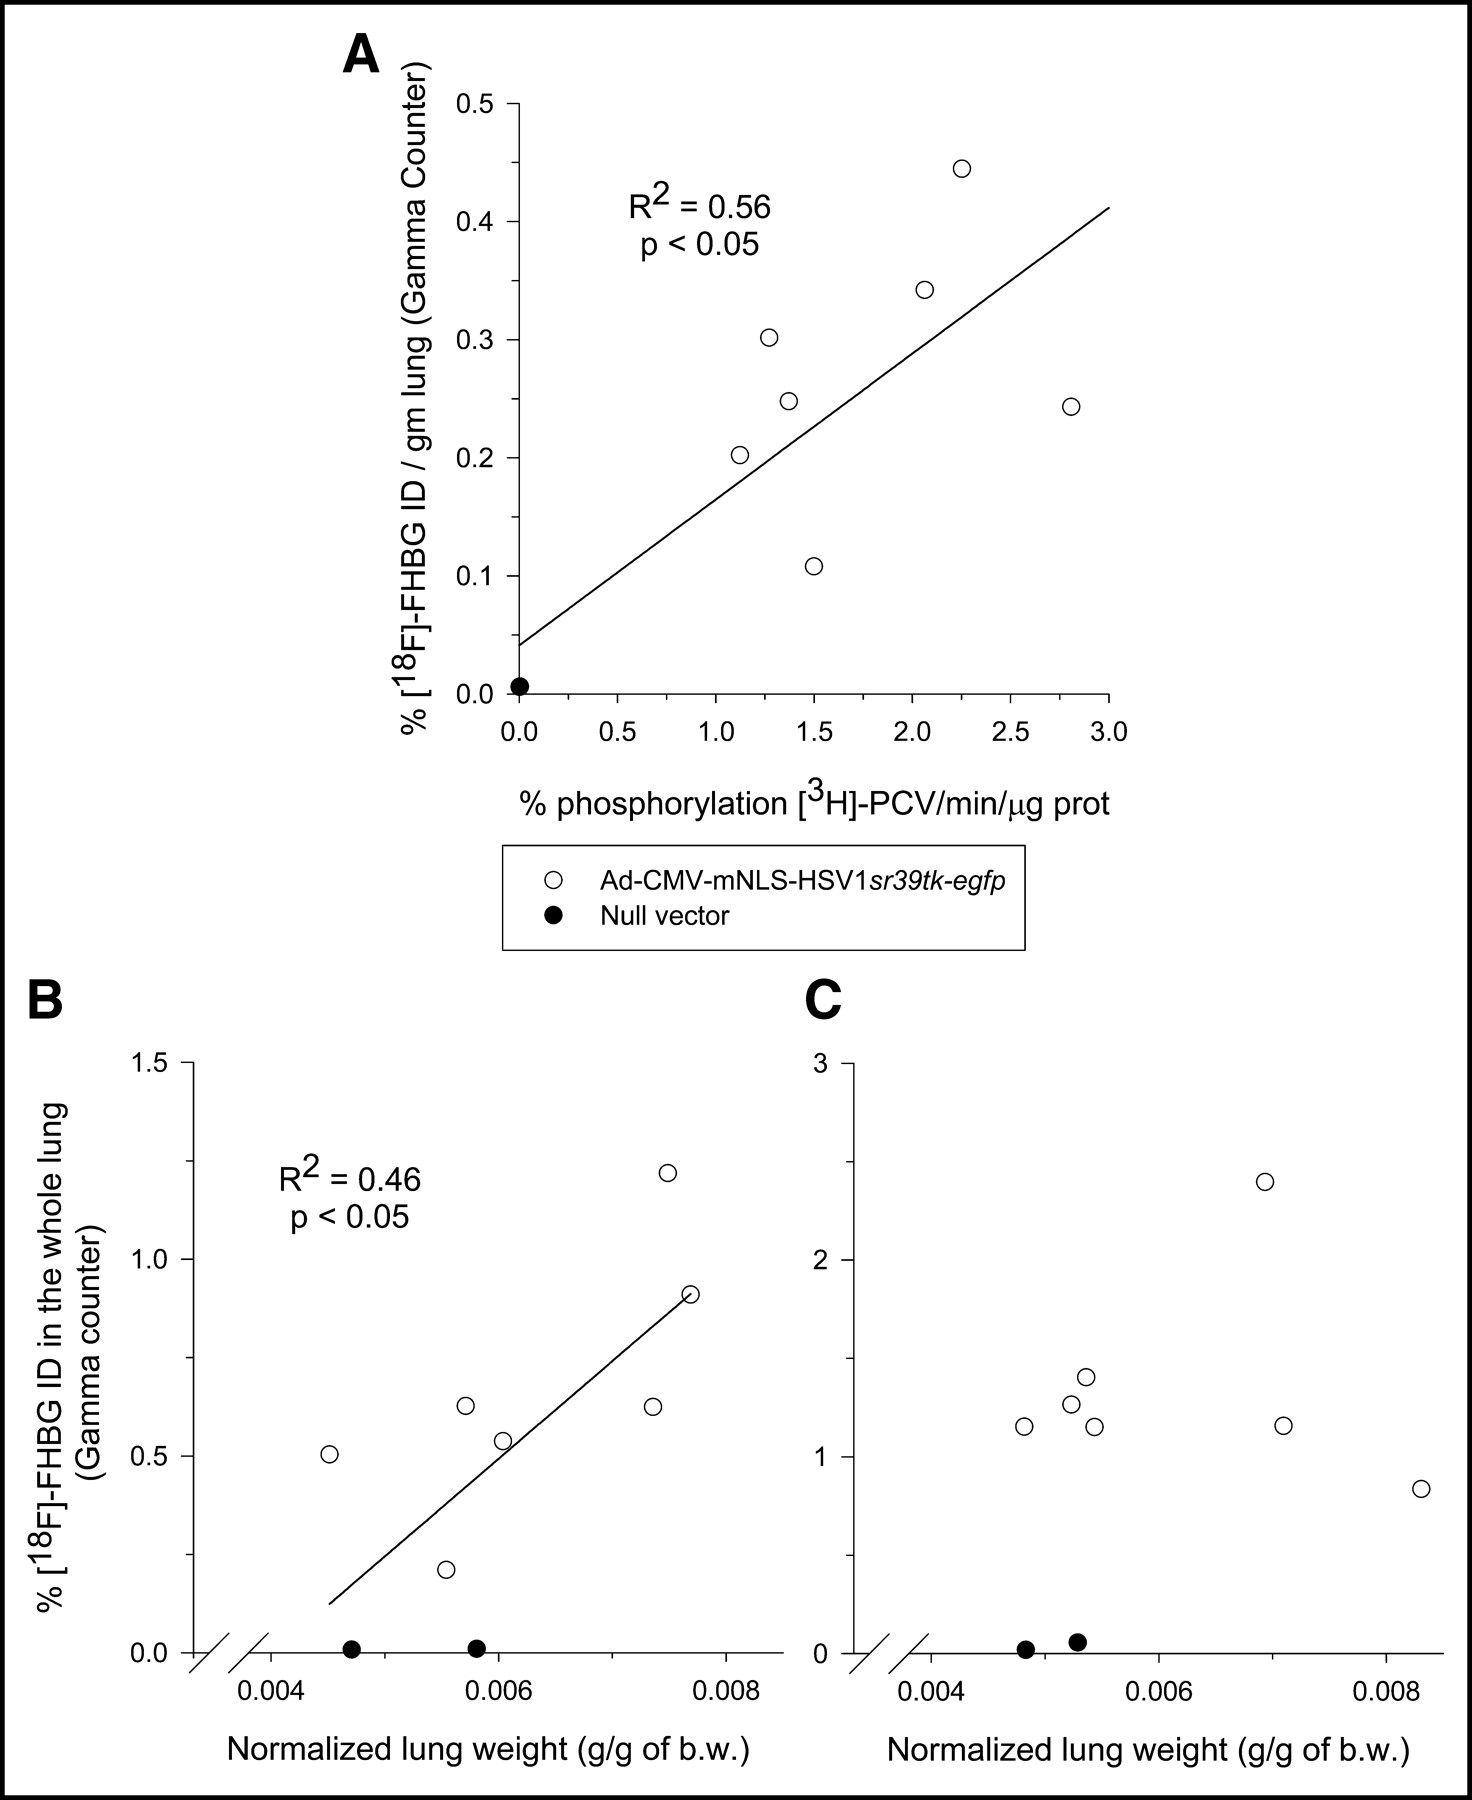
- FIGURE 9.
Quantitation of reporter gene expression during permeability edema. (A) Relationship between lung uptake of 18F-FHBG and mHSV1-TK enzyme activity in 9 rats with ANTU-induced increase in pulmonary vascular permeability. (B and C) Relationship between total lung uptake (expressed as %ID in whole lung) and normalized lung weight in 9 rats with ANTU-induced increases in pulmonary vascular permeability (B) and in 9 normal rats (C). ○, Data points obtained in rats infected with Ad-CMV-mNLS-HSV1sr39tk-egfp. •, Data points obtained in animals infected with control virus. Regression line is displayed when significant linear correlation was obtained. PCV = penciclovir; b.w. = body weight.
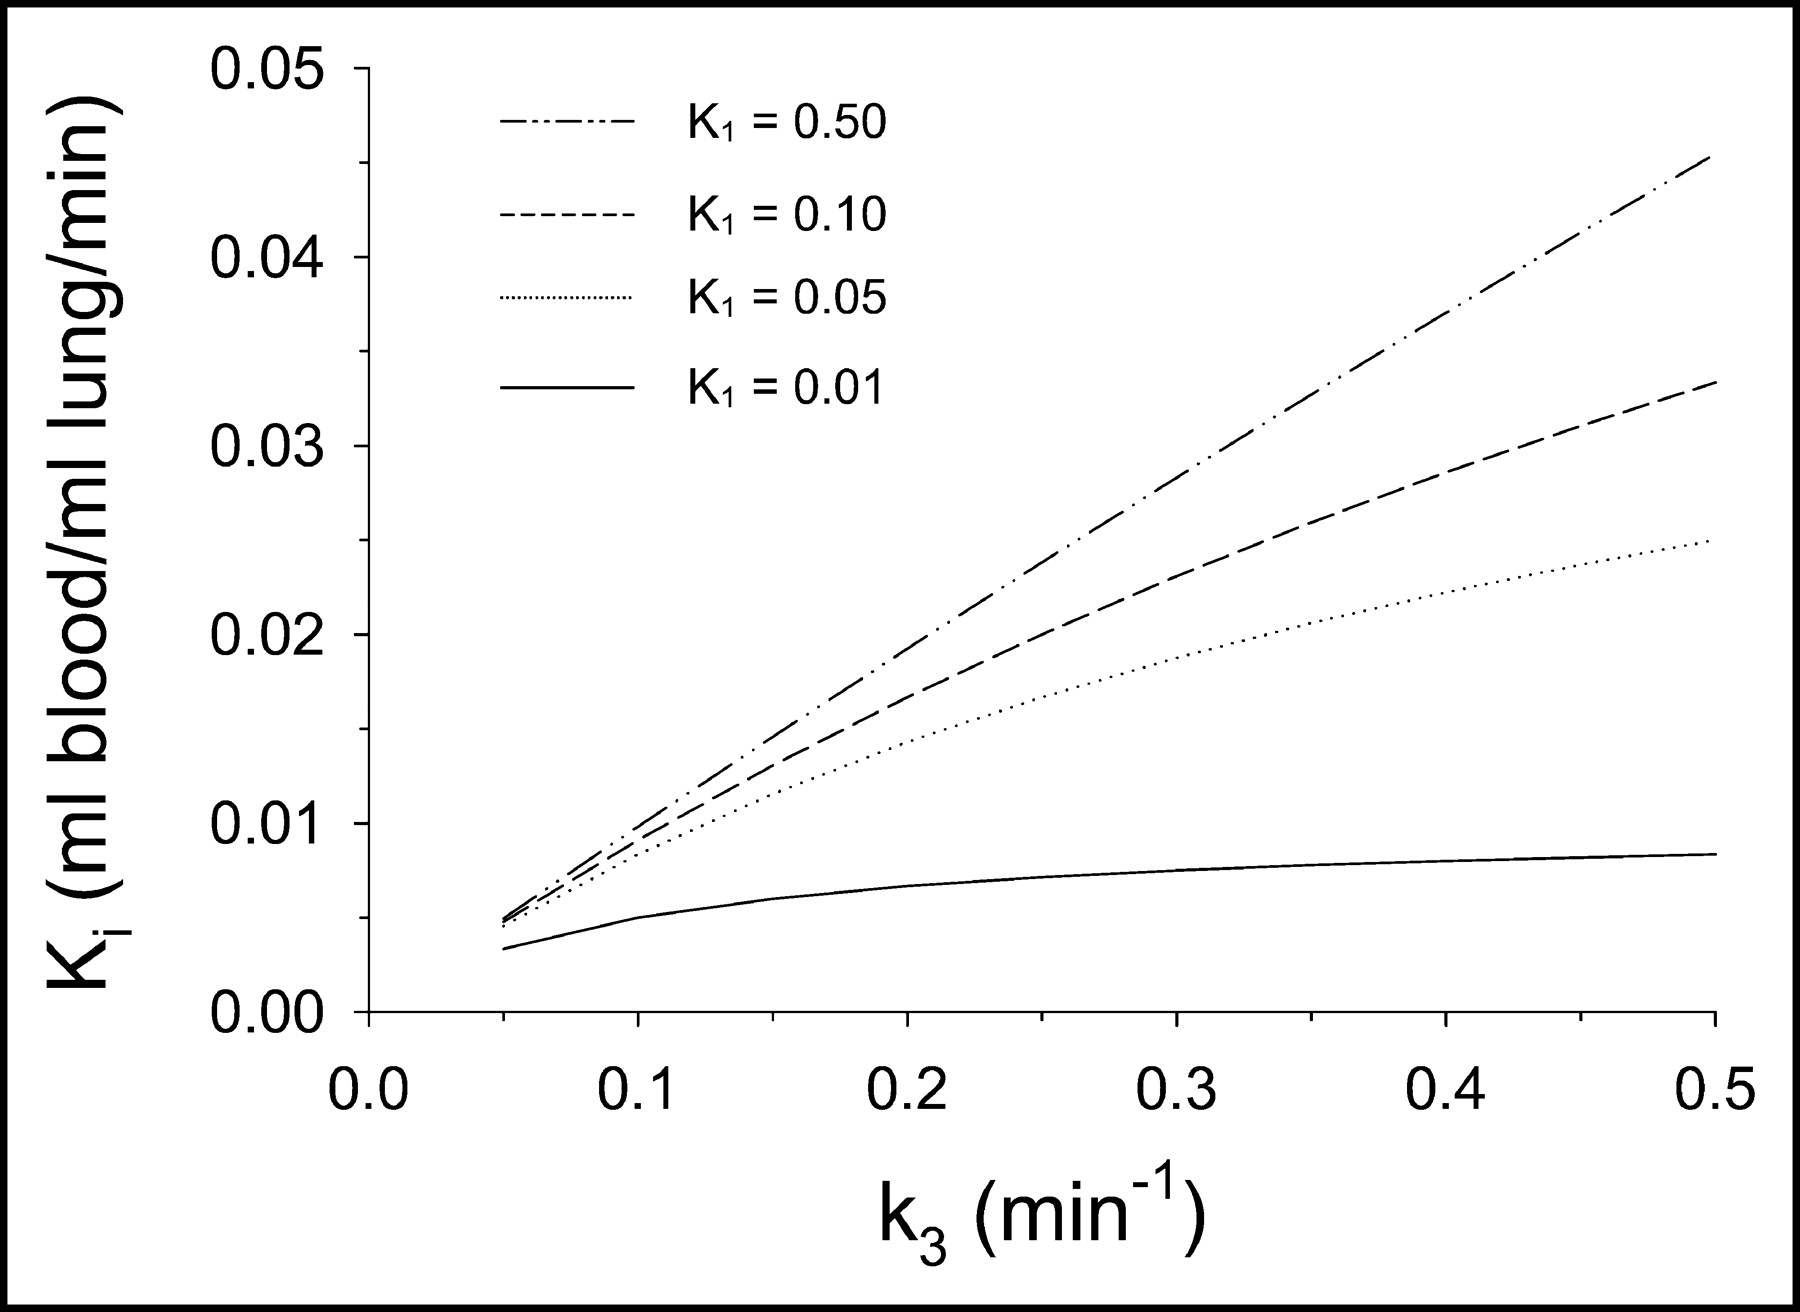
- FIGURE 10.
Simulation of effect of increasing K1 on relationship between Ki and k3 when ratio of K1/k2 is kept constant, based on model shown in Figure 2.
- FIGURE 11.
Revised (4-compartment) model of 18F-FHBG kinetics within lungs. For definition of rate constants, see Figure 2.


Tables
In this issue


Jump to section
Related Articles
Cited By...
- No citing articles found.