


Article Figures & Data
Figures
- FIGURE 1.
Bilateral changes in rCBF and V0 in cortical territories of MCA before and after ACZ administration. Increase in rCBF and V0 for all patients was significant when before-ACZ administration was compared with after-ACZ administration, although 4 of 16 patients showed reduction in rCBF in ipsilateral hemisphere. V0 in all 4 patients increased on same side of hemisphere. Changes in patients of group A (•) are represented by dashed lines, and solid lines show changes in group B (×).
- FIGURE 2.
Representative images of patients with occlusion of right ICA in group A: patient with normal OEF values in bilateral hemispheres (A) and patient with significantly greater OEF in ipsilateral hemisphere (B). Interhemispheric difference in rCBF was intensified and absolute rCBF values decreased on ipsilateral side, although V0 was slightly increased in same region. Corresponding OEF images show asymmetric increase in ipsilateral hemisphere in both patients. Same color scale is used for same parametric images.
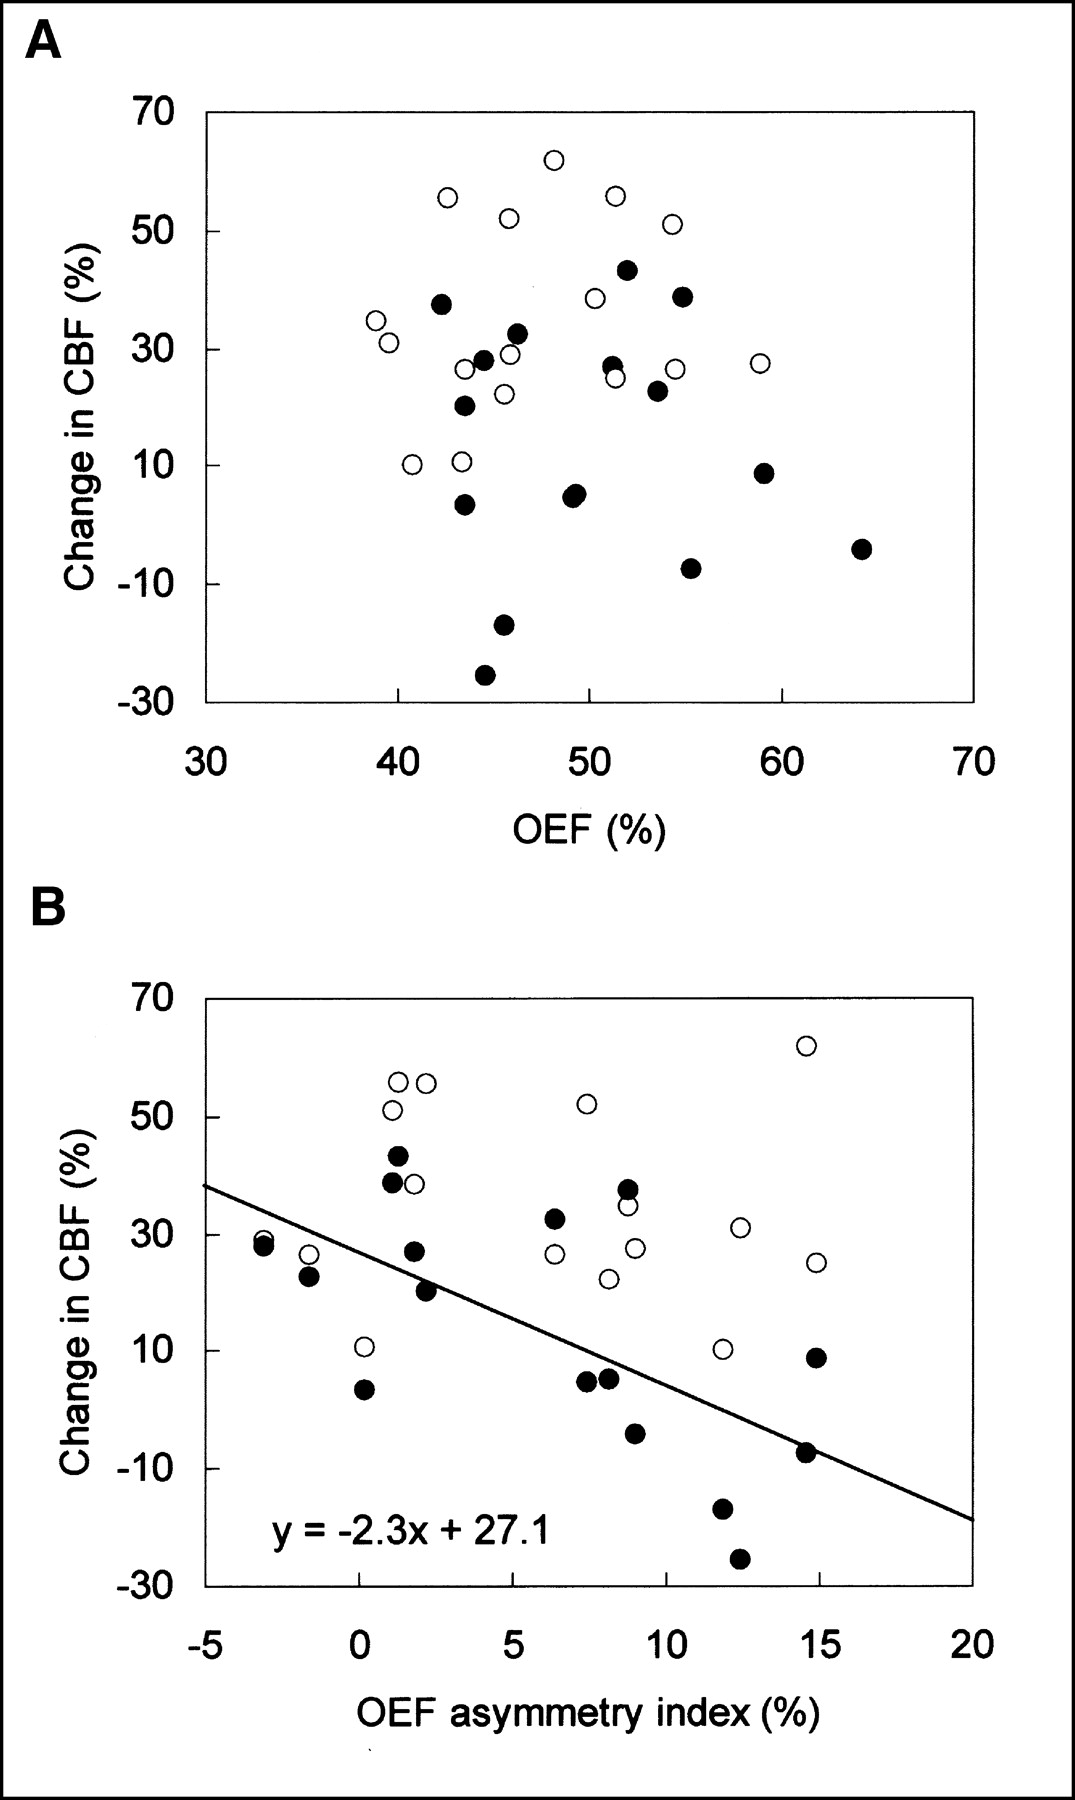
- FIGURE 3.
Relationship between OEF and percentage change in rCBF induced by ACZ administration. (A) Absolute OEF values and percentage change in rCBF showed no relationship in either ipsilateral (•) or contralateral (○) hemisphere. (B) Asymmetry index for OEF was linearly correlated only in ipsilateral hemisphere. Line is regression line for correlation in ipsilateral hemisphere (r = 0.64; P < 0.05).


Tables
Patient no.* Age (y) Sex Clinical history Vascular findings† Collateral circulation‡ Time after onset§ 1 65 M Stroke Left ICA occlusion P com 1.5 y 2 69 M TIA Left ICA occlusion A com 5 mo 3 72 F TIA Left MCA and ICA stenosis‖ (—) 3 mo 4 59 F TIA Right MCA stenosis (—) 1.3 y 5 69 M Stroke Left ICA stenosis P com 2 wk 6 54 M Stroke Right ICA stenosis A com 1 y 7 66 M TIA Right ICA occlusion A com 1.5 mo 8 57 F Retinopathy Right ICA occlusion A com 4 mo 9 69 M Stroke Right ICA occlusion P com, Oph >3 y 10 71 M Stroke Right ICA occlusion A com, P com, Oph 1 y 11 51 F Stroke Left MCA stenosis (—) 6.5 y 12 56 M Stroke Left ICA occlusion A com 2.5 mo 13 66 M Stroke Left MCA occlusion P com, ECA 2 wk 14 69 M Stroke Right ICA occlusion ECA 6 y 15 74 M Stroke Left ICA occlusion A com, P com 1 mo 16 74 M Stroke Right ICA stenosis (—) 6.5 mo -
↵* Group A = patients 1–8; group B = patients 9–16.
-
↵ † Findings observed in conventional angiography and MR angiography.
-
↵ ‡ Collateral arteries are listed for patients with major arterial occlusion.
-
↵ § Interval between neurologic onset and PET study.
-
↵ ‖ Severe stenosis in middle cerebral artery with mild stenosis in internal carotid artery.
-
A com = anterior communicating artery; P com = posterior communicating artery; Oph = ophthalmic artery; ECA = external carotid artery.
-
Parameter Patients with cerebrovascular disease (n = 16) Healthy volunteers (n = 8) Ipsilateral Contralateral 16 hemispheres CBF (mL/min/100 g) Baseline 36.1 ± 8.1*,† 41.7 ± 7.6 42.0 ± 5.0 ACZ 40.9 ± 10.4*,‡,§ 55.6 ± 8.4‖ 57.7 ± 6.7‖ % Change 13.6 ± 20.7§,¶ 34.8 ± 16.0 37.5 ± 13.5 V0 (mL/100 g) Baseline 1.63 ± 0.47*,† 1.94 ± 0.43 1.92 ± 0.21 ACZ 2.15 ± 0.61*,†,‖ 3.01 ± 0.74‖ 3.09 ± 0.51‖ % Change 34.5 ± 25.9*,§ 55.7 ± 25.6 60.7 ± 19.8 CMRo2 (mL/min/100 g) 2.76 ± 0.39¶ 3.03 ± 0.37 — OEF (%) 49.9 ± 6.3¶ 47.2 ± 5.8 — CBV (mL/100 g) 4.37 ± 0.41§,¶ 4.03 ± 0.47 3.75 ± 0.59 -
↵* P < 0.001 comparing right and left hemispheres (repeated-measures ANOVA with paired t test).
-
↵ † P < 0.05 comparing hemispheres of patients and healthy volunteers (1-way ANOVA with post hoc Fisher protected least significant difference).
-
↵ ‡ P < 0.05 comparing before and after ACZ administration (repeated-measures ANOVA with paired t test).
-
↵ § P < 0.001 comparing hemispheres of patients and healthy volunteers (1-way ANOVA with post hoc Fisher protected least significant difference).
-
↵ ‖ P < 0.001 comparing before and after ACZ administration (repeated-measures ANOVA with paired t test).
-
↵ ¶ P < 0.005 comparing right and left hemispheres (repeated-measures ANOVA with paired t test).
-
- TABLE 3
Comparison of CBF, V0, and Other Parametric Values (Mean ± SD) in the 2 Patient Groups
Parameter Group A (n = 8) Group B (n = 8) Ipsilateral Contralateral Ipsilateral Contralateral CBF (mL/min/100 g) Baseline 36.4 ± 10.9* 43.0 ± 8.7 35.9 ± 4.7† 40.5 ± 6.7 ACZ 34.9 ± 11.1* 55.0 ± 8.9‡ 46.9 ± 4.9*,‡ 56.2 ± 8.5‡ % Change −4.1 ± 12.0* 29.9 ± 18.3 32.2 ± 8.2 39.6 ± 12.7 V0 (mL/100 g) Baseline 1.56 ± 0.42† 1.85 ± 0.46 1.70 ± 0.53* 2.04 ± 0.40 ACZ 1.90 ± 0.41†,§ 2.90 ± 0.97‡ 2.40 ± 0.70*,‡ 3.12 ± 0.45‡ % Change 25.0 ± 25.3* 55.6 ± 30.2 44.0 ± 24.2† 55.8 ± 22.1 CMRo2 (mL/min/100 g) 2.70 ± 0.48 2.92 ± 0.32 2.82 ± 0.29* 3.15 ± 0.39 OEF (%) 51.3 ± 7.5* 46.7 ± 6.2 48.5 ± 4.9 47.7 ± 5.8 CBV (mL/100 g) 4.65 ± 0.31† 4.17 ± 0.57 4.09 ± 0.29 3.88 ± 0.32 -
↵* P < 0.01 comparing right and left hemispheres (repeated-measures ANOVA with paired t test).
-
↵ † P < 0.05 comparing right and left hemispheres (repeated-measures ANOVA with paired t test).
-
↵ ‡ P < 0.005 comparing the 2 conditions of baseline and ACZ injection (repeated-measures ANOVA with paired t test).
-
↵ § P < 0.05 comparing the 2 conditions of baseline and ACZ injection (repeated-measures ANOVA with paired t test).
-
In this issue


Jump to section
Related Articles
Cited By...
- The Acetazolamide Challenge: Techniques and Applications in the Evaluation of Chronic Cerebral Ischemia
- Combination of a Mean Transit Time Measurement with an Acetazolamide Test Increases Predictive Power to Identify Elevated Oxygen Extraction Fraction in Occlusive Carotid Artery Diseases
- Mapping Cerebrovascular Reactivity Using Blood Oxygen Level-Dependent MRI in Patients With Arterial Steno-occlusive Disease: Comparison With Arterial Spin Labeling MRI
- Reduced Blood Flow and Preserved Vasoreactivity Characterize Oxygen Hypometabolism Due to Incomplete Infarction in Occlusive Carotid Artery Diseases