


Abstract
Gaucher’s disease is a lysosomal storage disorder due to a genetically transmitted deficiency of the enzyme glucocerebrosidase. In the most common form of the disease (type 1), accumulation of glucosylceramide in the reticuloendothelial cells of liver, spleen, and bone marrow leads to visceromegaly, anemia, thrombocytopenia, and osteopenia. Skeletal manifestations secondary to infiltration of the bone marrow by Gaucher’s cells are detectable by radiography only in advanced stages. Imaging of bone marrow involvement can be performed indirectly by magnetic resonance techniques or by bone marrow scintigraphy with radiocolloids. However, both procedures lack specificity because the normal bone marrow, rather than the pathologic process, is imaged. The aim of this study was to assess the reliability of 99mTc-sestamibi scintigraphy for direct evaluation of bone marrow involvement. Methods: Seventy-two patients with type 1 and 2 patients with type 3 Gaucher’s disease (35 males, 39 females) were enrolled in the study. The mean age ± SD was 31.9 ± 16.5 y (range, 3–76 y), and the average duration of the disease manifestations when performing scintigraphy was 12.95 y (median, 10.5 y; range, 0–44 y). Forty-three of 74 patients had never received enzyme replacement therapy (ERT), whereas 31 patients were already being treated with ERT. 99mTc-Sestamibi was injected intravenously (6–8 MBq/kg of body weight) and imaging was recorded at the lower limbs 30 min after injection, at the plateau of tracer accumulation in the involved bone marrow. The scans were evaluated visually, assigning a semiquantitative score based on the extension and intensity of uptake in the bone marrow of the lower limbs (0 = no uptake; 8 = maximum uptake). The scintigraphic score was entered into complex statistical analysis, which included a series of clinical and blood chemistry parameters defining overall severity of the disease. Results: 99mTc-Sestamibi scintigraphy showed that 71 of 74 patients had some degree of bone marrow involvement. The scintigraphic score was highly correlated with an overall clinical severity score index (SSI) and with various parameters contributing to the SSI, either positively or negatively. The highest correlation of the scintigraphic score was found with an overall biochemical marker of disease severity (serum chitotriosidase). ERT-naive patients showed high correlation of the scintigraphic score with the clinical SSI, with a radiographically based score, and with serum chitotriosidase. In the ERT-treated patients, the scintigraphic score was correlated with the clinical SSI, with hepatomegaly, and with hemoglobin. Conclusion: 99mTc-Sestamibi uptake reliably identifies bone marrow infiltration by Gaucher’s cells. The scintigraphic score is helpful for defining the severity of bone marrow involvement and for comparing patients. 99mTc-Sestamibi scintigraphy, which provides topographic information about the sites involved by the disease, is highly correlated with other parameters of disease severity and appears to correlate with response to ERT.
Gaucher’s disease, the most frequent lysosomal storage disorder, is quite uncommon in the general population, affecting 1 of approximately every 40,000–80,000 newborns, with the exception of Ashkenazi Jews, in whom its incidence can be up to 100-fold higher.
The condition is a chronic multisystem disorder with wide variability in clinical manifestations and course. It is due to deficiency of glucocerebrosidase, which hydrolyzes glucosylceramide to glucose and ceramide (1). As a result of this deficiency, glucosylceramide accumulates in the lysosomes of reticuloendothelial cells to produce the characteristic Gaucher’s cells. Reduced glucocerebroside activity is the necessary condition for Gaucher’s disease; however, development and progression of clinical manifestations are multifactorial (2). Therefore, enzymatic activity alone is not a reliable index of the severity of the disease. Accumulation of glucosylceramide in splenic macrophages and in the Kupffer cells of the liver is associated with enlargement of these organs; the resulting hypersplenism produces progressive anemia and thrombocytopenia. Accumulation of glucosylceramide in the bone marrow is associated with osteopenia and lytic lesions, pathologic fractures, chronic bone pain, acute episodes of excruciating pain (the so-called bone crisis), bone infarcts, and osteonecrosis.
Although anemia and thrombocytopenia may be severe, it is frequently bone disease that results in the greatest morbidity and long-term disability. All 3 variants of Gaucher’s disease (type 1, the most common, with a chronic, nonneuronopathic course; type 2, a rare variant causing severe early-onset neurologic manifestations, usually fatal within 3 y of age; and type 3, a subacute, juvenile-onset slowly progressing neurodegenerative form) have bone disease in common. Type 2 patients, however, rarely survive long enough to suffer from the severe skeletal manifestations.
Skeletal manifestations occur in >80% of the patients, with serious complications in about half of those affected. Early assessment and routine monitoring of skeletal involvement, even if asymptomatic, are therefore crucial because bone changes are progressive if proper treatment is not established. Enzyme replacement therapy (ERT) is rapidly effective in reversing some of the clinical manifestations of Gaucher’s disease (anemia, thrombocytopenia, and, more slowly, hepatosplenomegaly) (3), whereas skeletal responses to ERT are much slower (4,5). Skeletal responses can be limited when administration of ERT is delayed beyond a certain point of irreversible changes.
Although skeletal changes caused by extensive infiltration of the bone marrow by Gaucher’s cells can be detected on plain radiography when they produce characteristic abnormalities, direct visualization of the bone marrow involvement has remained more problematic. In particular, magnetic resonance imaging (MRI) identifies a loss of the signal on the T1-weighted images due to reduction of the normal fat fraction of the adult bone marrow caused by infiltration of Gaucher’s cells (6–9). Scintigraphy with radiolabeled colloids has been described as a means of assessing reticuloendothelial function of the normal bone marrow. Patients with Gaucher’s disease exhibit reduced visualization of the bone marrow (10). Both methods suffer from drawbacks, mainly because they are based on indirect evaluation and thus lack specificity (11,12); in fact, the normal bone marrow, rather than the pathologic process, is imaged. Furthermore, in children the conversion of hematopoietic to fatty bone marrow complicates interpretation of the MRI evaluation, and the equipment required for more sophisticated evaluations is only available in specialized research centers (7,13,14).
Direct visualization of the bone marrow infiltrated by Gaucher’s cells has been achieved by administering the lipid-soluble radioactive gas 133Xe (15). However, the use of an airtight face mask poses some limitations, especially in children. Images have very low geometric resolution; washout of the gaseous tracer accumulated in Gaucher’s deposits is very fast; quantitation of the data is not satisfactory, and, finally, 133Xe is not widely available.
99mTc-Sestamibi is a lipophilic cationic agent originally introduced in nuclear medicine for myocardial perfusion scintigraphy (16). This compound enters into cells under an ionic gradient and is then actively accumulated in the mitochondria where it is retained in response to the electrical potential generated across the membrane bilayer (17). This pattern of distribution has prompted investigations on the use of 99mTc-sestamibi for clinical applications other that myocardial perfusion scintigraphy (18,19), and this agent is also now routinely used for imaging parathyroid tumors and breast cancer (20–22). Scintigraphy with 99mTc-sestamibi has also been used to image neoplastic involvement of the bone marrow by multiple myeloma or other malignancies (23–26).
We have previously reported successful imaging of bone marrow involvement by Gaucher’s deposits with 99mTc-sestamibi in an adult patient with late-onset type 1 disease (27). This study, impelled by that initial observation and by subsequent independent reports (28,29), involved a relatively large number of patients to evaluate the reliability of 99mTc-sestamibi scintigraphy to assess the severity of bone marrow involvement. This parameter is especially important to monitor the efficacy of ERT, which is still an elusive problem with current imaging techniques (30).
MATERIALS AND METHODS
Patients
Between 1994 and 2002, 74 patients were enrolled for this study. The protocol was approved by the Ethics Committees of the University of Pisa and of the University of Genoa. Written informed consent was obtained from all patients (or from their guardians in the case of minors).
Seventy-two patients were Italian: 12 from Northern Italy, 33 from Central Italy, and 27 from Southern Italy or Sardinia and Sicily. They represent about 50% of the entire population of Gaucher’s patients recorded by the Italian Registry for Gaucher Disease. One patient was from Argentina and 1 was from Croatia. They were referred for scintigraphic study of their skeletal manifestations primarily by the Italian Association of Gaucher Disease.
The diagnosis of Gaucher’s disease was made on the basis of enzymatic assay in all patients, by demonstration of reduced glucocerebrosidase activity in peripheral white blood cells or in cell lines (fibroblasts or lymphoblasts). Glucocerebrosidase activity was analyzed using 4-methylumbelliferyl-β-glucopyranoside as the substrate in the presence of sodium deoxytaurocholate.
There were 35 male and 39 female patients with a mean age ± SD of 31.9 ± 16.5 y (median, 31.5 y; range, 3–76 y). Seventy-two patients were classified as type 1, and 2 patients were classified as type 3 according to clinical parameters, including age at onset of visceromegaly, bone disease, neurologic signs, and survival. The average age of the patients when Gaucher’s disease was diagnosed was 18.95 y (median, 13.5 y; range, 1–76 y), and the average duration of the disease manifestations when performing the scintigraphic study was 12.95 y (median, 10.5 y; range, 0–44 y).
None of the patients was of Jewish descent. Analysis of the glucocerebrosidase gene and mutation profile of 69 of 74 patients was determined as described (31). Only 4 of the total 138 alleles were not identified. There were only 5 patients with a homozygous mutation of the glucocerebrosidase gene: L444P and F213I (both type 3 patients), N370S (in 2 classic type 1 disease), and D409H (in a type 1 patient without any sign of cardiac involvement). The most common mutation was N370S (a total of 62 alleles) followed by L444P (32 alleles), whereas more rare variants included mutations R120W, F213I, IV S2G>A, R285H, R131C, D409H, recNCI (3 alleles each), Complex I, V214H, H451R, G202R, Y313H (2 alleles each), and, finally, P159T, 2023insA, I119S, δ-55, W312S, R170P, and gene deletion (1 allele each).
All patients had complete clinical, biochemical, and conventional imaging evaluation (radiography and ultrasound), with additional MRI in some patients, which allowed staging of them by the combined severity score index (SSI) described by Zimran et al. (32). The average SSI value in the entire patient population was 9.12 (median, 8; range, 1–26). Serum chitrotriosidase levels (33) were available for statistical evaluation in 38 of 74 patients, as the assay was implemented in 1997, whereas in 13 cases such data were excluded from analysis because of mutation of the gene for chitotriosidase (homozygous in 1 case, heterozygous in 12 cases) (34). Twenty-five of the 74 patients had been splenectomized before they entered the scintigraphic study. When scintigraphic evaluation with 99mTc-sestamibi was performed, 43 of 74 patients had never received ERT, whereas 31 patients were already being treated with ERT (initially Ceredase, changed in 1997–1998 to Cerezyme; Genzyme Corp.). The mean ERT dose was 36.7 ± 17.8 U/kg of body weight every 2 wk (median, 33 U/kg; range, 10–85 U/kg per month), whereas the mean duration of ERT treatment was 49.1 ± 27.1 mo (median, 52 mo; range, 7–96 mo).
The only significant difference between the ERT-naive and the ERT-treated patients concerned the duration of disease (mean ± SD: 9.67 ± 1.78 y vs. 17.48 ± 1.98 y; Pearson χ2 = 14.56, P = 0.002), serum chitotriosidase levels (16,794 ± 2,909 nmol/mL/h vs. 7,238 ± 2,272 nmol/mL/h; χ2 = 12, P = 0.007), and hemoglobin content (12.38 ± 0.25 g/dL vs. 13.43 ± 0.31 g/dL; χ2 = 10.71, P = 0.013), whereas statistical significance was borderline for age at diagnosis (23.02 ± 2.88 y vs. 13.29 ± 1.97 y; χ2 = 7.41, P = 0.06). In the ERT-naive patients, platelet counts were markedly higher in splenectomized patients (236,875 ± 25,790 platelets [plt]/μL) versus nonsplenectomized patients (101,407 ± 8,159 plt/μL; χ2 = 25.14, P ≪ 0.001), whereas there was no statistical difference in the splenectomized patients (235,556 ± 32,372 plt/μL) versus nonsplenectomized patients receiving ERT (148,909 ± 13,618 plt/μL). The wide ranges in the ERT-naive and ERT-treated patients resulted in a nonsignificant difference between the 2 groups globally considered (151,814 ± 14,709 plt/μL vs. 174,065 ± 14,994 plt/μL). On the other hand, ERT-naive, nonsplenectomized patients had platelet counts significantly lower than nonsplenectomized patients receiving ERT (χ2 = 10.81, P = 0.013), whereas there was no statistical difference in the splenectomized ERT-naive patients versus splenectomized patients receiving ERT.
Scintigraphy Protocol
99mTc-Sestamibi (Cardiolite; Bristol-Meyers-Squibb) was prepared according to the manufacturer’s instructions, with a consistent radiochemical yield of >98%. After the patients had rested for at least 30 min, the tracer was injected intravenously as a single bolus at a dose of 6–8 MBq/kg of body weight (about half the dose normally used for a myocardial perfusion scan). Single-head or dual-head large-field-of view gamma cameras equipped with low-energy, high-resolution, parallel-hole collimators were used for scintigraphy, centering a 10% window on the 140-keV photopeak of 99mTc.
In the first 15 patients, dynamic scintigraphy was recorded starting on bolus injection of 99mTc-sestamibi, with the head of the gamma camera positioned over the lower limbs of the patients, using a 64 × 64 matrix and 1 frame per minute for 30 min. Static images were then recorded on the lower limbs (256 × 256 matrix; acquisition time, 600 s), over the abdomen, and over the chest and shoulders.
Focal uptake of radioactivity in the bone marrow in the scans, normally not observed after administration of 99mTc-sestamibi, was considered as an indication of infiltration by Gaucher’s cells. On the basis of the scintigraphic pattern observed in the initial studies, a combined semiquantitative score of bone marrow involvement was developed, modifying an index previously described for patients with bone marrow infiltration by multiple myeloma (35).
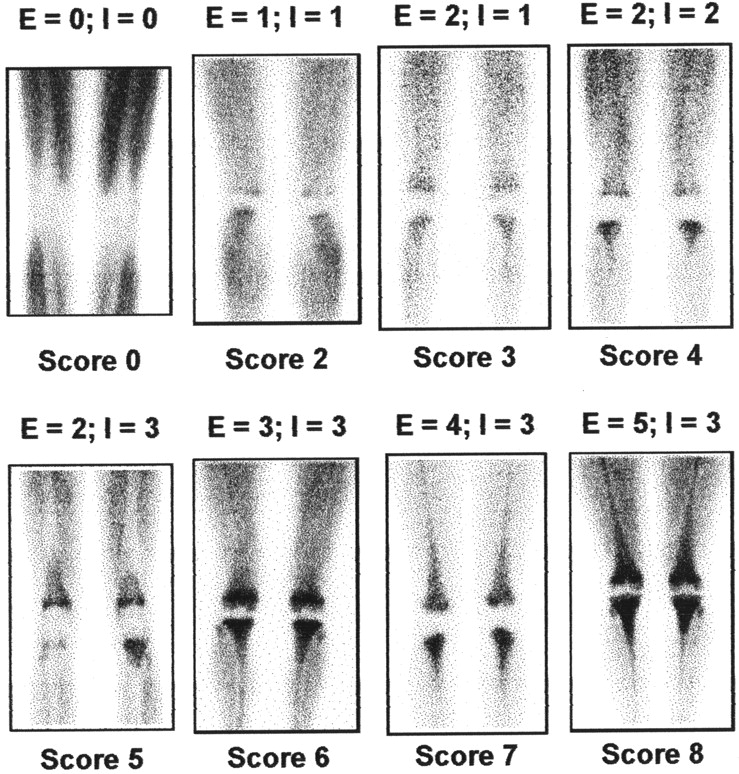
The main determinant in such semiquantitative score is involvement of the knee area, which is the distal epiphysis of the femur and the proximal epiphysis of the tibia, progressively extending proximally in the femur and distally in the tibia. Attention was centered on the knees because this area is the most frequent, early site of one of the typical skeletal changes observed in Gaucher’s disease. An “Erlenmeyer flask” deformity of the distal femur and proximal tibia is present in >80% of the patients on presentation, even in the asymptomatic stage (36). Furthermore, scintigraphic evaluation of the knees with 99mTc-sestamibi is especially favorable, because imaging of this area is not affected by physiologic hepatobiliary and renal excretion of radioactivity, which hampers visualization of bone marrow involvement in the proximal femurs, pelvic bones, and spine. Complications due to bone marrow infiltration by Gaucher’s cells at these latter sites are less frequent, with avascular necrosis of the hip occurring in 9%–26% and vertebral collapse occurring in 5.5%–12% of the patients. The scintigraphic score is the sum of separate visual assessments of both the extension and the intensity of uptake, as follows: For extension (E), E0 = no evidence of bone marrow uptake, E1 = uptake at the distal femoral epiphyses, E2 = uptake at the distal femoral and proximal tibial epiphyses, E3 = uptake extending to the femoral diaphyses, E4 = uptake extending also to the tibial diaphyses, and E5 = uptake involving the entire femurs and tibias. For intensity (I), I0 = no evidence of bone marrow uptake, I1 = bone marrow uptake lower than in muscle, I2 = bone marrow uptake of the same intensity as in muscle, and I3 = bone marrow uptake higher than in muscle.
Therefore, the combined score is 0 in the case of nondetectable accumulation of radioactivity in the bone marrow, whereas the least detectable involvement is scored as 2 and the maximum is equal to 8 (Fig. 1).

Examples of 99mTc-sestamibi scans in patients with varying degrees of bone marrow infiltration by Gaucher’s deposits as visualized by scintigraphy. Combined semiquantitative scintigraphic scores are indicated at bottom, whereas scores for extension (E) and intensity (I) of radioactivity uptake in bone marrow are indicated at top of each scan. Physiologic distribution of 99mTc-sestamibi in skeletal muscle was minimized by keeping patients at rest for at least 30 min before injecting tracer.
Statistical Analysis
The statistical approach termed as analysis of the principal components (37) was chosen to evaluate how the variables considered for each patient cluster together, paying particular attention to correlation of the 99mTc-sestamibi scintigraphic score with those variables defining severity of the disease. Analysis was based on 10 main variables for each patient: continuous variables (duration of disease, platelet count, hemoglobin concentration), discrete semiquantitative variables (scintigraphic score, Zimran score, hepatomegaly, bone pain, x-ray score), and binary variables (splenectomy, ERT before scintigraphy). Furthermore, another continuous variable was available for 38 patients (serum chitotriosidase) as well as a discrete variable (splenomegaly) was available for those patients who had not been splenectomized. Finally, for those patients who underwent scintigraphic evaluation with 99mTc-sestamibi after initiating ERT, 3 additional variables were considered: duration of prior ERT, dose of ERT as U/kg of body weight per month, and cumulative dose administered since the beginning of ERT (all continuous variables).
Details on this type of statistical analysis are given in the Appendix.
RESULTS
Scintigraphy with 99mTc-sestamibi revealed some degree of bone marrow involvement in the majority of the patients with Gaucher’s disease enrolled in this study (71/74, or 96% of the entire group). In the patients showing 99mTc-sestamibi uptake in the bone marrow, the predominant scintigraphic pattern (observed in 66/71 patients) was represented by initial involvement of the distal femoral epiphyses in the mildest cases, progressively extending to the proximal tibial epiphyses, then to the diaphyseal portion of femurs and tibias, and, finally, in the more severe cases, to virtually the whole femurs and tibias. Intensity of 99mTc-sestamibi uptake varied from lower to higher than muscle uptake. Occasionally, involvement of the femoral heads and proximal femurs was observed in association with involvement of the distal femurs, without detectable radioactivity accumulation in the femoral diaphysis per se. Five patients with positive 99mTc-sestamibi scintigraphy showed an inverse pattern of bone marrow involvement, starting with the femoral heads in the mildest cases and progressively extending to involve the diaphyseal portion of the femurs. In these 5 patients, the combined scintigraphic score, as described in the Materials and Methods, was assigned by the consensus of 3 readers, adopting criteria of extension and intensity of tracer uptake in analogy with the scintigraphic pattern predominant in the whole group of patients.
Visualization of the bone marrow was in general quite homogeneous at the sites of Gaucher’s deposits, though with progressively decreasing intensity from the site with highest tracer accumulation. However, patients who had had prior episodes of osteonecrosis or fracture showed some inhomogeneity in distribution of radioactivity within the infiltrated bone marrow consisting of photopenic areas corresponding to the sites of the prior skeletal complications.
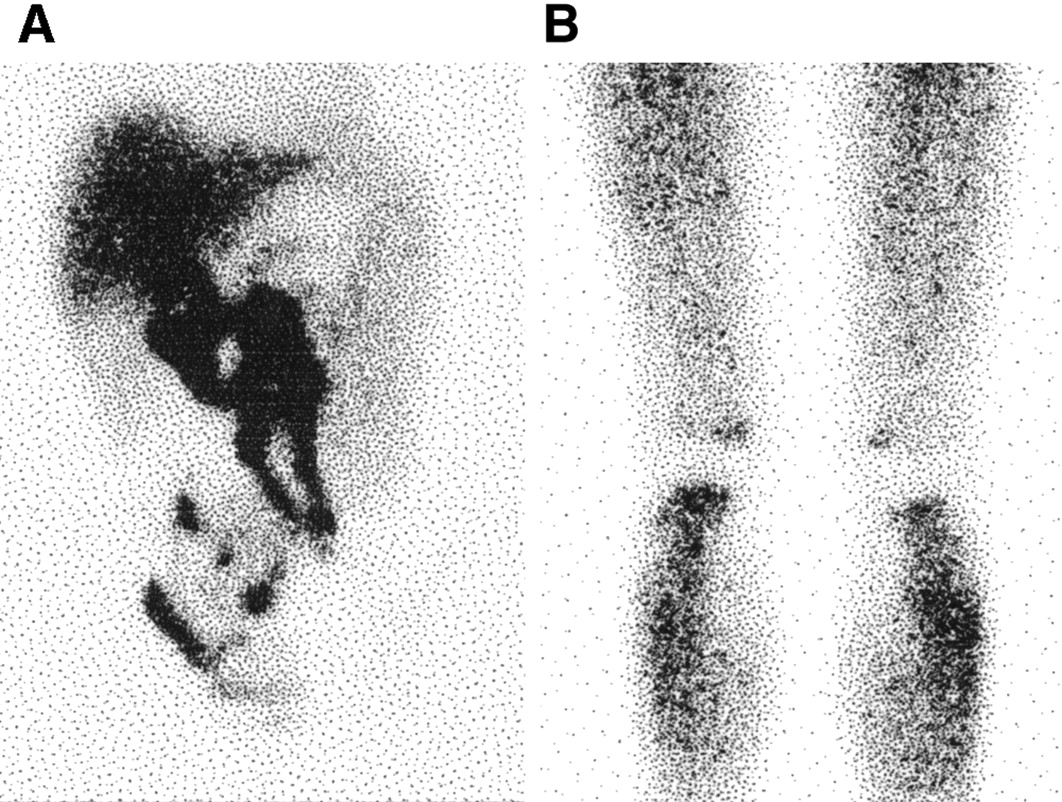
Dynamic recording performed on bolus intravenous injection of 99mTc-sestamibi showed that the tracer started to accumulate within the first few minutes in the infiltrated bone marrow (Fig. 2A). Uptake of 99mTc-sestamibi reached a plateau within 15–20 min after injection of the tracer and remained constant for at least 2 h (Fig. 2B). In 2 patients in whom we were able to acquire scintigraphic images 24 h after tracer injection, the decline in radioactivity uptake at the involved bone marrow sites was only about 15%–20% of the peak activity (after correction for the physical decay half-life of 99mTc). The 30-min scan as recorded according to the standard protocol was therefore considered optimal and representative of the highest radioactivity accumulation at the involved bone marrow sites.

(A) Single frames corresponding to first 4 min of dynamic recording after intravenous bolus of 99mTc-sestamibi in 21-y-old man with type 1 Gaucher’s disease. Tracer accumulation in infiltrated bone marrow is apparent within first few minutes after injection. (B) Static scans obtained in same patient as in A. Scans obtained 30 and 120 min after injection of 99mTc-sestamibi show virtually no change in radioactivity accumulation in extensively and intensely infiltrated bone marrow sites.
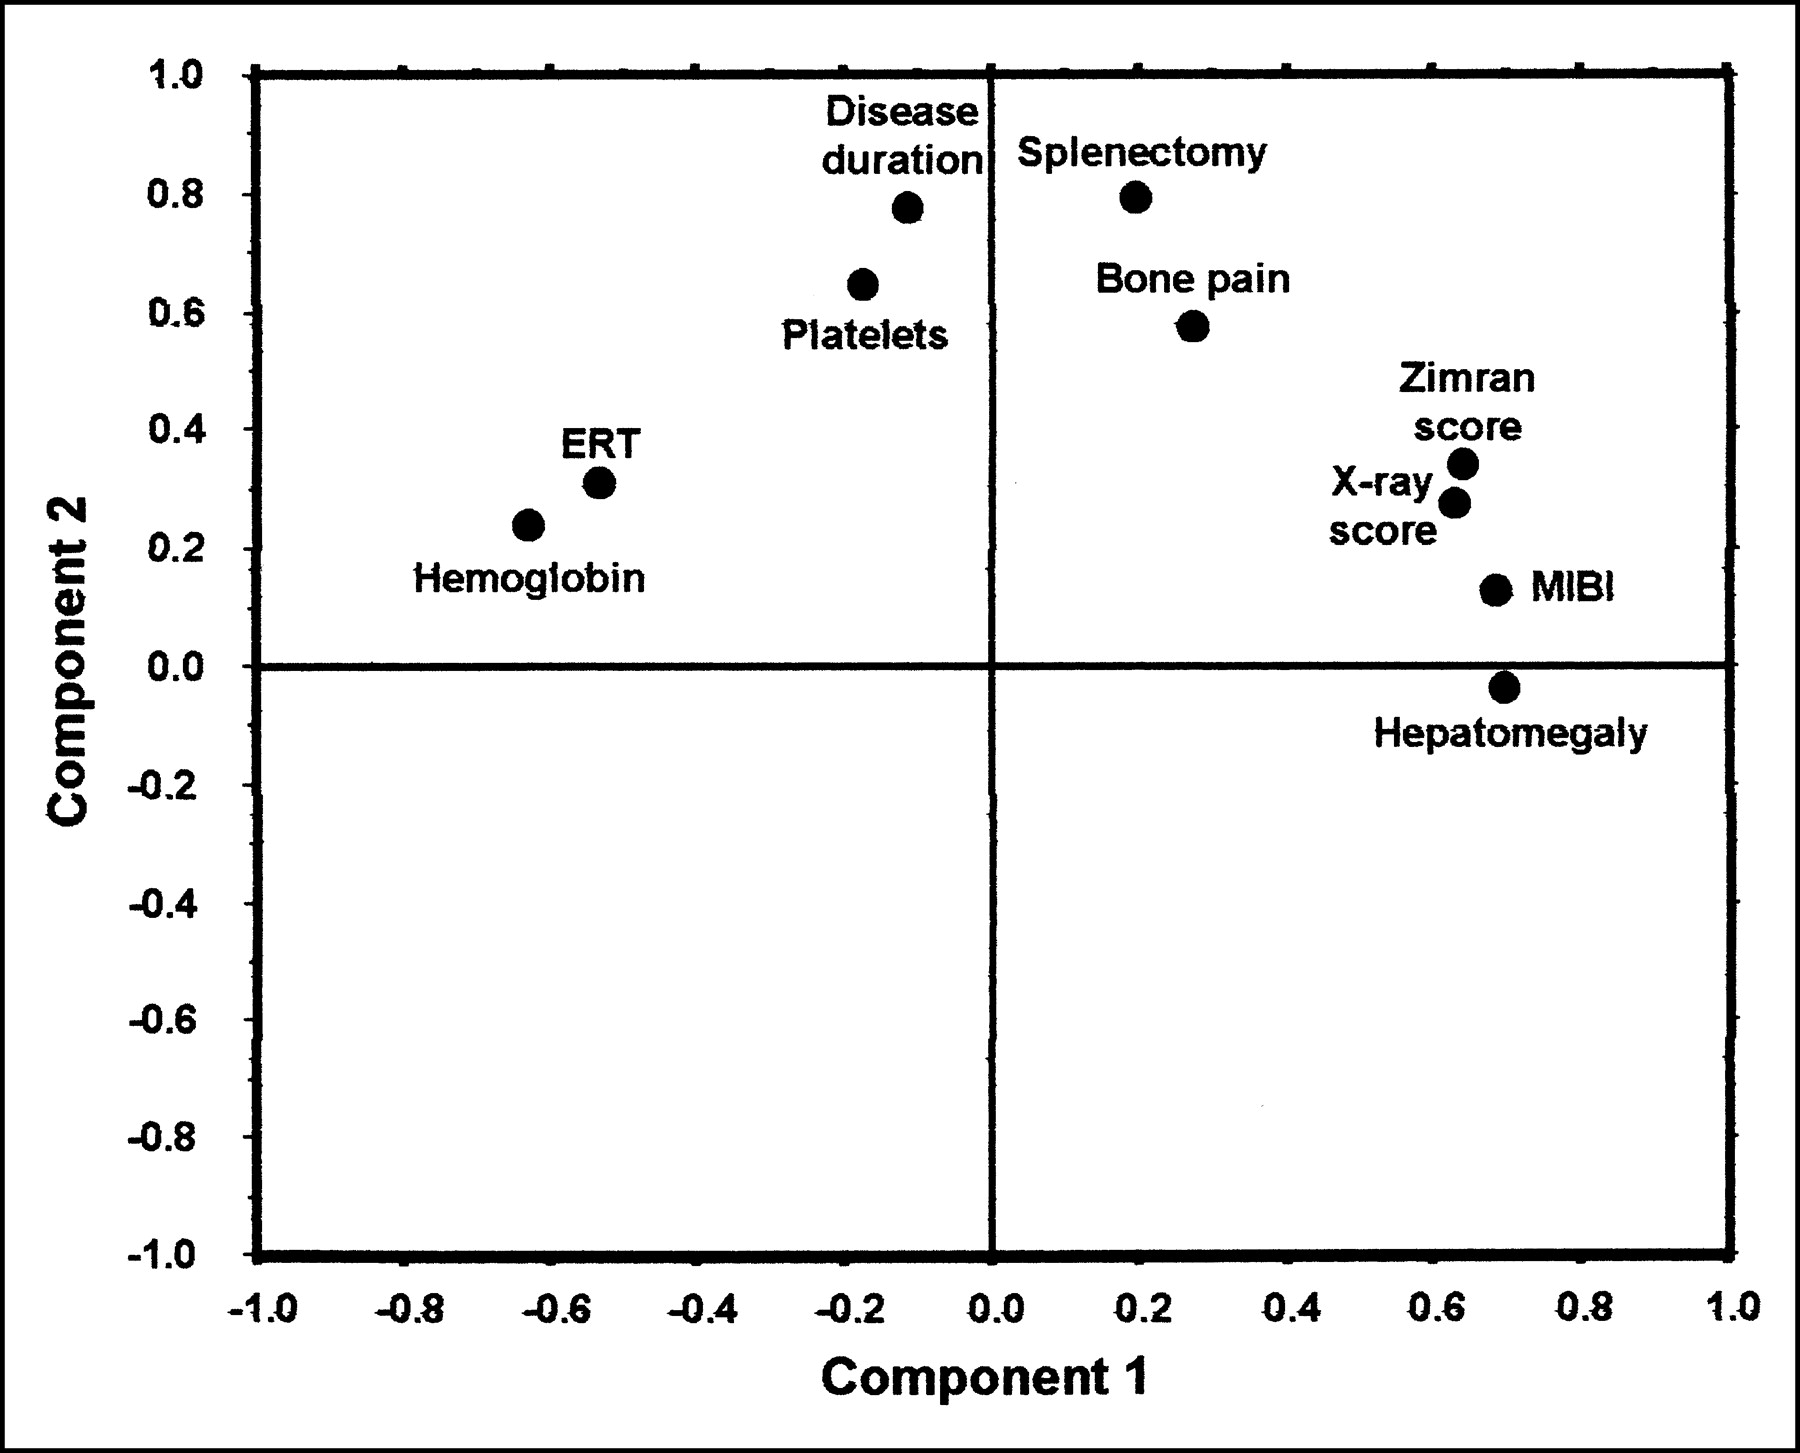
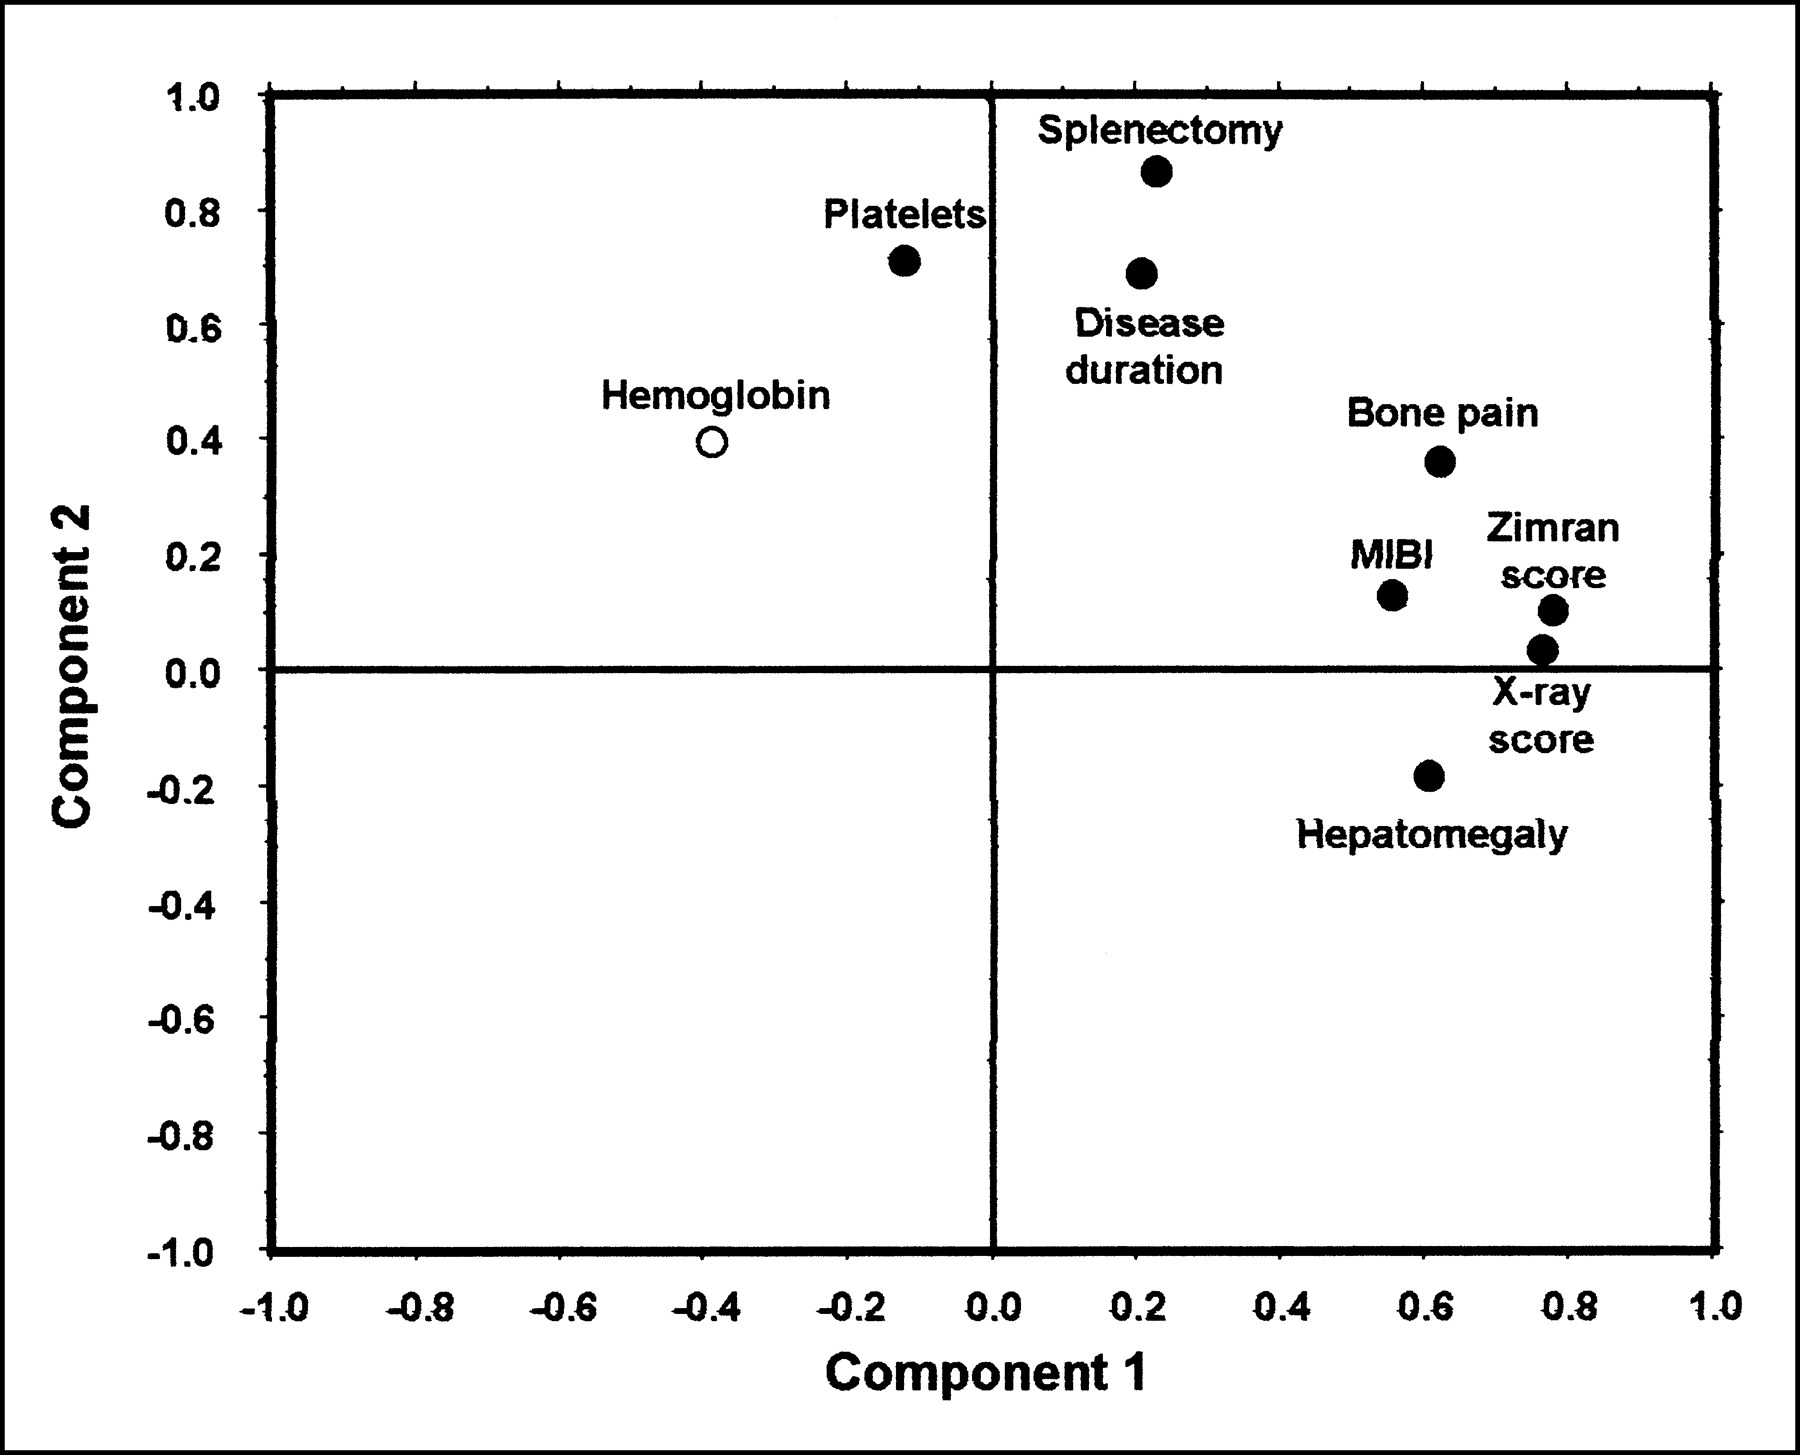
In general, ERT-naive patients had 99mTc-sestamibi scintigraphic scores significantly higher than those of patients receiving ERT (χ2 = 20.97, P = 0.034). The results of more complex statistical evaluation based on analysis of the principal components for all 74 patients included in the study are plotted in Figure 3. This loading plot does not include data on serum chitotriosidase (available only in a subset of patients) and splenomegaly (also available only in the subset of patients who had not been splenectomized).

Results of multidimensional statistical analysis in Gaucher’s patients in study, irrespective of ERT treatment. Splenomegaly and chitotriosidase variables are not represented in plot because these data were only available in a subset of patients. MIBI = 99mTc-sestamibi.
Analysis of the loading plot reveals that the first principal component (x-axis) includes variables that mostly concern severity of the disease, such as the Zimran score, hepatomegaly, and x-ray score, all characterized by very high positive loading. Other variables relevant as to the first component, but inversely correlated with the former ones, are hemoglobin concentration and prior ERT. On the other hand, the second principal component (y-axis) mostly includes statistical information on duration of the disease and on some correlated variables such as splenectomy, bone pain, and platelet count. The loading plot also shows that, in the whole group of patients with Gaucher’s disease, the 99mTc-sestamibi scintigraphic score is aligned with the parameters that define severity of the disease.
The scintigraphic score shows positive correlations with the combined clinical SSI according to Zimran (P = 0.002) as well as with some parameters contributing to the Zimran score, such as hepatomegaly (P = 0.002), the x-ray score according to Hermann (P = 0.012), prior splenectomy (P = 0.022), and bone pain (P = 0.044). The scintigraphic score is negatively correlated with hemoglobin (P = 0.022) and with prior ERT (P = 0.002). No statistical correlation exists between 99mTc-sestamibi scintigraphy and either duration of the disease or platelet count (probably because no distinction was made between splenectomized vs. nonsplenectomized patients). In the subset of 49 patients who had not been splenectomized (not shown in Fig. 3), there is no statistical correlation between the scintigraphic score and splenomegaly. Whereas, the highest statistical correlation of the scintigraphic score is found with the serum chitotriosidase levels (r = 0.78, P ≪ 0.001) in the subset of 38 patients in whom chitotriosidase data were available (not shown in Fig. 3).
Figure 4 illustrates the results of statistical analysis in the ERT-naive patients. In this group, the 99mTc-sestamibi scintigraphy score remains associated with the first principal component, which defines severity of the disease. In particular, positive correlation of the 99mTc-sestamibi score is confirmed with the x-ray score (P = 0.014), whereas statistical significance of the correlation with the combined Zimran SSI is borderline (P = 0.06). In the subset of 19 patients with serum chitotriosidase data (not shown in Fig. 4), the scintigraphic score is closely correlated with this biochemical marker (r = 0.79, P = 0.004).

Multidimensional statistical analysis in Gaucher’s patients evaluated by 99mTc-sestamibi scintigraphy before ERT treatment. Splenomegaly and chitotriosidase variables are not represented in plot because these data were only available in a subset of patients. Hemoglobin variable is represented by open circle to indicate its overall low statistical weight (<0.5 in multidimensional correlation matrix). MIBI = 99mTc-sestamibi.
Results of statistical analysis performed in the ERT-treated patients are plotted in Figure 5. In this group of patients, the variables linked to duration of the disease and those associated with treatment (duration of ERT, ERT dose per unit time, and cumulative dose received) cumulatively have the highest variance and therefore are placed on the first principal component (x-axis). The entire group of variables defining severity of the disease are thus shifted to the second principal component (y-axis). Also in this configuration of the loading plot, the 99mTc-sestamibi scintigraphic score shows high positive correlation with the SSI (P = 0.012) and with hepatomegaly (P = 0.044), whereas no significant correlation is found with the ERT parameters—that is, duration of ERT, ERT dose (U/kg of body weight per month), or cumulative dose given before the scintigraphic study. The statistical significance of the scintigraphic score negative correlation with hemoglobin is borderline (P = 0.06), as also is the positive correlation with serum chitotriosidase in a subset of 19 patients (P = 0.1).
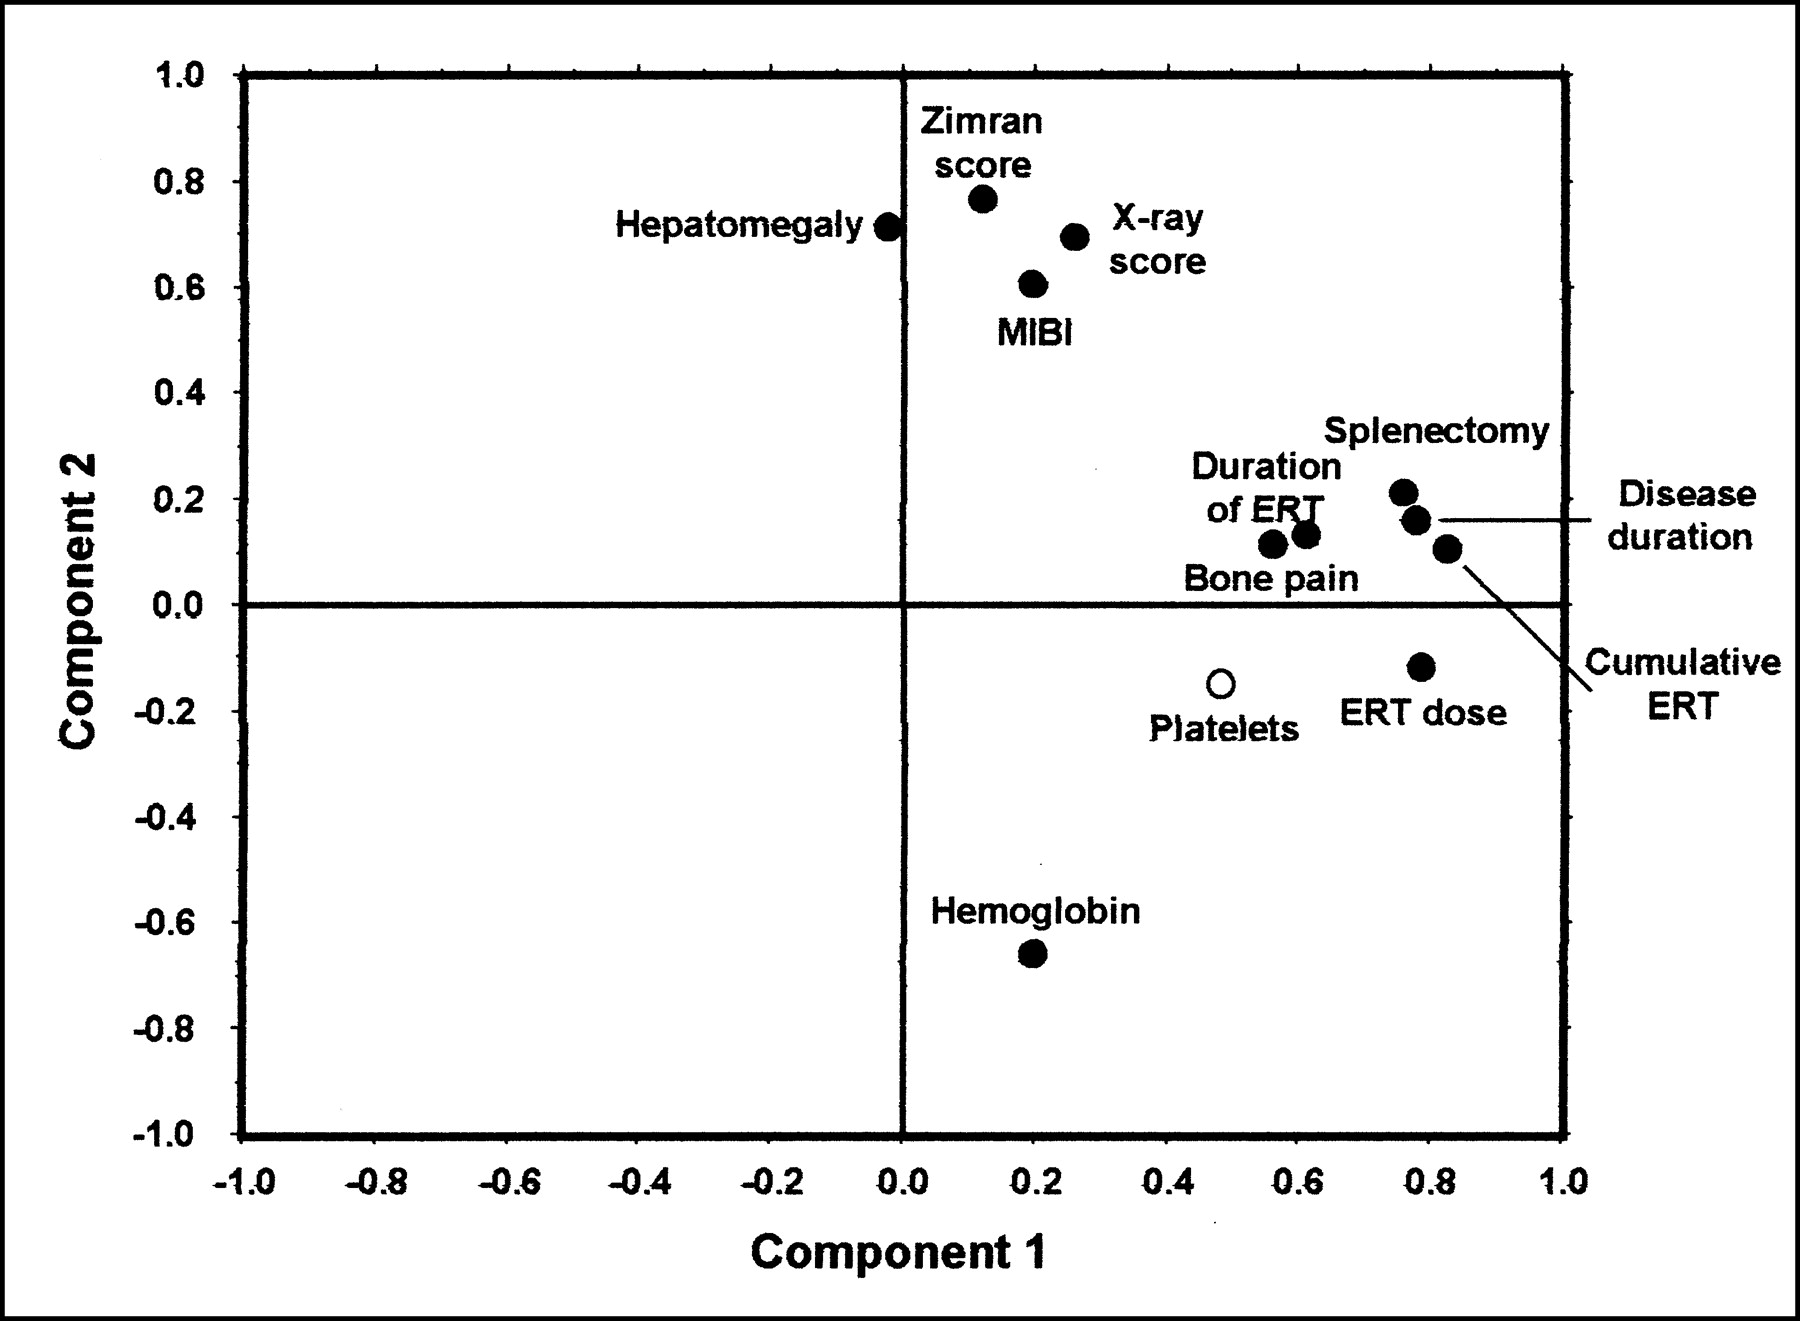
Multidimensional statistical analysis in Gaucher’s patients evaluated by 99mTc-sestamibi scintigraphy while receiving ERT. Splenomegaly and chitotriosidase variables are not represented in plot because these data were only available in a subset of patients. Platelets variable is represented by open circle to indicate its overall low statistical weight (<0.5 in multidimensional correlation matrix). MIBI = 99mTc-sestamibi.
DISCUSSION
The results of this study in a relatively large group of patients with Gaucher’s disease confirm our earlier observations on the ability of 99mTc-sestamibi scintigraphy to directly image bone marrow infiltrated by Gaucher’s cells. Our experience proved that this scintigraphic procedure is easy to perform and highly practicable in young children as well as adults.
It should be noted that the pattern of bone marrow involvement visualized by 99mTc-sestamibi scintigraphy is somewhat discrepant with respect to the pattern visualized by MRI in patients with Gaucher’s disease (38). The most frequently reported MRI abnormality is reduced signal intensity of the bone marrow spaces on the T1- and T2-weighted images. This decrease in signal intensity, which seems to progressively extend from the proximal to the more distal portions of the long bones, is commonly attributed to progressive displacement of the hematopoietic, fat-rich marrow. However, a possible contributing factor to reduced MRI signal intensity is represented by edema, whose occurrence in the bone marrow infiltrated by Gaucher’s cells can be linked to increased local production of proinflammatory cytokines, such as interleukin-6 and interleukin-10, in response to the presence of pathologic macrophages (39).
On the other hand, one cannot exclude the possibility that the 99mTc-sestamibi pattern of initial bone marrow involvement centered electively around the knees (distal femoral and proximal tibial epiphyses) results simply from a scintigraphic summation effect on planar images. In fact, both the distal femoral and the proximal tibial epiphyses are the thickest portions of these long bones, so that they would appear as relatively hyperactive even if assuming homogeneous radioactivity accumulation in the bone marrow space rather than preferential accumulation at these sites. Nevertheless, the scintigraphic patterns observed in most of our patients mimic the pattern of Gaucher’s deposits visualized after injection of 123I-labeled macrophage-targeted Alglucerase (Genzyme Corp.), which is the same preparation used for ERT in these patients (40). Similar patterns of distribution have been observed in patients with Gaucher’s disease after intravenous administration of 99mTc-labeled low-density lipoprotein, which targets activated macrophages (41).
It should also be pointed out that, in patients for whom MRI was performed at approximately the same time as 99mTc-sestamibi scintigraphy was performed, the pattern of bone marrow abnormalities detected by the 2 imaging modalities was quite similar, as shown in Figure 6. In some patients we had the opportunity of repeating 99mTc-sestamibi scintigraphy over 1 y after the first evaluation, a period during which these patients had followed different treatment regimens (ERT or no ERT). The preliminary results of this follow-up evaluation confirm that, also in the individual patients, spontaneous progression or ERT-induced regression of bone marrow involvement follows a pattern centered around the knee area (Fig. 7).

Comparison of paired MR (top panels) and 99mTc-sestamibi (bottom panels) images in 2 patients affected by Gaucher’s disease, respectively, of type 1 (A) and type 3 (B). In both patients, T1-weighted MR images show initial reduction of signal intensity affecting primarily distal portion of femurs, approximately in same areas exhibiting abnormal 99mTc-sestamibi uptake. MRI shows some asymmetry in degree of bone marrow involvement, which is slightly more pronounced in right femur in patient 5 and in left femur in patient 4; same asymmetry is also mirrored in 99mTc-sestamibi scans.
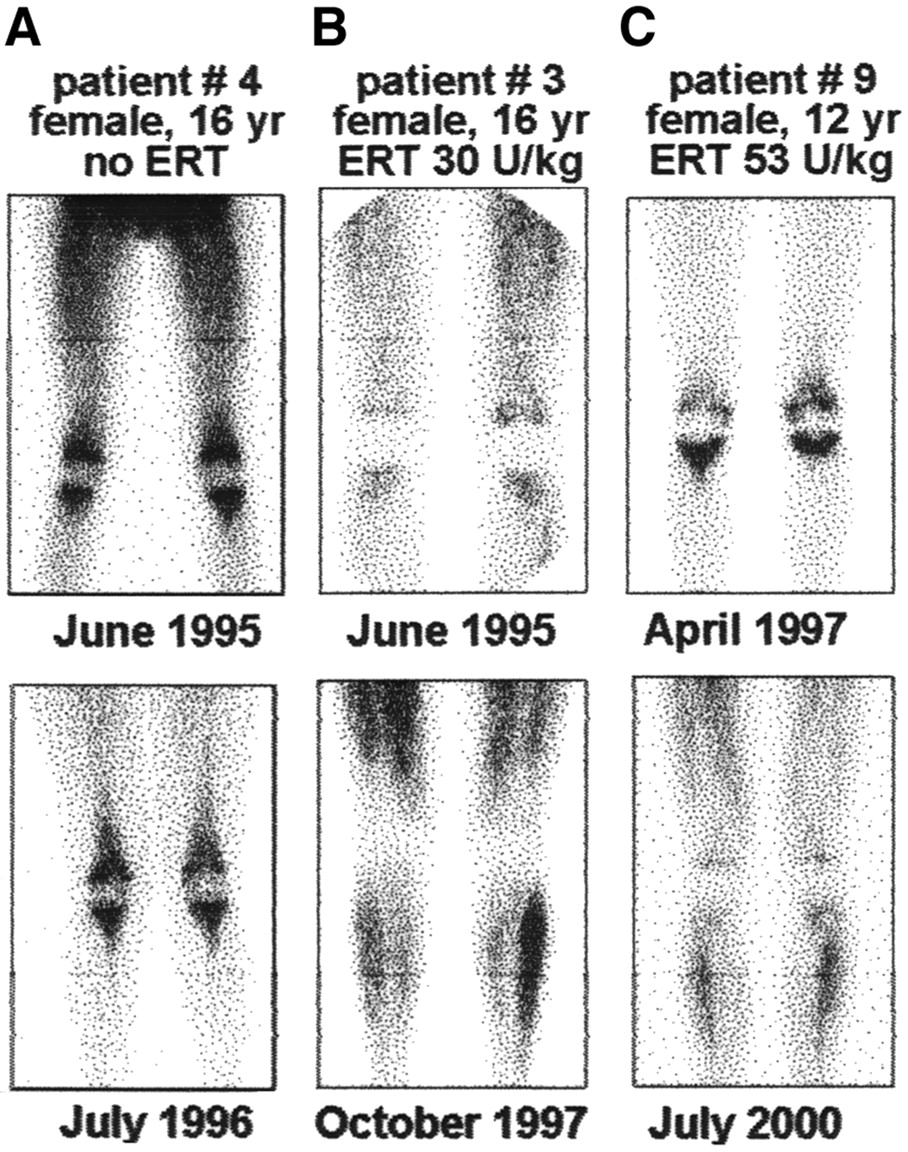
Follow-up 99mTc-sestamibi scans in 3 patients evaluated on >1 occasion. Images at top correspond to baseline scintigraphy for each patient, whereas images at bottom are follow-up scans. (A) Patient 4, type 3 Gaucher’s disease, did not receive ERT after baseline scan: After about 13 mo, progression of bone marrow involvement from knees to femoral and tibial diaphyses is clearly visualized in follow-up scan. Patients 3 (B) and 9 (C) received ERT starting immediately after baseline scintigraphy: Follow-up scans (16 and 39 mo later, respectively) visualize regression of bone marrow involvement, which has virtually disappeared in patient 3 and is greatly reduced solely to knees in patient 9.
All the above observations are consistent with the assumption that radioactivity uptake in the infiltrated bone marrow actually reflects intracellular accumulation of 99mTc-sestamibi within the glucocerebroside-laden macrophages that have been transformed into Gaucher’s cells. In fact, clinical applications of 99mTc-sestamibi scintigraphy are based on its property to be actively concentrated in cells with increased metabolic expenditure, such as myocardiocytes, tumor cells, and so forth. Increased resting energy expenditure is a well-known feature of patients with Gaucher’s disease and has been attributed directly to the energy requirement of Gaucher’s cells (42,43). Therefore, the mechanism of 99mTc-sestamibi accumulation in the Gaucher’s deposits is not solely based on lipophilicity of the compound (as is the case for the radioactive gas, 133Xe) but reflects the actual metabolic status of Gaucher’s cells at the moment of tracer injection. This pattern of distribution is consistent with the observation of photopenic areas at marrow sites replaced by fibrous tissue because of prior acute episodes of necrosis or bone fractures. In this respect, scintigraphy with a positive indicator such as 99mTc-sestamibi represents an advantage over scintigraphy with radiocolloids. The latter is based on the identification of the normally functioning bone marrow and therefore cannot distinguish between bone marrow infiltrated by Gaucher’s cells and bone marrow replaced by fibrous tissue. Except for the more sophisticated protocols (7,13,14), which are not widely available, MRI of the bone marrow suffers limitations similar to those of radiocolloid scintigraphy, because it is based on identifying the lack of signal from the normal bone marrow.
Accumulation of 99mTc-sestamibi in Gaucher’s deposits is not confined solely to the infiltrated bone marrow, but it can also be observed in other organs typically involved by the disease, such as the liver and spleen (Fig. 8). Clearly, 99mTc-sestamibi accumulation in the bone marrow is not specific for Gaucher’s infiltration. However, we believe that the possible role of this scintigraphic technique is not in the initial diagnostic phase but, rather, as an adjunct imaging procedure when assessing the severity of the disease.

99mTc-Sestamibi scans obtained over abdomen (A) and lower limbs (B) of 37-y-old woman with type 1 Gaucher’s disease who had not been treated with ERT before scintigraphy. Although physiologic hepatobiliary excretion of tracer somewhat complicates interpretation of scan in abdominal area, there is clear visualization of markedly enlarged liver extending down to umbilical line and dramatically enlarged spleen extending down to iliac crest. In this patient, severe visceromegaly is associated with only minor bone marrow involvement.
The scintigraphic score described in this study was found to be helpful for defining semiquantitatively the severity of bone marrow infiltration by Gaucher’s cells. It was thus possible to use this numeric parameter for complex statistical analysis aimed at assessing possible correlations of the scintigraphic score with the conventional, commonly available parameters defining the severity of Gaucher’s disease. Statistical analysis did not include MRI data, which was only available for a few cases because patients came from several different locations representing dramatic differences in available medical care and access to advanced imaging technologies.
Analysis of the data with highest statistical weight included all 74 patients irrespective of whether they were or were not receiving ERT. In these patients, the scintigraphic score was highly correlated, either positively or negatively, with the combined Zimran SSI as well as with some of the parameters contributing to SSI (hepatomegaly, x-ray score, prior splenectomy, bone pain, hemoglobin). A highly significant negative correlation was also found between the scintigraphic score and prior ERT, thus further confirming reliability of the 99mTc-sestamibi scintigraphic score as an indicator that changes in response to treatment. The complex statistical analysis required by the large number of variables involved relies on a sizable population sample, such as the one evaluated in this study. This consideration might explain why a prior attempt at correlating a simplified 99mTc-sestamibi scintigraphic score with parameters of disease severity and of treatment, based on only 11 patients, failed (29).
It should also be emphasized that the highest statistical correlation of the scintigraphic score was found with serum chitotrisidase, recently emerging as a powerful overall parameter of disease severity (33). Therefore, imaging with 99mTc-sestamibi appears to be a useful complement of topographic information concerning bone marrow sites involved by the disease with global disease severity indicated by serum chitotriosidase.
The high correlation of the scintigraphic score with serum chitotriosidase was confirmed in patients evaluated before receiving ERT, whereas this correlation was borderline in patients previously treated with ERT. It should be emphasized that the latter group of patients exhibited a wide range of treatment parameters, such as dose of ERT, which ranged from 10 to 85 U/kg of body weight per month, and the duration, which varied between 7 and 96 mo.
CONCLUSION
The results obtained in this study confirm the feasibility of 99mTc-sestamibi scintigraphy to image bone marrow involvement in patients with Gaucher’s disease. The scintigraphic score described here is based on evaluation of a limited region of the skeleton (the lower limbs) where visual analysis of the scans is not affected by physiologic distribution of 99mTc-sestamibi in the abdominal area, a possible source of misleading interpretation when estimating the degree of bone marrow involvement in the spine and iliac bones. Nevertheless, the high statistical correlations found with well-established parameters of disease severity indicate that the scintigraphic pattern observed in such limited region is a sensitive indicator of the overall severity of skeletal changes affecting patients with Gaucher’s disease. The scintigraphic score can thus be used to evaluate severity of bone marrow involvement and permits comparison among various patients. Besides being highly correlated with other independent parameters of disease severity, the scintigraphic score also seems to correlate with the response to ERT, at least in a cross-sectional study such as the present one. The reliability of the 99mTc-sestamibi score as a topographic and quantitative parameter for monitoring the efficacy of ERT in individual patients as well as for predicting the risk of bone complications and irreversible damages remains to be elucidated in further longitudinal studies. The important benefits obtained using this technique are readily available in conventional nuclear medicine facilities.
APPENDIX
The method used for the statistical evaluation, analysis of the principal components (37), reduces the dimensions of a multiple variable X1,……, Xp, and identifies how the variables considered cluster together in a multidimensional matrix. Principal components are represented by the linear combinations of the original variables ranked in decreasing order on the basis of their autovalues (or eigenvalues), which in this type of analysis correspond to the amount of variance due to each linear model. Therefore, the first principal component is the variable characterized by the highest variance, the second one (not necessarily correlated with the first variable) has the main fraction of the residual variance, and so on. Analysis of the principal components is, in turn, a factorial analysis, as it produces a set of principal components that can be considered as new variables. To choose the proper number of factors, one can refer to the fraction of variance justified by each factor, or to the eigenvalues of the individual factors (which must be higher than 1). The linear coefficients of each variable correspond to the autovectors of the correlation matrix. Eigenvalues are orthogonal; therefore, the statistical weight of each variable can be projected bidimensionally on the factorial plot built with the first 2 variables identified as the principal components. Eigenvalues (therefore, the correlation coefficients of each variable with the main axes) permit defining the extracted components. In fact, the significant principal components can easily be defined on the so-called loading plots, which contain the correlation coefficients between the variables and the resulting principal axes and which indicate the most significant variables in each component. The loading plot projects the original variables in the space of the principal components: coordinates of the variables along the principal components are the “loadings”—that is, the statistical weights (or coefficients) of the original variables in the linear combinations that define the principal components themselves. In the loading plot, the most influential variables of a given component are those significantly farther from the center of the component, whereas any variable close to the center of the component has low loading—therefore, virtually null statistical weight in the linear combination. The cosine of the angle, defined by joining each pair of variables with the center of the 2 orthogonal axes, corresponds to the correlation coefficient (R2) of the 2 variables. Therefore, when any 2 variables form a 0° angle they are positively correlated (considering that cos 0° = 1). When the angle is 90° the 2 variables are not correlated at all (cos 90° = 0), and when the angle is 180° the 2 variables are correlated in a negative fashion (cos 180° = −1). The distance of each variable from the center of the orthogonal axes is proportional to the statistical weight of that variable on the principal components.
Because representation of the variables is simplified in a bidimensional loading plot, whereas the system is actually multidimensional, spatial relationships among the variables are obviously affected by a parallax error. In other words, 2 variables that might appear to be very close in the bidimensional, planar plot (therefore indicating high statistical correlation between them) can actually belong to 2 different planes in space (therefore not being statistically correlated). This error is highest for variables with the lowest statistical weight on the 2 variables identified as the principal components.
The statistical approach described above can also be used when variables with different characteristics are simultaneously present, as is the case for this study, which includes continuous numeric variables (such as age, hemoglobin, platelet counts, and so forth), discrete variable (e.g., semiquantitative scores), and binary variables (e.g., splenectomy vs. nonsplenectomy, ERT vs. non-ERT).
Acknowledgments
The authors thank all of the individuals and organizations that have greatly contributed to performing this study, starting with all patients who have volunteered for the scintigraphic investigation. Without their enthusiastic participation and without the continuing support of the Italian Association of Gaucher Disease, this study would not have been possible. Dr. Assuero Giorgetti and the technologist Isabella Raugei have helped to perform some of the 99mTc-sestamibi scans at the Institute of Clinical Physiology of the Italian National Research Council, Pisa (Italy). Thanks are also due to Dr. Paolo Tomà and Dr. Mauro Occhi (Radiology Service, G. Gaslini Children’s Hospital, Genoa, Italy) for reading skeletal x-ray films and assigning the Hermann score. Some of the 99mTc-sestamibi scans were performed by Dr. Paola Marozzi (Nuclear Medicine Service, V. Cervello Hospital, Palermo, Italy) and by Dr. Stefano Fanti (Nuclear Medicine Service, Malpighi–S. Orsola Hospital, Bologna, Italy). The following physicians referred some of the patients for the study: Dr. Clodoveo Ferri (Rheumatology Unit, University of Pisa Medical School, Pisa, Italy); Dr. Gaetano Giuffrida (Division of Hematology, University of Catania Medical School, Catania, Italy); Dr. Massimo Morfini and Dr. Silvia Alinari (Division of Hematology, Careggi Hospital, Florence, Italy); Dr. Marco Spada (Division of Pediatrics, Regina Margherita Hospital, Turin, Italy); Dr. Stefania Zoboli (Hematology/Oncology Unit, Center of the Italian Association of Pediatric Hematology/Oncology, Modena, Italy); and Dr. Maria Cappellini (Division of Internal Medicine, Padiglione Granelli, Maggiore Hospital, University of Milan, Milan, Italy). DNA samples for genotyping were obtained from the “Cell Line and DNA Bank from Patients Affected by Genetic Diseases” (http://www.gaslini.org/labdppm.htm) supported by grants from Italian Telethon (project GTF01009). Financial support provided by the Italian subsidiary of Genzyme Corp. during some phases of the study is also gratefully acknowledged.
Footnotes
Received Dec. 16, 2002; revision accepted Apr. 24, 2003.
For correspondence or reprints contact: Giuliano Mariani, MD, Regional Center of Nuclear Medicine, University of Pisa Medical School, Via Roma 67, I-56126 Pisa, Italy.
E-mail: g.mariani{at}med.unipi.it


