


Abstract
Local myocardial blood flow measurements are of great importance in experimental and clinical settings. However, a lack of ideal markers is evident. Adenosine is suggested to be a potential candidate because of its high uptake and rapid intracellular sequestration. We specifically tested the hypothesis that the local deposition density of labeled adenosine within the heart reflects local myocardial blood flow. Methods: Tracer microspheres, the recognized standard for local blood flow measurements, were injected and compared with simultaneously injected labeled adenosine (3H/14C) in tracer concentration into the left atrium of anesthetized Beagle dogs (n = 7). Myocardial deposition densities were assessed through β-scintillation and γ-counting measurements in samples (100–128 per heart) of an average wet mass of 487 ± 54 mg. To challenge local myocardial blood flow distribution, alprostadil was infused into the left circumflex artery in 3 experiments. In 2 other experiments, erythro-9-hydroxy-nonyl-adenine (EHNA) was infused to inhibit degradation of injected adenosine to inosine. Results: Tracer adenosine and microspheres did not exert significant local or systemic hemodynamic effects. Both were almost completely extracted from blood within 2 min and locally retained in the tissue. Deposition densities of tracer microspheres and labeled adenosine correlated closely in each experiment, independently of the respective protocol (control, EHNA, or alprostadil), over a wide range of local myocardial blood flows (0.23–12.9 mL min−1 g−1). The mean correlation coefficient (n = 293) was r = 0.93 (r2 = 0.86; P < 0.0001), indicating that the deposition density of 3H-adenosine could explain local blood flow as measured with the tracer microsphere technique with 86% probability. Conclusion: Adenosine appears to be a reliable marker of local blood flow in dog myocardium.
- adenosine kinase
- coronary endothelium
- flow-limited transport
- nucleoside membrane transport
- tissue residue
The narrowing of a coronary artery is traditionally viewed as a hallmark of coronary heart disease and a predisposition for myocardial ischemia. However, only 50% of patients in whom severe myocardial ischemia develops exhibit hemodynamically significant epicardial coronary artery stenoses of >50% of the vessel cross-sectional area. In syndrome X, patients may report chest pain in the absence of epicardial coronary congestion, although coronary flow reserve may be notably reduced. Furthermore, electrocardiography changes and lactate release observed in these patients indicate myocardial ischemia (1). Initial reports from the Women’s Ischemia Syndrome Evaluation show that the prognosis of coronary artery disease in women is worse than suggested by the degree of epicardial artery narrowing (2). Furthermore, experimental studies on physiologic blood flow heterogeneity show that the supply/demand balance in ventricular myocardium differs on the local level and that this difference may affect the outcome of acute myocardial ischemia (3,4). Thus, in addition to measurement of coronary artery diameter, the direct assessment of regional myocardial blood flow seems of great importance for risk stratification of myocardial ischemia.
Although there is a considerable demand, a lack of useful flow markers is evident. Generally, a marker of local blood flow has to fulfill 3 criteria. First, it must be deposited in the tissue proportional to flow during the first organ passage after injection. Second, it must remain at the deposition site until measurement. Third, it must have no effect on either the systemic circulation or local organ hemodynamics. Adenosine has been shown to be extracted from plasma by different cells and tissues (e.g., endothelium, vascular smooth muscle cells, and cardiomyocytes). Important characteristics are its facilitated transport across cell membranes, rapid intracellular metabolism because of a high phosphorylation rate (5), and high degree of cellular compartmentalization (6,7). Adenosine is known to be almost completely extracted from blood under physiologic conditions during a single pass through the coronary circulation of the dog heart (8). Furthermore, as shown in guinea pig hearts, most infused adenosine at submicromolar concentrations is deposited in the endothelium (9), suggesting that tracer amounts of labeled adenosine may serve as a powerful flow marker. We specifically tested the hypothesis that the local deposition density of labeled adenosine within the heart reflects local myocardial blood flow. To achieve this, we injected tracer microspheres, the recognized standard for local blood flow measurements, and compared them with simultaneously injected labeled adenosine at tracer concentrations into the left atrium of anesthetized Beagle dogs. Deposition densities of tracer microspheres and adenosine correlated closely over a wide flow range, indicating that adenosine is a reliable marker of local blood flow in dog myocardium.
MATERIALS AND METHODS
All experiments were performed according to the animal welfare regulations of the German federal authorities, and the study protocol was approved by a local ethical committee. Seven Beagle dogs (15–20 kg in body mass) were anesthetized with piritramide (3 mg/kg intravenously) and midazolam (2 mg/kg intravenously). After relaxation with vecuronium bromide (0.2 mg/kg intravenously) and endotracheal intubation, the dogs were ventilated with a respirator. Anesthesia and analgesia were maintained by a continuous intravenous infusion of 0.6 mg kg−1 h−1 piritramide and 0.6 mg kg−1 h−1 midazolam. Vecuronium bromide was given intravenously at 0.12 mg kg−1 h−1. Blood gas and acid-base parameters were measured at 30-min intervals and maintained within physiologic limits. The body temperature was monitored with a rectal thermistor probe and kept at 37°C–38°C with a heating pad and an infrared lamp. The right femoral artery and vein were catheterized with triple-lumen catheters for arterial blood sampling, measurement of arterial blood pressure (P 23 ID strain gauge; Statham Instruments Inc., Oxnard, CA), and continuous intravenous infusion of a modified Tyrode’s solution (5 mL kg−1 h−1). Heart rate was obtained from the aortic pressure signal. The chest was opened through the fourth or fifth intercostal space. After opening of the pericardium, the left atrium was cannulated with flexible tubing 1.5 mm in outer diameter, which was advanced approximately 3 cm through the left atrial appendage, for subsequent tracer injections. A 7-French Goodale-Lubin catheter was advanced into the coronary sinus from the right superficial jugular vein. To challenge the heterogeneity of spatial blood flow distribution in the left ventricular myocardium, regional ischemia was induced while the vascular bed of an adjacent coronary artery was dilated with alprostadil (Prostavasin; SCHWARZ PHARMA AG, Monheim, Germany) (Table 1). Therefore, in 3 experiments 10 min after the first tracer microsphere injection, a small side branch (<1 mm in diameter) of the left circumflex coronary artery (LCx) was occluded and retrogradely cannulated with a thin vinyl catheter. The dependent myocardium of this occluded side branch served as an ischemic area in the consecutive experiment. The catheter was advanced to the LCx to serve as an infusion port for alprostadil (2 μg/mL). Alprostadil, rather than adenosine or dipyridamole, was used, because it does not interfere with the metabolism and transport of the tracer adenosine. A Doppler flow probe (T206; Transonic Systems Inc., Ithaca, NY), placed around the LCx proximal to the cannulated side branch, gave an online measurement of the effectiveness of the pharmacologic vasodilation. Infusion rates were adjusted to induce an approximately 3-fold increase in mean LCx flow. In 2 separate experiments, the adenosine deaminase blocker erythro-9-hydroxy-nonyl-adenine (EHNA) was applied (5 μmol EHNA per kilogram, given through the left atrium, followed by a continuous intravenous infusion of EHNA at a rate of 5 μmol/min) to inhibit degradation of adenosine to inosine (Table 1). The hemodynamic data were recorded continuously on a polygraph.
Scheme of Study Protocol
Regional myocardial blood flow was determined with the tracer microsphere technique using spheres (New England Nuclear, Boston, MA) with a diameter of 15.2 ± 0.1 μm labeled with 46Sc, 85Sr, 113Sn, or 153Gd and suspended in 10% dextran supplemented with 0.01% polysorbate 80 as described previously (10). Microsphere suspensions were dispersed by repetitive stirring and continuous sonication for at least 20 min. Approximately 6–9 × 10⁶ microspheres per injection were aspirated in a 5-mL syringe, mixed with 3 mL of atrial blood, and immediately infused over 30 s. This infusion was followed within 30 s by a flush of 2 mL of warm saline. Local myocardial deposition densities of tracer microspheres and simultaneously applied 100-μL 3H-adenosine (3.7 MBq; Amersham Biosciences, Piscataway, NJ) were determined. The methodologic error of the adenosine deposition density was estimated in 1 experiment in which 3H- and 14C-labeled adenosine (1.9 and 7.4 MBq, respectively) were injected simultaneously (Table 1). Reference organ samples were withdrawn through an aortic catheter at a rate of 10 mL/min beginning 30 s before the start and ending 2 min after the end of tracer injection. The entire reference blood sample was distributed into test tubes and prepared for counting. In 2 experiments, aortic indicator dilution curves of 3H-adenosine and tracer microspheres were determined (Table 1). In these experiments, whole-blood samples were withdrawn continuously from the aorta at a rate of 10 mL/min and fractionated into 15-s samples from 0 to 60 s and into 30-s samples until the fifth minute after injection. The percentage fractions of the tracer in the respective samples were calculated.
According to previously published standardized methods (11), the myocardial tissue was freeze dried and primarily dissected into 100–128 samples. On the basis of the flow distribution curves, as obtained from measurement of the tracer microsphere deposition densities, a similar number of samples (43 ± 15) from 6 different flow classes in each heart was selected and subjected to further sample processing. The average wet mass used in these analyses was 487 ± 54 mg. Additionally, in 1 experiment, all 120 samples were analyzed to obtain a complete flow map. For measurement of the deposition densities of 3H- and 14C-labeled adenosine, acid extracts of each tissue sample were prepared as previously described (11). An aliquot of the acidic supernatant was used for later β-scintillation measurements (model 1409 liquid scintillation counter; Wallac, Turku, Finland). The individual γ-radioactivity in each tissue sample, along with microsphere standards and blanks, was determined in a γ-counter (WIZARD 1480; Wallac Oy, Turku, Finland) at window settings of 84–104 keV (153Gd), 430–470 keV (113Sn), 490–530 keV (85Sr), and 850–1,000 keV (46Sc). Deposition densities of the different γ-emitting isotopes were corrected for spectral overlap with MultiCalc software (version 1.84; Wallac).
Data in this study are given as mean ± SD. Absolute myocardial blood flows determined with the microsphere method were calibrated (mL min−1 g−1) using the reference organ measurements. To facilitate an interindividual comparison of myocardial blood flow data, relative deposition densities were calculated for individual myocardial samples from each experiment by dividing the deposition density of each sample by the average deposition density of the particular injection of microspheres or adenosine. Differences between experimental groups were tested with the Mann-Whitney test. The effects of injection of either tracer microspheres, adenosine, EHNA, or alprostadil on myocardial blood flow were assessed by the Wilcoxon signed rank test (2-sided). Regression analyses were based on individual measurements using the Spearman rank correlation coefficient. Statistical analyses were performed using SPSS software (version 6.0.1; SPSS Inc., Chicago, IL) for Windows (Microsoft, Redmond, WA). A value of P < 0.05 (2-sided) was assumed to indicate a significant difference.
RESULTS
Hemodynamics
Under resting conditions, mean aortic blood pressure averaged 90.0 ± 5.2 mm Hg; heart rate, 95 ± 22 beats min−1; left ventricular free wall blood flow, 1.49 ± 0.49 mL min−1 g−1; and circumflex blood flow, 25 ± 5 mL min−1. At the doses applied, injection of neither labeled microspheres, 3H/14C-adenosine, nor EHNA exerted systemic vasoactive effects, as judged by the lack of effect on any of the above hemodynamic parameters. In contrast, intracoronary infusion of alprostadil augmented circumflex blood flow almost 3-fold, to 71 ± 11 mL/min, and increased the flow range (mean flow range control from 0.75 ± 0.27 to 5.97 ± 5.95 mL min−1 g−1; mean flow range alprostadil from 0.59 ± 0.24 to 8.35 ± 6.43 mL min−1 g−1). However, alprostadil did not change global hemodynamics, including mean left ventricular blood flow of the entire free wall (1.56 ± 0.58 mL min−1 g−1).
Comparison of 3H-Adenosine and Tracer Microspheres
Figure 1 depicts an aortic indicator dilution curve for 3H-adenosine and tracer microspheres under control conditions. The percentage fractions of the respective tracers in whole blood appearing in the aorta within the first minute were almost identical, with a peak maximum at 30 s. After approximately 1 min, the dilution curves started to diverge (Fig. 1B). Although tracer microspheres almost completely disappeared from aortic blood within 2 min, a small fraction of 3H-adenosine (0.1%) was found until the fourth minute, indicating a minor fraction of tracer recirculation.

Aortic indicator dilution curves of 3H-adenosine and tracer microspheres under control conditions. Percentage fractions of respective tracers in whole blood emerging into aorta within 5 min after start of tracer application through left atrium are depicted for representative experiment. Linear scaling (A) and logarithmic scaling (B) of y-axis panel facilitate comparison between tracers at early and late times.
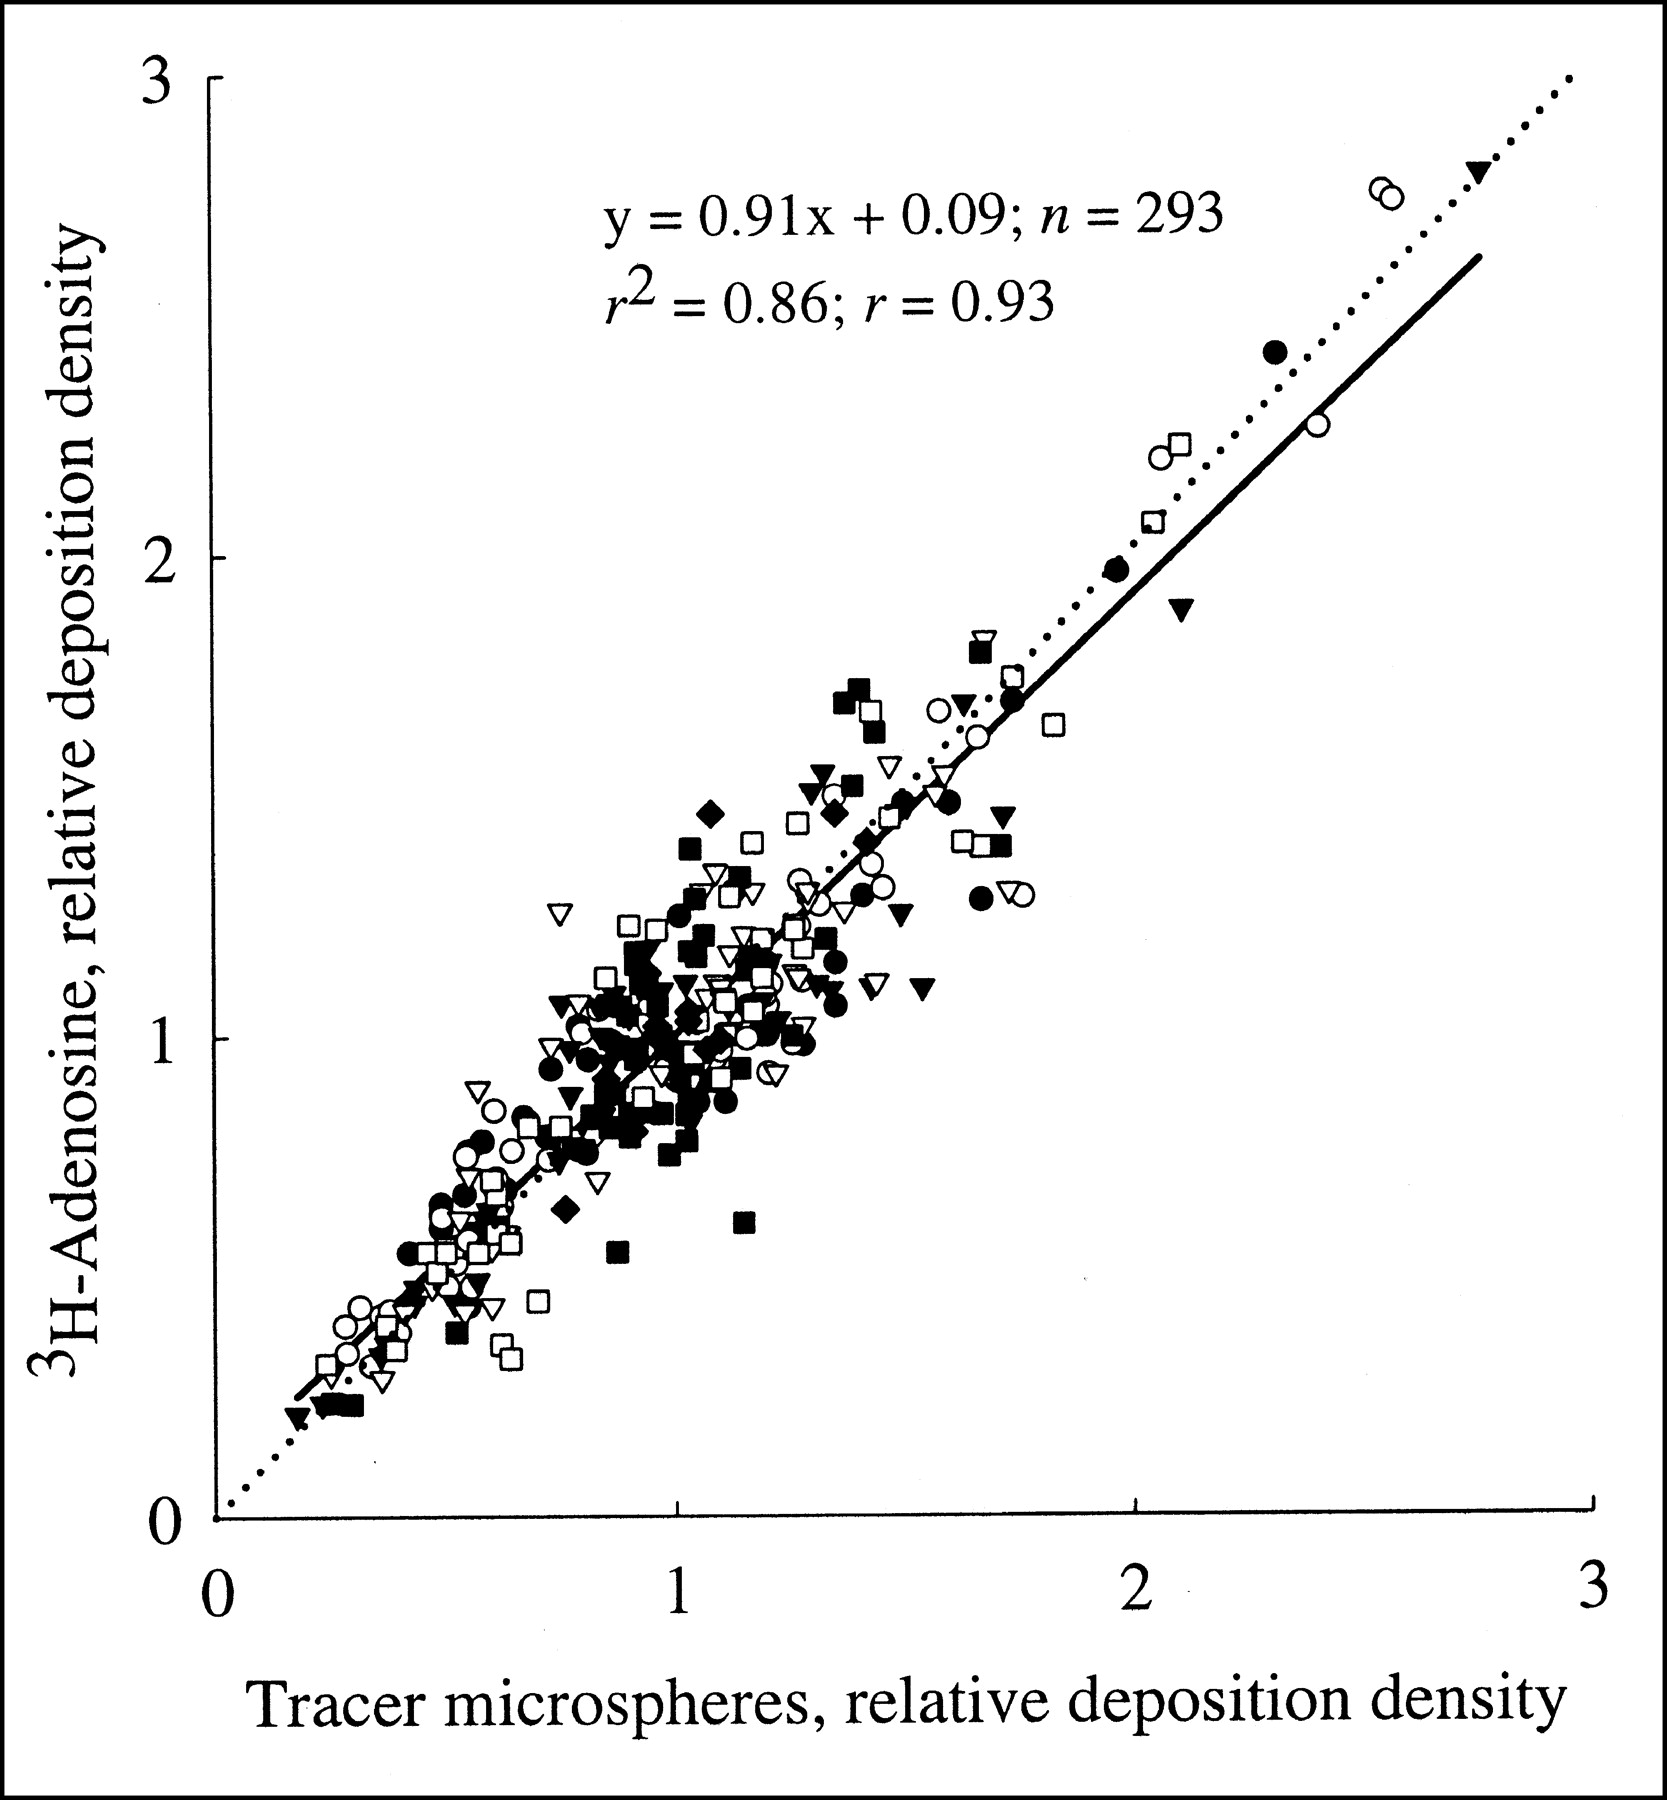
Figure 2 depicts the relationship between the relative deposition densities of tracer microspheres and 3H-adenosine in the left ventricular free wall during either control conditions, EHNA infusion, or alprostadil infusion. The respective correlation coefficient for all data points (n = 293) amounted to r = 0.93 (r2 = 0.86; P < 0.0001), indicating that the deposition density of 3H-adenosine could explain, with 86% probability, local blood flow as measured with the microsphere technique. This highly significant relationship was found in every experiment and over a broad range of local myocardial blood flows (0.22–12.9 mL min−1 g−1, Table 2). Although intracoronary alprostadil augmented the relative dispersion of local blood flows (0.45 ± 0.2 vs. 0.31 ± 0.5), the correlation coefficients for tracer microsphere deposition versus 3H-adenosine deposition were similar to those in the absence of alprostadil (Table 2: experiments 1 and 2, control; experiments 3 and 4, EHNA; experiments 5–7, alprostadil). Similarly, the presence of EHNA did not change the correlation coefficient.

Relationship between relative deposition densities of coinjected tracer microspheres and 3H-adenosine in left ventricular free wall during either control conditions, EHNA infusion, or alprostadil infusion. To facilitate comparison of different experiments, absolute flow values were normalized with respect to average deposition densities. Linear regression analysis was performed for all data points (solid line). Dotted line is line of identity.
Flow Analysis of Individual Experiments
Subendocardial and subepicardial samples from control and EHNA experiments revealed relative blood flows of 1.09 ± 0.33 and 0.95 ± 0.29 as assessed by the microsphere technique. Relative flows determined from the tracer adenosine distribution were 1.06 ± 0.30 and 0.94 ± 0.26, respectively. The endocardial-to-epicardial flow ratios were 1.15 and 1.13 for the microsphere and the tracer adenosine techniques, respectively, and were not significantly different. In ischemic myocardial samples, the subendocardial and subepicardial relative blood flows were 0.37 ± 0.15 and 0.87 ± 0.32 as measured with the tracer microsphere technique and 0.40 ± 0.17 and 0.89 ± 0.31 as assessed with the tracer adenosine technique. The endocardial-to-epicardial flow ratios were 0.43 and 0.45 for the microsphere and the tracer adenosine techniques, respectively. This difference was not statistically significant.
Comparison of 3H- and 14C-Adenosine
The relationship between the deposition densities of coinjected 3H-adenosine and 14C-adenosine is depicted in Figure 3. As expected, a tight correlation (r = 0.97; r2 = 0.94; P < 0.0001) was found, indicating that the deposition density of 3H-adenosine could explain, with 94% probability, the local deposition density of 14C-adenosine. The coefficient of variation (SD/mean) for the deposition density measurements with the differentially labeled adenosine amounted to 0.1 for all single data points, indicating a small methodologic error.

Relationship between relative deposition densities of coinjected 3H-adenosine and 14C-adenosine in left ventricular free wall. Data are normalized with respect to average deposition density. Solid line is linear regression line. Dotted line is line of identity.
Mapping of Adenosine Deposition
Figure 4A shows a scheme of our experimental setup during intracoronary alprostadil infusion, along with the area that was subjected to sample analysis. The corresponding map of the local deposition densities of 3H-adenosine (n = 120) in the left ventricular free wall is depicted in Figure 4B. Here, the samples along the base to the apex axis (horizontal) are represented by 5 slices of the left ventricular free wall starting with slice 1 on the left (base) to slice 5 on the right (apex). Each slice contains data from 6 sectors starting with sector 1 and ending with sector 6 as equivalent to the anterior and lateral free wall of the left ventricle. Within each slice, the 4 layers of myocardium are ordered from left (subendocardium) to right (subepicardium). Although a proper anatomic classification was not intended in this study, it is evident that areas supplied by the LCx (sectors 4–6) received a high blood flow because of the local pharmacologic vasodilation with alprostadil. In contrast, areas supplied by the occluded side branch (sectors 1 and 2) showed a lower deposition density, especially in slices closer to the base. This analysis suggests that, given the high correlation of tracer microsphere and tracer adenosine deposition, local adenosine uptake can be well transformed into high-resolution flow maps.

Maps of local deposition densities of 3H-adenosine (n = 120) in left ventricular free wall during intracoronary alprostadil infusion. (A) Scheme of sample preparation. (B) Sample groups along base to apex axis represent 5 slices from left ventricular free wall starting with slice 1 on left (base) to slice 5 on right (apex). Each slice contains data from 6 sectors starting with sector 1 (bottom) and ending with sector 6 (top). Four layers of myocardium are ordered from inner (subendocardium) to outer (subepicardium). Data are from experiment 7. Subend = subendocardium; subep = subepicardium.
DISCUSSION
Adenosine, known as the dephosphorylation product of adenine nucleotides, mediates multiple biologic actions in the heart, including coronary dilation, bradycardia, negative inotropic actions, and preconditioning (12). When exogenous adenosine is applied, these effects are usually associated with adenosine plasma concentrations in the micro- to millimolar range. However, significant species differences seem to exist. In humans, strong vasodilation occurs when adenosine is applied intravenously at doses ranging from 70 to 500 μg kg−1 min−1 (13). Simultaneously, venous plasma concentrations are around 2 μmol/L (14). In guinea pig isolated heart, the threshold adenosine concentration for coronary vasodilation is around 10 nmol/L (15), whereas in dog heart, the physiologic adenosine concentration in blood plasma is 10–60 nmol/L (16,17), and plasma adenosine concentrations of around 700 nmol/L are required to significantly augment coronary blood flow (18). In the present study, 3H-adenosine with a high specific radioactivity of 925 GBq/mmol was used, which was equivalent to a dose of 4 nmol of adenosine per atrial injection. Because this amount is readily diluted with the venous return to the left atrium (duration of injection, 30 s), it is to be expected that the adenosine doses used in the present experiments were too low to affect coronary dilation or heart rate. This expectation agrees with our observation of an unchanged heart rate and unchanged coronary flow during adenosine administration.
Adenosine is known to be rapidly metabolized in heart tissue (19). In guinea pig heart, approximately 2.3 nmol of adenosine per minute and per gram are produced under well-oxygenated conditions. Estimates for dog myocardium are in the range of 0.3–1.3 nmol min−1 g−1 (8,11). In addition to a predominant intracellular site of production, adenosine is also formed in the extracellular region under well-oxygenated conditions because of the catalytic action of ecto-5′-nucleotidase. Because adenosine is metabolized quantitatively only in cytosolic regions, the combination of a certain extracellular production and a high rate of intracellular metabolism creates a concentration gradient across the cell membranes that is directed from extracellular to intracellular (20,21). Because cardiovascular tissues are rich in adenosine membrane transport proteins (22), labeled adenosine applied to the vascular system may be expected to be rapidly and effectively taken up into cellular compartments. This concept has previously been shown to be valid (8). When tracer adenosine was applied through the coronary artery of the dog heart, only a minor fraction (1%) was recovered from the coronary sinus blood under control physiologic conditions. The adenosine fraction extracted from dog blood plasma was most likely taken up into the endothelial cells, as indicated by autoradiography (9). Only a minor fraction was probably taken up by red cells, because the plasma half-life of adenosine in dog blood in vitro is around 3 min (5), which is considerably longer than the transit time of blood through the coronary circulation (approximately 10 s (23)). The missing uptake of adenosine into canine red cells may be explained by the lack of the facilitated nucleoside membrane transport in these cells (24).
Figure 2 shows that the local deposition densities of tracer microspheres and adenosine correlated tightly over a wide range of flows. Even for local myocardial flow rates as high as 12.9 mL min−1 g−1, no deviation from the overall linear relationship between the 2 deposition densities was observed. Such a tight correlation between adenosine and microsphere flow requires that the local deposition of adenosine be flow limited (i.e., the extraction of adenosine must be almost complete) and that the label be retained locally. The arguments for an almost perfect extraction of adenosine have been addressed above. The high local retention of first-pass extracted adenosine is most likely brought about by the high rate of adenosine phosphorylation in conjunction with the size of the cellular adenine nucleotide pool. The presence of EHNA did not affect the correlation between adenosine and microsphere depositions (Table 2). Thus, deamination of adenosine was not important for the tissue sequestration of adenosine. Furthermore, the action of S-adenosylhomocysteine hydrolase is unlikely to be important for cellular sequestration under our experimental conditions because no exogenous homocysteine was supplied (11,16). We therefore conclude that the extracted adenosine was quantitatively phosphorylated to adenosine monophosphate by the action of cytosolic adenosine kinase, which is largely responsible for the metabolism of cytosolic adenosine in cardiac tissues (19). Because the adenine nucleotide tissue level is around 6.5 μmol/g in canine heart (16), a cytosolic concentration of 10 mmol/L is calculated. Because the cytosolic adenosine concentration in endothelial cells and cardiomyocytes of the dog heart is in the range of 7–24 nmol/L (11), a ratio of 6.6 × 10⁵ is calculated for the distribution spaces of the adenosine and adenine nucleotide fractions. Thus, once adenosine is phosphorylated, it is not likely to leave the adenine nucleotide pool again because of the relatively large pool size.
Other molecular flow markers that have been used in the past include potassium and its analogs Rb+ and Tl+ (25,26), tracer water (27), 13N-ammonia (28), and iododesmethylimipramine (IDMI) (29). A disadvantage of potassium and its analogs is that their transport in myocardial tissue is partially barrier limited (25,26). In addition, the ratio of the extravascular volume of distribution to the intravascular volume of distribution is about 4 × 101 and, thus, much smaller than that calculated for adenosine (6.6 × 10⁵). Therefore, adenosine is a much more powerful flow marker than is potassium and its analogs, which typically exhibit limited tissue uptake with increasing flow.
Tracer water, although distributing reasonably well across myocardial tissue, lacks a mechanism for prolonged retention. It rapidly redistributes into the vascular region; hence, its tissue residue requires mathematic interpretation to allow its use for estimating local myocardial blood flow. A similar reasoning applies to ammonia, which is frequently employed in clinical studies using PET technologies (28).
Another tracer with a high extraction rate and good retention is IDMI. In this case, local sequestration is probably brought about by binding the tracer to cell surface receptors or the extracellular domain of membrane transporters (30). However, a potential problem with IDMI in blood-perfused settings is its unspecific binding to plasma proteins and cell membranes. Unspecific plasma binding may contribute to a more rapid redistribution of IDMI from the tissue to the blood compartment, as observed in blood-perfused rabbit heart and in dog heart in situ (29,30). Nonetheless, IDMI has been shown in sheep heart and rabbit heart to be a reliable marker of local myocardial blood flow over short intervals.
The tight correlation between the deposition densities of tracer adenosine and microspheres suggests that adenosine is an almost ideal marker of local blood flow in the heart. Similar to IDMI, small but systematic deviations between adenosine and the microsphere depositions may occur at very low and very high flows (Fig. 2). At low flows, the deposition density of adenosine tends to suggest higher flows than does microsphere measurement, whereas at high flows the adenosine deposition tends to suggest slightly lower flows than does the microsphere method. However, the slight imperfection might also have been introduced by the tracer microsphere method. Because microspheres are corpuscles with a certain mass, they may be expected to distribute nonideally at vessel bifurcations. The tendency of microspheres to preferentially enter higher flow paths, as well as their tendency to rather enter straighter flow paths, has previously been considered in detail (31).
The precision of a local flow estimate depends rather on the number of labeled particles or molecules per unit tissue than on the amount of radioactivity. This has been assessed in detail for the tracer microsphere technique (32,33). A theoretic number of ∼2,000 spheres in the reference sample and ∼475 spheres in tissue samples was calculated from a statistical model to measure blood flow with 10% accuracy at the 95% confidence level. Although this number is well established for tracer microspheres, the adequate number of necessary adenosine molecules remains to be determined. From the specific radioactivity of 3H-adenosine applied in our experiments and the respective tissue measurement of deposited radioactivity, an average number of 1.87 × 10¹³ tritiated molecules per myocardial sample is calculated. Thus, a significant systematic error is unlikely.
It might be argued that tracer adenosine may be a reliable flow marker over short observation periods but may fail over extended periods because of label redistribution. Because our observation period was no longer than 5 min after tracer adenosine injection, we cannot exclude the possibility of redistribution or recirculation of adenosine. However, from the above-mentioned characteristics of adenosine metabolism, in particular with respect to the rapid intracellular phosphorylation and sequestration, it appears that such potential complications are actually of quantitatively minor importance. Given the cardiac adenosine production rate and the size of the myocardial adenine nucleotide pool, approximately only 0.02% of the adenine nucleotides are converted to adenosine per minute under physiologic conditions. Furthermore, a previous study on isolated perfused guinea pig heart indicated that, after prelabeling of the adenine nucleotide pool, radioactive adenosine was released at a rate of less than 0.01% of the label per minute (7). Taken together, the present study clearly indicates not only that the deposition density of adenosine is proportional to local blood flow but that retention of adenosine is high enough to allow for a precise local flow estimate over intervals of at least several minutes. Because the tracer in our study was infused into the left atrium, we cannot exclude an extraction in other organs after systemic application. Thus, use for noninvasive perfusion imaging has to be determined in future studies.
Measurement of myocardial blood flow is of increasing interest in experimental and clinical settings. The finding that tracer adenosine is a reliable marker of local blood flow may spawn widespread future applications. If adenosine is labeled with stable isotopes, such as 17O, 18O, 15N, or 13C, or if the molecule is substituted with 19F, it could be detected by magnetic resonance tomography or mass spectroscopy. Synthesis of adenosine with a positron label, such as 11C or 18F, would allow its use for PET studies. Commonly available β-emitting radionuclides, such as 3H/14C-adenosine, have a potential for autoradiography experiments. Thus, adenosine appears to be an attractive candidate for local blood flow measurements with different in vivo and in vitro techniques.
CONCLUSION
The key finding of the present study is that tracer adenosine is a reliable marker of local blood flow in dog myocardium over a wide range of flows. First-pass extraction of adenosine is nearly complete and, thus, does not require a sophisticated mathematic-model analysis for assessment of regional blood flow. Because adenosine may be labeled with various stable isotopes or radioisotopes, it may represent a powerful tracer for local flow measurements with different techniques, such as PET, magnetic resonance tomography, or autoradiography, in in vitro and in vivo settings.
Footnotes
Received Jun. 21, 2002; revision accepted Oct. 31, 2002.
For correspondence or reprints contact: Andreas Deussen, MD, Institut für Physiologie, Medical Faculty, TU Dresden, Fetscherstrasse 7, D-01307 Dresden, Germany.
E-mail: Andreas.Deussen{at}mailbox.tu-dresden.de
REFERENCES
In this issue


Jump to section
Related Articles
Cited By...
- No citing articles found.