


Abstract
In this study, we attempted to evaluate the regional dynamic function of hepatocytes by introducing unique parameters in 99mTc-diethylenetriaminepentaacetic acid-galactosyl-human serum albumin 99mTc-GSA) scintigraphy. 99mTc-GSA scintigraphy provides valuable information for the receptor population density. However, the conventional indices are the results of the analyses of 2 fixed points and, as a result, it is not possible to accurately estimate the regional dynamic function. Methods: We performed 99mTc-GSA scintigraphy 100 times on a total of 54 pediatric patients. The average age at examination was 7.4 ± 5.8 y. Ninety-one of the 100 scintigraphy cases were available for this study. We converted the time-activity curve for the liver of 99mTc-GSA to a horizontal mirror image curve, and, on the basis of the height-over-area method, calculated the mean transit time (MTT) in each pixel and depicted the functional image as unique parameters, which were thus compared with the conventional indices. For these parameters, we used the time-activity curve for only the liver. Results: The whole liver MTT showed a significant correlation with both the clearance (y = 590.3x + 10.3; r = 0.51; P < 0.0001) and the receptor (y = −1,836.2x + 2,038.8; r = −0.66; P < 0.0001) indices. On the basis of the MTT in each pixel, we could depict the functional image of the liver. In actual clinical situations, the functional image was quite useful for making a visual evaluation of the dynamic distribution of 99mTc-GSA. The functional image indicated that, even at an extremely early stage of biliary atresia, the hepatic functional reserve might be exacerbated earlier in the right lobe than in the left lobe. Conclusion: The MTT and the functional image enable us to elucidate the regional dynamic function of hepatocytes both quantitatively and visually. In addition, this diagnostic modality can be used at virtually all medical institutions using a modified analytic program already in public use.
- asialoglycoprotein receptor scintigraphy
- mean transit time
- dynamic function
- hepatic functional reserve
- height-over-area method
An accurate assessment of hepatic function is important in liver diseases even in children. Various parameters have been reported to evaluate the hepatic functional reserve (1–3). Recently, the usefulness of 99mTc-diethylenetriaminepentaacetic acid-galactosyl-human serum albumin (99mTc-GSA) scintigraphy has also been reported for estimating the hepatic functional reserve. 99mTc-GSA is a receptor-binding agent specific for the asialoglycoprotein (ASGP) receptor that resides exclusively on the plasma membrane of hepatocytes. It provides valuable information for the receptor population density and thus it directly reflects the total mass of the functioning hepatocytes (2,4,5).
However, 99mTc-GSA scintigraphy is a recently developed examination and has not yet been fully accepted in the field. The conventional indices in 99mTc-GSA scintigraphy, including both clearance and receptor indices (6), are the results of analyses of 2 fixed points and thus may be susceptible to extrahepatic blood pools. Moreover, the conventional indices can represent the total mass of functioning hepatocytes but may not be able to accurately estimate the regional dynamic function. In this study, we attempted to evaluate the dynamic function of hepatocytes using the height-over-area method (7) and thus estimated its potential to assess the regional dynamic function.
MATERIALS AND METHODS
Patients
We performed 100 consecutive 99mTc-GSA scintigraphies on 54 pediatric patients from October 1992 to December 1999. The patients consisted of 23 boys and 31 girls, including 31 patients with biliary atresia, 5 with neonatal hepatitis, 5 with Wilson’s disease, 4 with other metabolic diseases, 3 with neuroblastoma, 2 with hepatic fibrosis, 1 with Alagille syndrome, and 3 with other liver-associated disorders. The average age at examination was 7.4 ± 5.8 y (age range, 19 d to 22 y). Sixteen of the 54 patients underwent a living-related partial liver transplantation for irreversible hepatic disorders. Ninety-one of the 100 99mTc-GSA scintigraphies were available for analysis in this study.
99mTc-GSA Scintigraphy
The 185 MBq 99mTc plus 3 mg GSA were injected intravenously, and dynamic images were recorded with the patient supine under a gamma camera with a large field of view and a low-energy multipurpose collimator with parallel holes centered on the liver and the precordium. The dose was decreased by one half for children <10 y old. For the gamma camera, we used a ZLC-3500 (Shimazu Corp., Kyoto, Japan) until September 1997 and changed to a PRISM 2000 (Picker International, Cleveland, OH) from October 1997. Computer acquisition of the gamma-camera data was started just before the bolus injection of 99mTc-GSA and then was stopped 40 min later. Digital images (128 × 128 pixels) were acquired at a rate of 30 s per frame. The static-accumulation images in the 4 directional views were obtained after the acquisition of the data. The time-activity curves for the heart and liver were generated from the regions of interest (ROIs) for the heart and liver. Except for the long acquisition time, these methods are the same as conventional methods.
Calculation of Conventional Indices
The index of blood clearance was calculated by dividing the radioactivity of the heart ROI at 15 min after the injection by that of the heart ROI at 3 min. A receptor index was calculated by dividing the radioactivity of the liver ROI by that of the liver-plus-heart ROIs at 15 min after the injection (6).
Mean Transit Time and Functional Image
We developed unique parameters, the mean transit time (MTT) and the functional image, in 99mTc-GSA scintigraphy. For these parameters, we made use of the time-activity curve for only the liver; the time-activity curve for the heart was unnecessary. For this purpose, at least 20–30 min were needed to acquire the data because the peak value of the count (Npeak) is indispensable for the calculations. In each pixel, we converted the time-activity curve to a horizontal mirror image curve, which was displayed as a decay curve {f(t) = Npeak − TAC(t), where TAC = time-activity curve}. On the height-over-area method, the ratio of the Npeak counting rate to the sum of the counts obtained during decay was automatically computed (Fig. 1). On the basis of the MTT in each pixel, we were thus able to obtain the MTT values in arbitrary ROIs and depict the functional image of the liver. In the functional image, the color scale was made proportional to the magnitude of 1/MTT in each pixel, which indicated that the magnitude of 1/MTT is bigger, and the dynamic function is better.
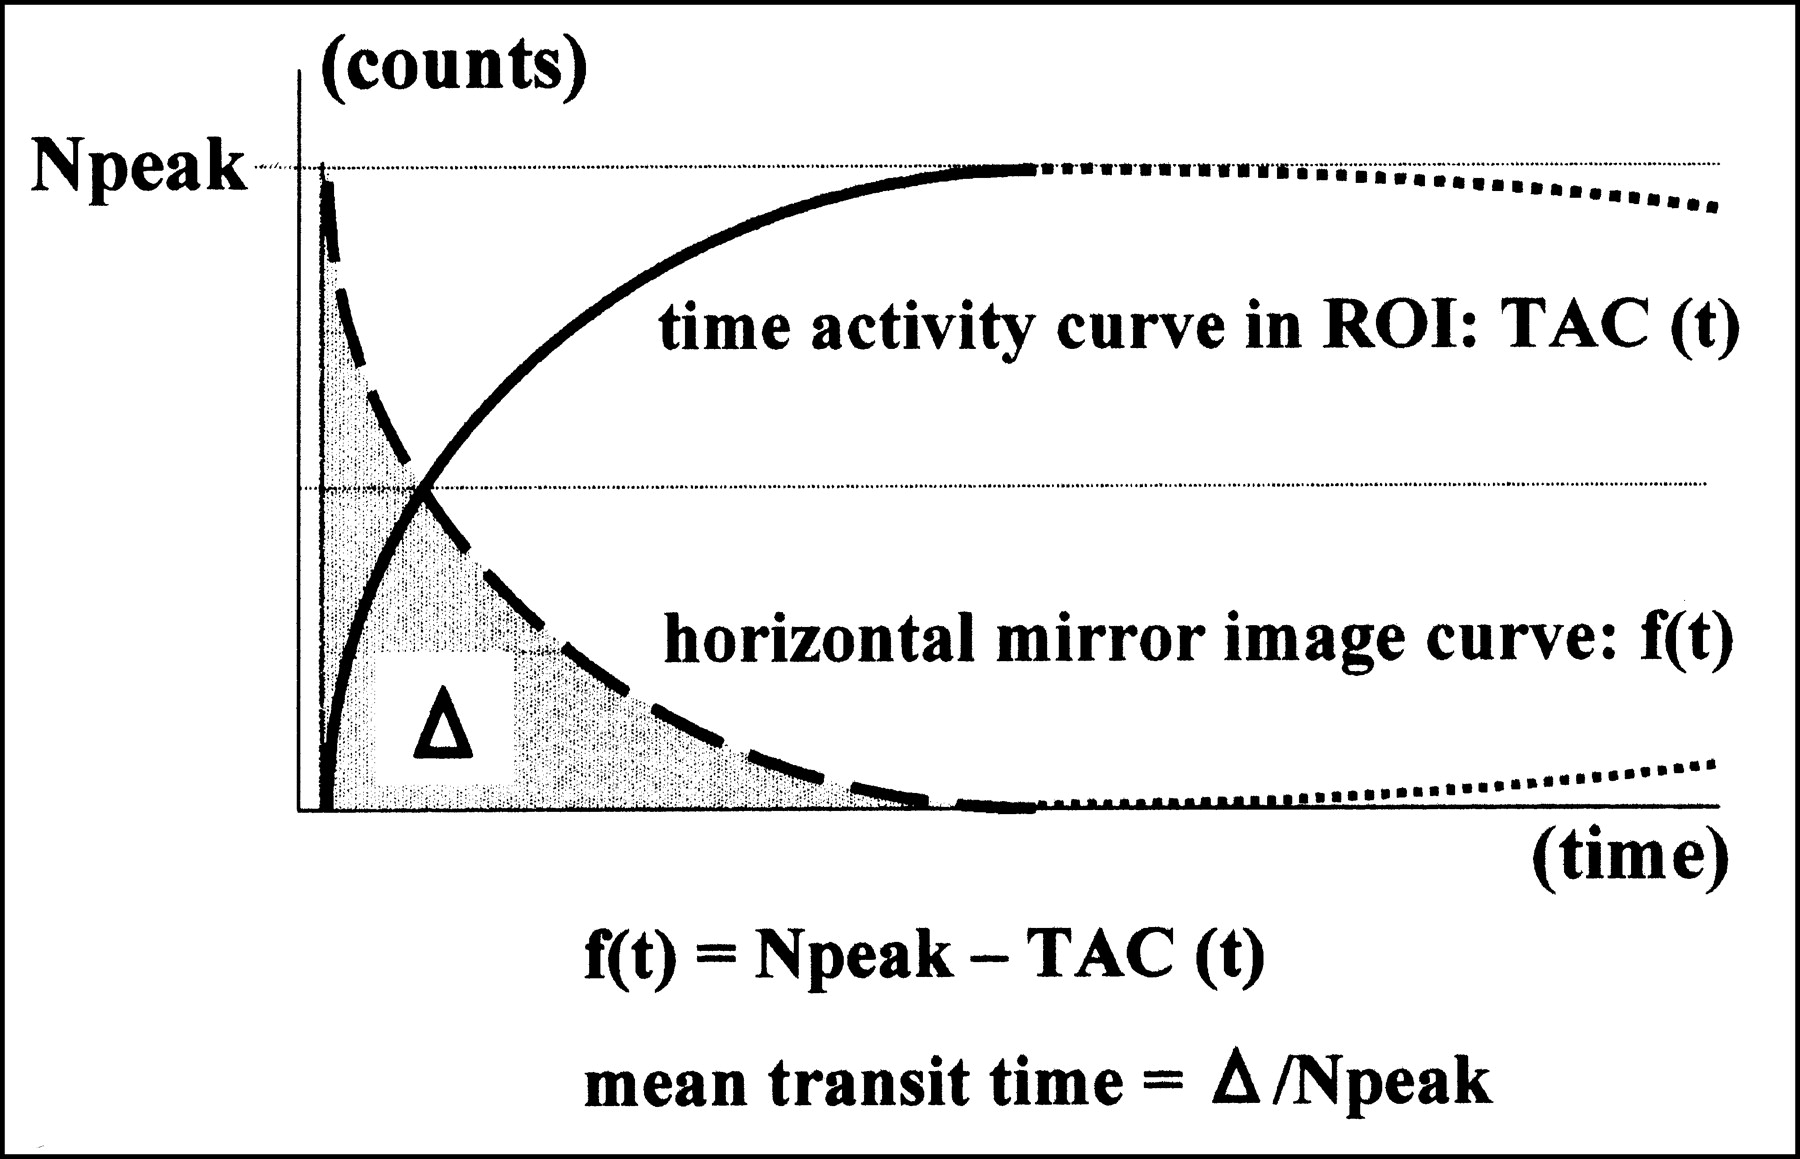
Principle behind calculating mean transit time. TAC = time-activity curve.
Statistical Analysis
All data are presented as the mean ± SD. A statistical analysis was performed using the Student t test and a regression analysis. P < 0.05 was considered to be statistically significant.
RESULTS
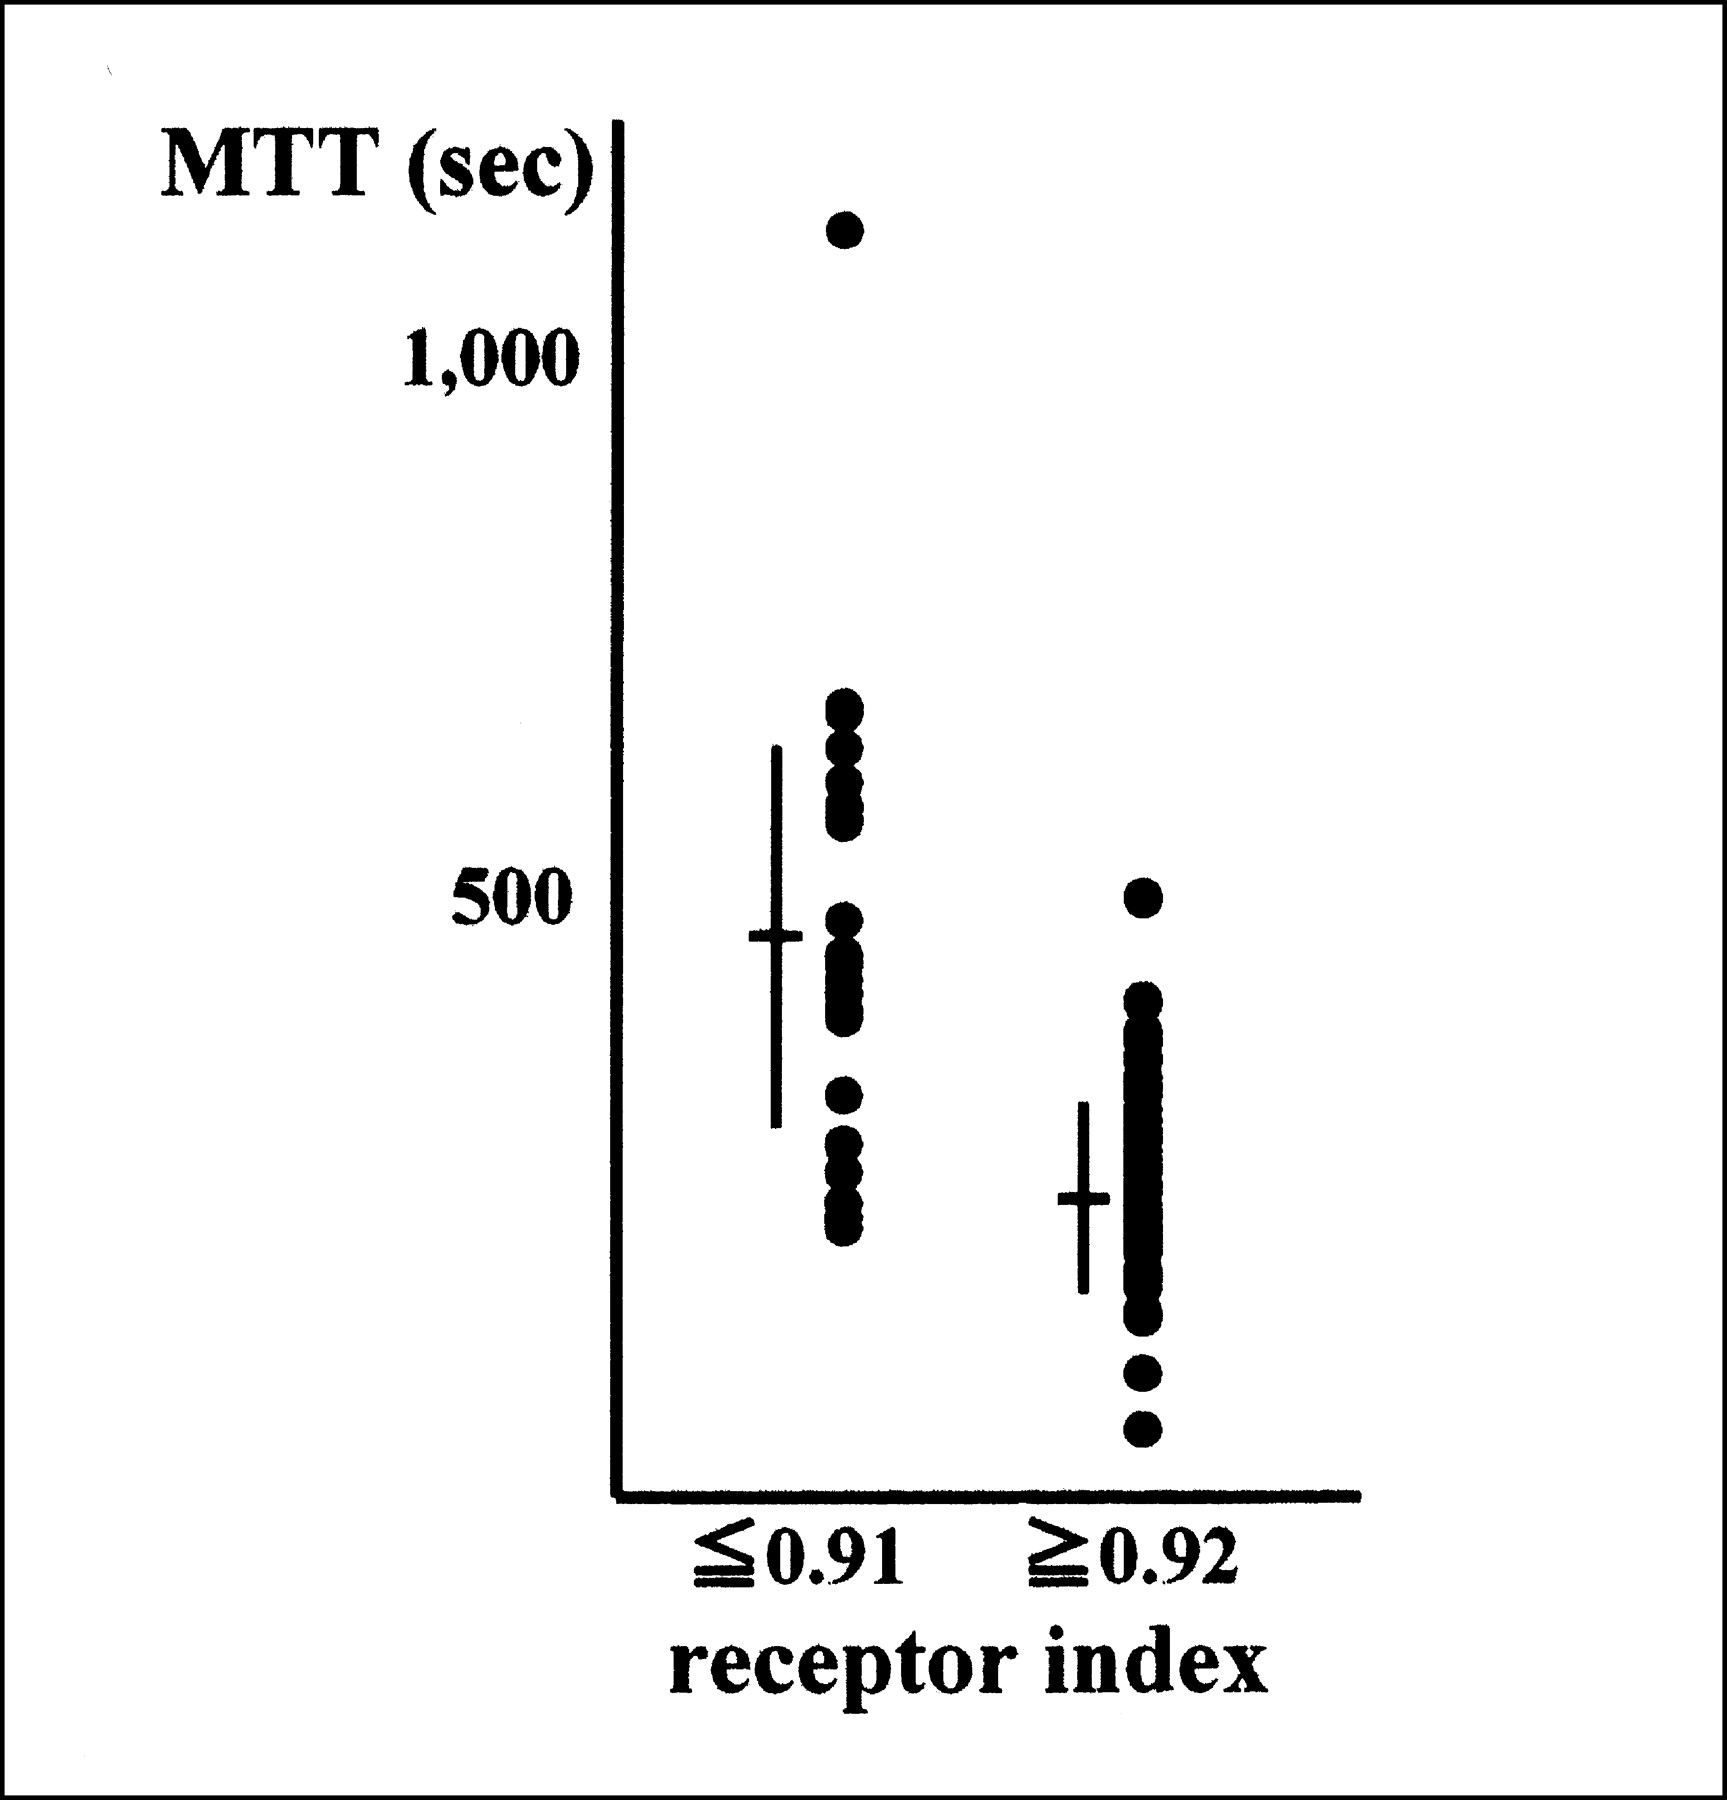
The whole liver MTT, indicating the mean value of the MTTs in the liver ROI, was compared with the conventional 99mTc-GSA indices. There was also a significant correlation between the whole liver MTT and the clearance index: y = 590.3x + 10.3; r = 0.51; P < 0.0001 (Fig. 2). In addition, the whole liver MTT was negatively correlated with the receptor index: y = −1,836.2x + 2,038.8; r = −0.66; P < 0.0001 (Fig. 3). Furthermore, the patients were divided into 2 groups: a group with a receptor index of ≦0.91 (n = 25) and another group with a receptor index of ≧0.92 (n = 66). The values of the whole liver MTT were compared between the 2 groups. The mean MTT in the latter group, which seems to have a normal hepatic functional reserve, was 273.3 ± 87.2 s and the mean MTT in the former group was 490.4 ± 183.4 s (Fig. 4). There was also a significant difference between the 2 groups (P < 0.0001).

Correlation between MTT and clearance index.
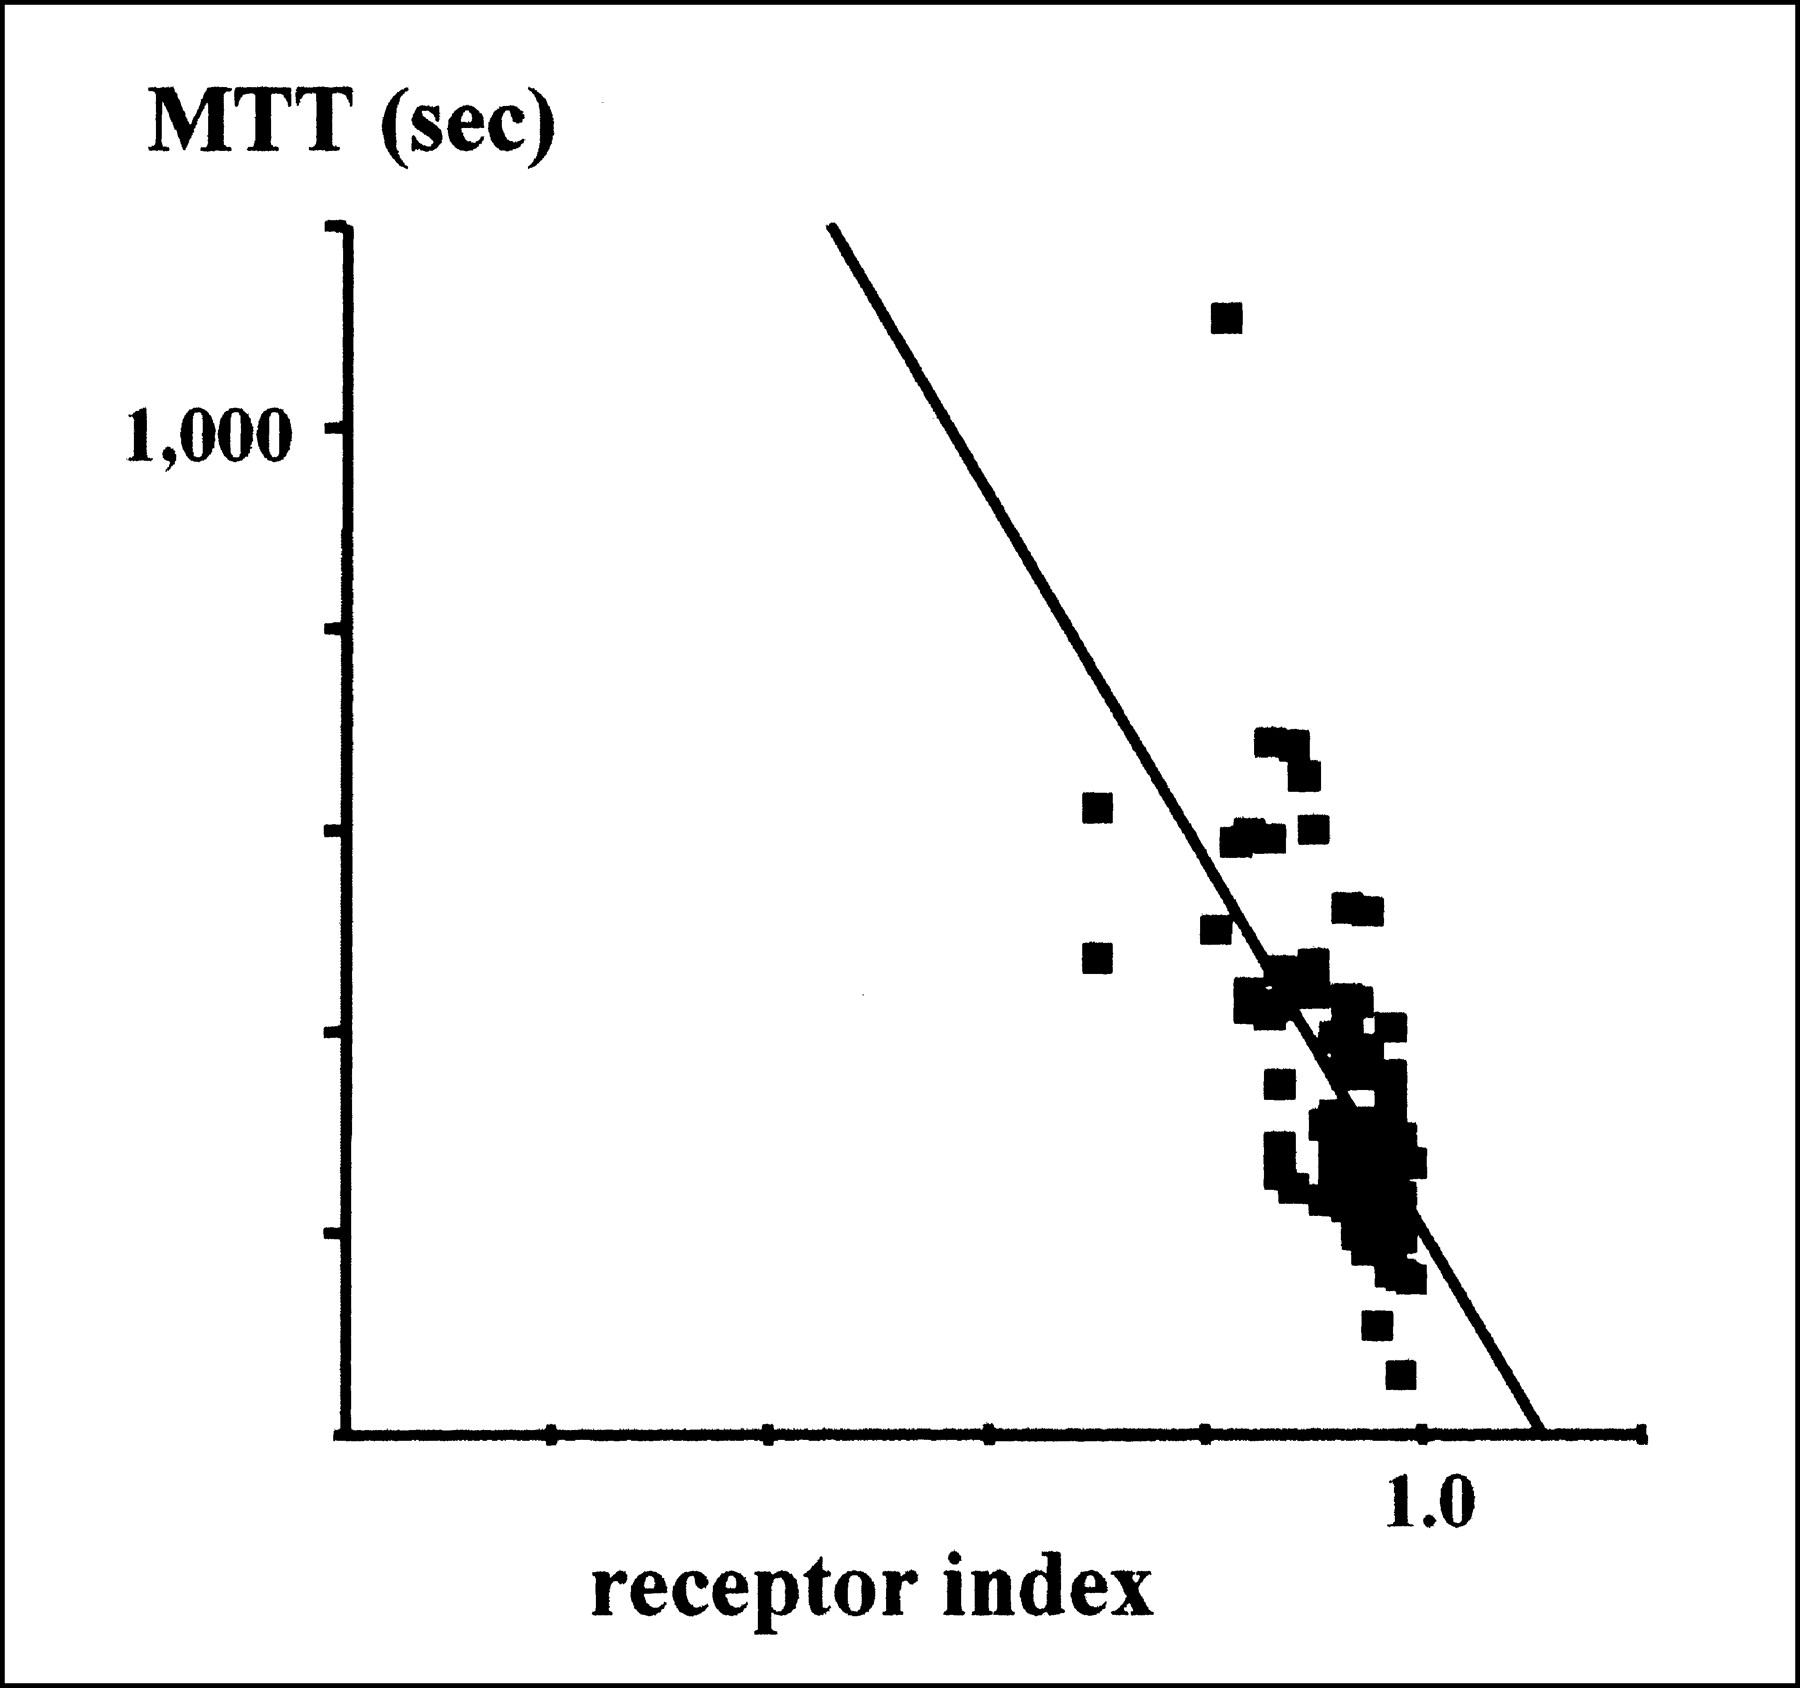
Correlation between MTT and receptor index.

Patients were divided into 2 groups on basis of receptor index value. Mean MTT ± SD is indicated for each group.
On the basis of the MTT in each pixel, we could depict the functional image of the liver, described above. It was quite obvious that we can visually appreciate the abnormalities in the regional dynamic function of the liver on the functional image. Figure 5 shows 99mTc-GSA images of a 2-mo-old boy with almost a normal hepatic functional reserve. According to the 99mTc-GSA scintigraphy findings, the clearance index was 0.32, the receptor index was 0.98, and the MTT was 155.7 s. The conventional 99mTc-GSAimage in Figure 5B, which is highly influenced by the thickness of the liver parenchyma, shows that the accumulation of isotope is concentric, so that the hepatic functional reserve cannot be expressed visually. On the other hand, Figure 5C shows a functional image on which we can realize that good dynamic function of the hepatocytes was homogeneously maintained in the whole liver.

A 2-mo-old boy with high level of serum bile acid of unknown etiology: Serum bilirubin level was 1.2 mg/dL (range, 0.3–1.5 mg/dL), whereas alanine transaminase level was 43 IU/L (range, 13–33 IU/L) and aspartate transaminase level was 40 IU/L (range, 8–42 IU/L). (A) Original time–activity curve for whole liver (blue curve) and horizontal mirror image curve of time-activity curve (white curve). (B) Conventional 99mTc-GSA image. (C) Functional image obtained at same time as image in B.
Figure 6 shows the serial follow-up functional images of a 19-d-old boy with biliary atresia. His hepatic functional reserve seemed to be almost normal on the first medical examination: The clearance index was 0.32, the receptor index was 0.97, and the MTT was 270.8 s. However, even at such an extremely early stage, the functional image indicates an exacerbated dynamic function of the right hepatic lobe (Fig. 6A). At 5 mo after the Kasai operation, 99mTc-GSA scintigraphy shows deterioration in the hepatic functional reserve: The clearance index was 0.67, the receptor index was 0.88, and the MTT was 448.4 s. The functional image shows the pattern of liver cirrhosis and a diffuse exacerbation of the dynamic function (Fig. 6B). Figure 6C shows the functional image in 99mTc-GSA scintigraphy 5 y after the living-related partial liver transplantation. It shows good homogeneous dynamic function of the hepatocytes: The clearance index was 0.56, the receptor index was 0.96, and the MTT was 224.3 s.
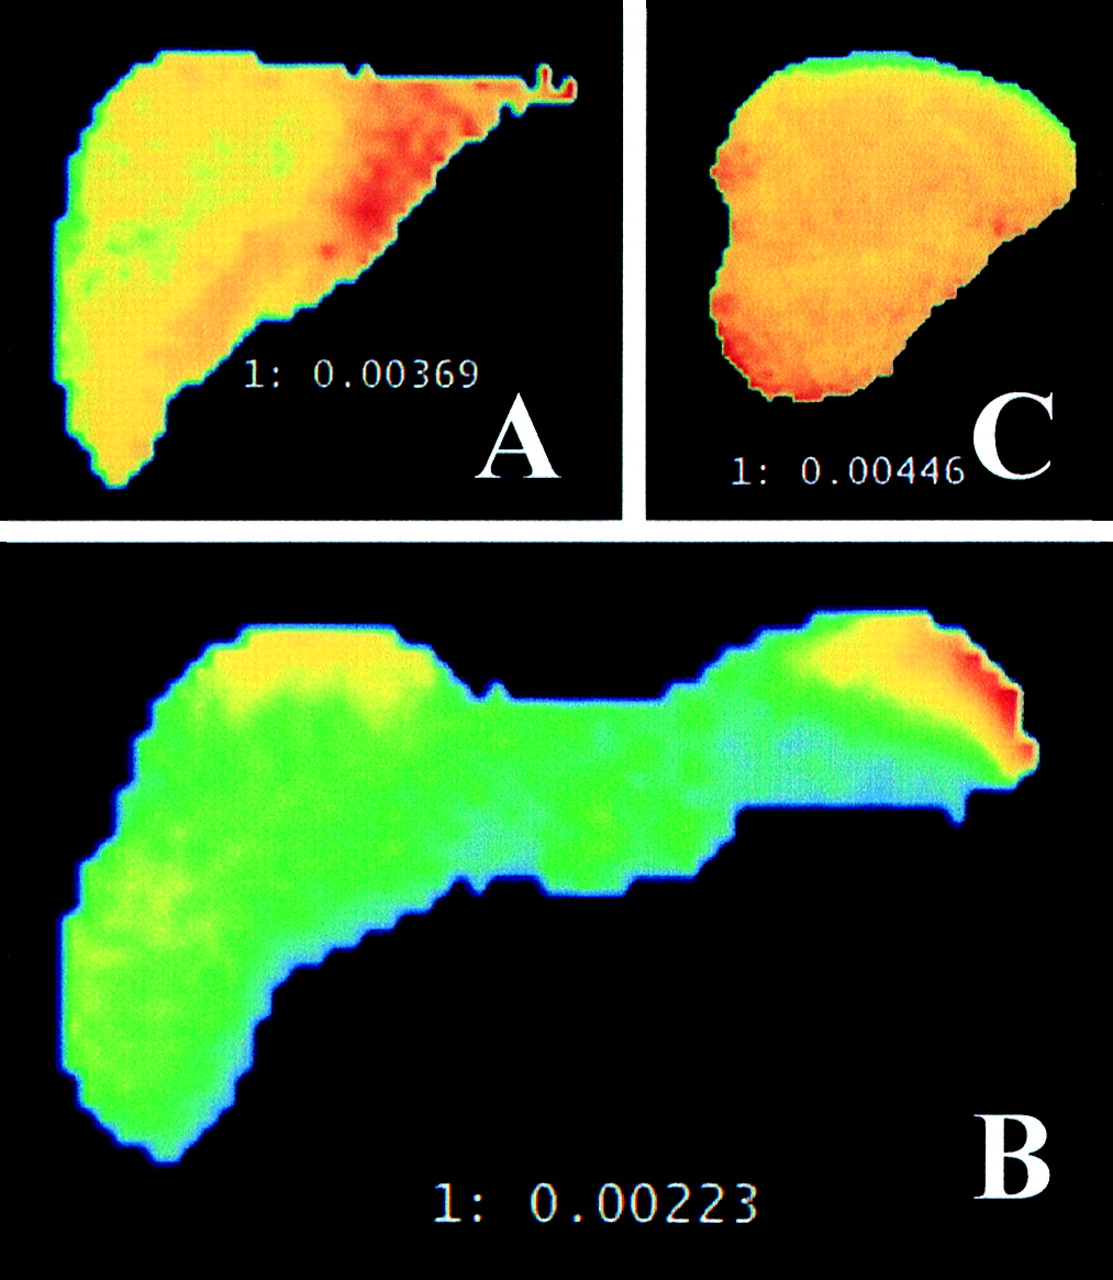
A 19-d-old boy with biliary atresia. Serum bilirubin level was 9.8 mg/dL, alanine transaminase level was 66 IU/L, and aspartate transaminase level was 30 IU/L. (A) Functional image at 19 d old shows exacerbated dynamic function of right hepatic lobe. Warm colors indicate good MTT and cold colors indicate poor MTT. (B) Functional image at 6 mo old and 5 mo after the Kasai operation. Serum bilirubin level was 6.3 mg/dL, alanine transaminase level was 372 IU/L, and aspartate transaminase level was 212 IU/L. (C) Functional image at 6 y old and 5 y after living-related partial liver transplantation. Hepatic functions were all within normal range.
DISCUSSION
99mTc-GSA is one of the radiolabeled ASGP ligands originally developed by Vera et al. (8), and 99mTc-GSA scintigraphy was developed for clinical use and is now commercially available in Japan (5,9). This ligand is bound only by the ASGP receptor in the liver without nonspecific binding to the receptor, and the receptor-ligand reaction is nonlinear (10). 99mTc-GSA scintigraphy is thus able to demonstrate a functioning hepatocyte mass. Moreover, ASGP receptors do not bind to bilirubin and, as a result, an increased serum bilirubin level does not negatively influence 99mTc-GSA scintigraphy (11). Even in patients with obstructive jaundice, 99mTc-GSA scintigraphy might be highly useful for accurately estimating a functioning hepatocyte mass.
On the other hand, because 99mTc-GSA scintigraphy is a recently developed examination and has not yet been fully accepted, it may have some shortcomings as well. For example, planar 99mTc-GSA scintigraphy is an examination of the total number of functioning hepatocytes of the whole liver and thus it is not able to accurately estimate the regional dynamic functional reserve (12). The conventional indices in 99mTc-GSA scintigraphy represent not a dynamic but a relatively static function of the hepatocytes calculated by observation of 2 fixed points, usually 3 and 15 min after injection. The calculation of these indices, including both clearance and receptor indices, requires the value of the cardiac time-activity curve, which may be susceptible to extrahepatic situations. For example, influences on the indices, such as the cardiac blood pool in congestive heart diseases, the splenic blood pool in hypersplenism, and the hepatic blood flow itself, may not be negligible (13,14). Moreover, the receptor index is one of the indicators of hepatic uptake, whereas its denominator (the radioactivity of the liver-plus-heart ROIs) is not equivalent to the total injected dose of 99mTc-GSA. Therefore, the value of the receptor index does not correspond to the actual uptake of 99mTc-GSA in the liver (6). In addition, the values of the receptor index in the normal state and in the pathologic state are close to each other in actual clinical situations (6).
Several researchers have come up with various ideas to make 99mTc-GSA scintigraphy more valuable to use. Itano et al. (13) created a grading score from the difference in the isotope uptake patterns between the liver and the heart. They concluded that the grading score rather than the receptor index reflects the actual damage due to alcoholic hepatitis because the former reflects a decreased liver flow. Using dynamic SPECT, they pointed out the presence of a heterogeneous accumulation pattern of 99mTc-GSA; however, they did not mention the quantitative analysis of the regional function. Ichihara et al. (14), using the Rutland method and SPECT with scatter and attenuation compensation, determined the overall and regional effective blood flow and hepatic blood pool volume as hepatic functional parameters. They thus concluded that the overall and regional effective hepatic blood flow is useful for evaluating the hepatic functional reserve. However, their method is not appropriate for general use because it requires a custom-made phantom and complicated calculations. Kira et al. (15) calculated the regional receptor index and the regional uptake constant index derived from dynamic SPECT. They stated that both were useful for evaluating the regional hepatic reserve; however, their method requires complicated calculations using radioactivity of the heart ROI. Sakahara et al. (12) performed 99mTc-GSA scintigraphy on patients who had undergone auxiliary partial orthotopic liver transplantation (APOLT). They examined the uptake rates from the blood to the graft and to the native liver separately using a Patlak plot graphical analysis. They thus concluded that the relative uptake of GSA was a better indicator of the graft liver function than the anatomic volume, although their method was limited only to the APOLT patients. We believe that these new analyses using 99mTc-GSA scintigraphy are valuable; however, not all analyses may be consistent because of the reasons described.
In this study, we evaluated the potential of 99mTc-GSA scintigraphy both to assess the dynamic function of hepatocytes and to be used as a valuable adjunct to estimate the regional function of the liver. We developed a new method for the MTT and functional imaging in 99mTc-GSA scintigraphy. The usefulness of the principle in these examinations has already been established using dynamic pulmonary 133Xe gas washout ventilation scintigraphy. Pulmonary washout scintigraphy is widely used to detect regional changes of ventilation in both large and small airways. In this dynamic scintigraphy modality, using the height-over-area method, the MTT value is calculated from the ratio of the equilibrium counting rate to the sum of the counts obtained from the washout curve (7). In pulmonary scintigraphy, both the MTT and its image detail the distribution of heterogeneous gas washout in patients with abnormalities. However, in 99mTc-GSA scintigraphy, the time-activity curve for the liver is a cumulatively increasing nonlinear curve, and therefore it is inadequate for MTT calculations. We hypothesized that the washout abnormalities in a pulmonary ventilation study and the accumulation abnormalities in 99mTc-GSA scintigraphy were found to be a symmetric phenomenon physiologically. Therefore, we dealt with a horizontal mirror image curve of the time-activity curve for the liver in each pixel, which was displayed as a decay curve, as an analog of the washout curve in a ventilation study. On the basis of the height-over-area method, the MTT value in each pixel was calculated using the same method as that used in a pulmonary ventilation study.
We found that, in our patient with biliary atresia, even in at extremely early stage of the disease, the MTT was exacerbated in the right lobe on the functional image. This new finding is particularly curious and indicates that the hepatic functional reserve in patients with chronic liver disease is exacerbated earlier in the right lobe than in the left lobe. Matsuzaki et al. (9) studied the hepatic functional reserve in the lobes of the liver with chronic liver disease using SPECT imaging with 99mTc-GSA. In the same way, they stated that, with progression of hepatic functional degeneration, the left-lobe to right-lobe ratio of counts per unit hepatic volume increased significantly.
The main advantage in our new modality is that it is based on the dynamic functional assessment in each pixel using the height-over-area method, calculated only by the time-activity curve of the liver. The influence of the extrahepatic blood pool is thus completely excluded, and any influences by the intrahepatic blood flow and the thickness of the hepatic parenchyma can also be ruled out. Attenuation correction is also unnecessary. The functional image, which is expressed by mapping of the MTT in each pixel, is also useful for depicting the heterogeneous distribution of 99mTc-GSA, which makes a virtual recognition of the heterogeneity easy to obtain. If necessary, we can set arbitrary ROIs in the liver so that it is easy to compare the dynamic function of the hepatocytes between the parts inside the liver.
CONCLUSION
We consider this modality to be a valuable adjunct to the study of the local or heterogeneous dysfunction of the liver because it is easy to determine the dynamic regional function of hepatocytes using a modified analytic program already in use for pulmonary scintigraphy. Previous raw data may be available and additional examinations are thus unnecessary, and this diagnostic modality can be used at virtually all medical institutions. Compared with conventional studies, including the clearance and receptor indices, this modality seems to be spatially superior and more sensitive for the detection of accumulation abnormalities.
Footnotes
Received Oct. 22, 2001; revision accepted Jul. 5, 2002.
For correspondence or reprints contact: Yasuharu Ohno, MD, Department of Surgery II, Nagasaki University School of Medicine, 1-7-1 Sakamoto, Nagasaki 852-8501, Japan.
E-mail: y-ohno{at}net.nagasaki-u.ac.jp


