


Abstract
Nontraumatic osteonecrosis of the femoral head (ONF) is a complication of renal transplantation. The pathogenic mechanism of ONF is thought to be an ischemic event. The purpose of this study was to investigate whether 3-phase bone scintigraphy can reveal early hemodynamic changes associated with ONF after renal transplantation. Methods: We performed 3-phase bone scintigraphy on 19 renal allograft recipients between 3 and 9 wk after they underwent renal transplantation. Regions of interest (ROI) were assigned bilaterally in the femoral heads, diaphyses, and soft tissue. The head-to-diaphysis ratio (HD) in each phase was then calculated. Results: ONF occurred in 8 femoral heads of 4 patients. Three of the 4 ONF patients had no abnormal MRI findings at the time of bone scintigraphy. In phase 1, no significant difference in HDs was observed between the ONF patients (mean HD ± SD, 0.62 ± 0.44) and the non-ONF patients (0.31 ± 1.40). The difference between the mean counts for bone and soft tissue was small in both instances, and the HD had a large dispersion. In phase 2, the HDs for the ONF patients (0.70 ± 0.27) and the non-ONF patients (1.31 ± 0.43) were significantly different (P = 0.0005). The HD was <1.00 in all femoral heads of the ONF patients, whereas 9 non-ONF heads had an HD that was <1.00. In phase 3, the HD of the ONF patients was significantly lower than that of the non-ONF patients (ONF patients, 0.92 ± 0.17; non-ONF patients, 1.62 ± 0.46; P = 0.0002). Conclusion: All ONF patients were in the group with a low HD in phase 2, suggesting a reduction in blood flow or blood pool. Phase 2 accumulation in 3-phase bone scintigraphy can be used to estimate early hemodynamic changes in patients with ONF after renal transplantation.
Nontraumatic osteonecrosis of the femoral head (ONF) is a major musculoskeletal complication of renal transplantation (1). MRI is a useful tool for early detection of ONF (2–4), but ONF findings on MRI represent a tissue reaction after necrosis has already begun (4). The pathogenesis of ONF has not been fully described, but the complication is thought to arise from an ischemic event (2,5). Therefore, to investigate the initial tissue changes that occur in ONF, one needs a method that shows hemodynamic changes. Because accumulation during the early phase of 3-phase bone scintigraphy depends mainly on blood flow and blood pool (6–8), 3-phase bone scintigraphy may be more sensitive to initial tissue changes after renal transplantation than is MRI. In addition, the technique may reveal the relationship between the occurrence of ONF and hemodynamic changes in the femoral head. In this study, we estimated femoral head accumulation using 3-phase bone scintigraphy after renal transplantation.
MATERIALS AND METHODS
We performed 3-phase bone scintigraphy on 19 renal allograft recipients (16 men, 3 women; age range, 20–64 y; mean age ± SD, 35.9 ± 10.8 y). After the renal transplantation, all patients received the same immunosuppressive therapy: corticosteroids, cyclosporin-A, and azathioprine. At the time of the transplantation, 500 mg methylprednisolone were administered. Prednisolone was started at a dose of 50 mg on the day of surgery; thereafter, the dose was decreased by 10 mg every 10 d. After the second month, the dosage was maintained at 15–20 mg/d. We performed 3-phase bone scintigraphy between 3 and 9 wk after the renal transplantations and, using MRI, monitored the patients for at least 4 mo after surgery. In each MR examination, we obtained T1- and T2-weighted images using spin-echo technique.
After a bolus intravenous injection of 740 MBq 99mTc-hydroxymethylene diphosphonate (Nihon Mediphysics, Nishinomiya, Japan), we obtained serial dynamic planar images for 25 min (30 frames at a rate of 1 every 10 s and 4 frames at a rate of 1 every 5 min) and a bone scintigram at 3 h after the injection using a GCA901A gamma camera (Toshiba, Nasu, Japan). The summed image of the first 6 frames was defined as phase 1, the image at 15–20 min as phase 2, and the bone scintigram as phase 3. We assigned square regions of interest (ROI) bilaterally in the femoral heads, diaphyses, and soft tissue (Fig. 1). The femoral head ROI (4 × 3 pixels) was set at the upper part of the head (just below the articular surface of the hip joint), the diaphysis ROI (5 × 8 pixels) was set in the center of the diaphysis at the lesser trochanter level, and the soft-tissue ROI (7 × 7 pixels) was set on the lateral side of the right iliac bone. Mean counts for each ROI were obtained, and the head-to-diaphysis ratio (HD) for the right and left femoral bones was calculated for each phase as follows: HD = (mean head count − mean soft-tissue count)/(mean diaphysis count − mean soft-tissue count).

ROIs in right and left femoral heads, diaphyses, and soft tissue. Femoral head ROI was set at upper part of head (just below articulator surface of hip joint), diaphysis ROI was set in center of diaphysis at lesser trochanter level, and soft-tissue ROI was set on lateral side of right iliac bone. 2 = right femoral head; 3 = left diaphysis; 4 = right diaphysis; 5 = soft tissue.
The t test was used to compare the HDs for ONF and non-ONF patients, and P < 0.05 was considered to be statistically significant. To estimate the reproducibility of the HD, we also calculated interobserver and intraobserver correlations for the HDs. Two observers independently performed all the steps required to obtain the HDs for 10 patients, and 1 of the 2 observers repeated the process.
RESULTS
The HDs and MRI findings for all patients are shown in Table 1. ONF occurred in 8 femoral heads of 4 patients. Three of 4 ONF patients had no abnormal MRI findings at the time of bone scintigraphy.
HDs and MRI Findings for All Patients
In phase 1, no significant difference in HDs between the ONF patients (0.62 ± 0.44) and the non-ONF patients (0.31 ± 1.40) was observed (Fig. 2). The difference between the mean counts for bone and soft tissue was small in both instances, and the HD was widely dispersed. In phase 2, the difference in HDs between ONF patients (0.70 ± 0.27) and non-ONF patients (1.31 ± 0.43) was significant (P = 0.0005) (Fig. 3). The HDs for all femoral heads in the ONF patients were <1.00, whereas some non-ONF patients (9 femoral heads in 7 patients) had an HD that was <1.00. In phase 3, the HDs for the ONF patients and the non-ONF patients were significantly different (ONF patients, 0.92 ± 0.17; non-ONF patients, 1.62 ± 0.46; P = 0.0002), and the HDs for the ONF patients were lower than those of any non-ONF patients (Fig. 4).

Comparison of phase 1 HDs between ONF patients and non-ONF patients.

Comparison of phase 2 HDs between ONF patients and non-ONF patients.

Comparison of phase 3 HDs between ONF patients and non-ONF patients.
Interobserver correlation coefficients for the HDs were 0.34 in phase 1, 0.94 in phase 2, and 0.96 in phase 3. Intraobserver correlation coefficients for the HDs were 0.54 in phase 1, 0.93 in phase 2, and 0.99 in phase 3.
Patient 1 is shown in Figure 5 as an example of a non-ONF patient. MRI performed 9, 16, and 24 wk after the renal transplantation revealed no abnormal findings. Three-phase bone scintigraphy was performed 9 wk after the renal transplantation. In phase 1, the accumulation of tracer in the femoral head and diaphysis was as low as that in the soft tissue. In phases 2 and 3, the femoral head had accumulation equal to or more visible than that in the diaphysis. The HD was relatively high in phases 2 and 3.

Example of non-ONF patient (patient 1). Three-phase bone scintigraphy was performed 9 wk after renal transplantation. In phase 1 (A), accumulation of tracer in femoral head and diaphysis is as low as that in soft tissue. In phases 2 (B) and 3 (C), femoral head has accumulation equal to or more visible than that in diaphysis (arrows). HD was relatively high in phases 2 (left, 1.77; right, 1.95) and 3 (left, 1.73; right, 2.33).
Patient 19 is shown in Figure 6 as an example of an ONF patient. Three-phase bone scintigraphy was performed 7 wk after the renal transplantation. In phase 1, the accumulation of tracer in the femoral head and diaphysis was as low as that in the soft tissue. In phases 2 and 3, the upper part of the femoral head had less visible accumulation than did the diaphysis. Compared with the non-ONF patients, this patient had a lower HD in phases 2 and 3. MRI performed 8 wk after the renal transplantation showed no abnormal findings, but MRI performed 19 wk after the transplantation showed typical ONF findings.
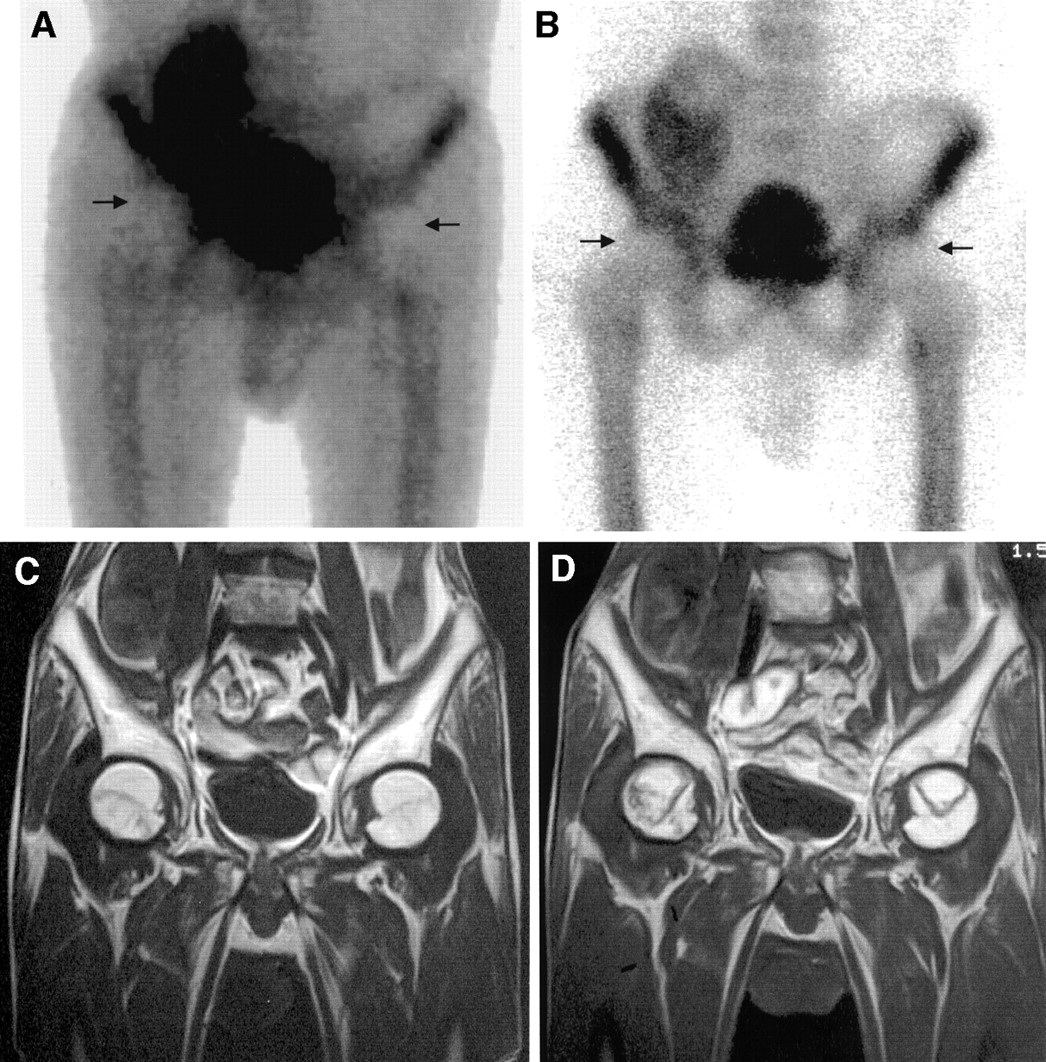
Example of ONF patient (patient 19). Three-phase bone scintigraphy was performed 7 wk after renal transplantation. In phases 2 (A) and 3 (B), accumulation is less visible in upper part of femoral head than in diaphysis (arrows). HDs were 0.54 (left) and 0.48 (right) in phase 2 and 1.05 (left) and 0.97 (right) in phase 3. Compared with non-ONF patients, lower HD was observed in phases 2 and 3. T1-weighted MR images showed no abnormal findings 8 wk after renal transplantation (C) but typical ONF findings 19 wk after transplantation (D).
DISCUSSION
In this study, the HDs for the ONF patients were significantly lower than those for the non-ONF patients in phases 2 and 3, whereas no significant difference in the HDs between the ONF patients and the non-ONF patients was observed in phase 1. The HDs for the ONF patients were lower than those of any non-ONF patients in phase 3, but in phase 2 not only ONF patients but some non-ONF patients had HDs <1.00, suggesting that phase 2 accumulation may change after renal transplantation.
MRI is thought to be the most useful tool for early detection of ONF. Initial abnormal signs on MR images consist of a narrow low-intensity band on T1-weighted images and a high-intensity band on T2-weighted images. These bands are believed to represent the reactive interface between necrotic and viable bone. The pathogenesis of ONF has not been fully described, but the condition is thought to arise from an ischemic event. Therefore, to investigate the initial tissue changes that occur in ONF, one needs a method that shows hemodynamic changes. 99mTc-labeled diphosphonate crosses the endothelium of capillaries by passive diffusion and adheres to the surface of bone minerals (7). During the early phase of 3-phase bone scintigraphy, the accumulation of this tracer reflects mainly blood flow and blood pool. Thus, 3-phase bone scintigraphy is a useful tool for estimating hemodynamic changes in bone (9,10) and perhaps also for investigating the relationship between the occurrence of ONF and hemodynamic changes in the femoral head.
In this investigation, we used HDs to estimate accumulation in the femoral head. In the early phase of bone scintigraphy, a relatively high accumulation in soft tissue and low accumulation in bone is often observed, especially in patients with renal hypofunction; therefore, objective estimation of bone uptake by visual assessment is difficult. Some quantitative method is needed for objective analysis. Such a method is HD, which is both objective and convenient.
In a previous study, abnormal MRI findings in ONF patients were first seen between 6 and 16 wk after renal transplantation (mean, 10 wk) (11). On this basis, we performed bone scintigraphy before the 10th postoperative week (between 3 and 9 wk) on all study participants.
The abnormal intensity band that indicates ONF on MR images is believed to represent a reactive interface between necrotic and viable bone. The femoral head ROI was therefore assigned in the upper part of the head to investigate accumulation in a necrotic area. The diaphysis ROI was set at the level of the lesser trochanter because bone thickness in this region and in the femoral head is approximately the same.
Phase 1 accumulation is thought to reflect blood flow, but no significant difference was observed between ONF and non-ONF patients. Thus, direct proof of a decrease in blood flow was not obtained. However, accumulation of the tracer in bone was insufficient in phase 1, and the difference between the mean counts for bone and soft tissue was small. Consequently, a large dispersion in the HD existed, and low interobserver and intraobserver correlations (r = 0.53 and 0.34, respectively) were obtained for the HD in phase 1. Thus, a large margin of error was present, and the phase 1 results do not rule out a relationship between blood flow and the occurrence of ONF. Because use of the HD is inappropriate in phase 1, a method of analyzing phase 1 accumulation is needed.
In phases 2 and 3, the HDs for the ONF patients were significantly lower than those for the non-ONF patients, and the HDs for all ONF patients in phase 2 were <1.00. Three of 4 ONF patients had no abnormal MRI findings at the time of bone scintigraphy, indicating that 3-phase bone scintigraphy is more sensitive than MRI to the initial tissue changes that occur in ONF.
In this study, we defined the image obtained 15–20 min after injection as phase 2, even though images obtained sooner than 20 min are usually defined as phase 2. In patients with renal hypofunction, increased soft-tissue uptake and insufficient bone accumulation may cause a large margin of error for HD in usual phase 2 images. Using a relatively late image, we can reduce the margin of error. Consequently, interobserver and intraobserver correlation for HD was good in phase 2 (r = 0.94 and 0.93, respectively) as well as in phase 3 (r = 0.96 and 0.99, respectively) in this study. However, relatively late phase 2 images are thought to reflect not only blood flow and blood pool but also bone turnover. Thus, the lower accumulation observed in phase 2 may have been caused by a reduction in bone turnover. However, although the HDs of the ONF patients were significantly lower in both phase 2 and phase 3, some non-ONF patients (9 femoral heads in 7 patients) had HDs as low as those of the ONF patients (<1.00) in phase 2 but higher than those of any ONF patients in phase 3. This finding suggests that the reduction in phase 2 accumulation resulted mainly from a decrease in blood flow or blood pool. Thus, the fact that all ONF patients were in the group with a phase 2 HD < 1.00 suggests a reduction in blood flow or blood pool in their femoral heads. In this investigation, the large dispersion in phase 1 HDs prevented us from determining whether a reduction in blood flow caused the low HDs in phase 2. However, the HD in phase 2, reflecting blood flow or blood pool, can reveal hemodynamic changes in the femoral head. Further study of phase 2 accumulation, including accumulation before surgery, may reveal a more detailed relationship between the occurrence of ONF and hemodynamic changes in the femoral head.
In phase 3, the HDs of the ONF patients were lower than those of any non-ONF patients. This finding may reflect a reduction in bone turnover as a result of osteonecrosis or some unknown factor affecting bone metabolism. This investigation could not determine the cause of the lower phase 3 HDs in the ONF patients.
CONCLUSION
All ONF patients were in the group with a low HD in phase 2, suggesting a reduction in blood flow or blood pool. Phase 2 accumulation in 3-phase bone scintigraphy can be used to estimate early hemodynamic changes occurring in patients with ONF after renal transplantation.
Footnotes
Received Mar. 15, 2001; revision accepted Aug. 20, 2001.
For correspondence or reprints contact: Takao Kubota, MD, Department of Radiology, Kyoto Prefectural University of Medicine, 465 Kajii-cho, Kawaramachi-Hirokoji, Kamigyo-ku, Kyoto, 602-8566 Japan.
In this issue


Jump to section
Related Articles
Cited By...
- No citing articles found.