


Abstract
The aim of the study was to investigate the increase in myocardial 99mTc-methoxyisobutylisonitrile (sestamibi) retention in humans during pharmacologic vasodilation. Methods: For calculation of the increase in 99mTc-sestamibi retention during hyperemia, baseline and adenosine triphosphate (ATP)–induced hyperemic stress sestamibi studies were performed using a same-day rest–stress protocol. On the injection of sestamibi, left ventricular dynamic data were obtained for 90 s. The increase in sestamibi retention from baseline to hyperemia was calculated by the formula
 where Cmh(t) and Cmb(t) are myocardial counts on the tomographic image, and Cbb(τ) and Cbh(τ) are the left ventricular blood-pool counts during the first transit of sestamibi at baseline and during hyperemia, respectively. Coronary flow increase during intravenous ATP stress was measured using intracoronary Doppler flow guide wire and compared with the scintigraphic results of 28 measurements in 22 patients. Results: Sestamibi retention increased as coronary flow velocity increased but plateaued at >2.5–3 times baseline flow velocity. The relationship between the increase in sestamibi retention (Y) and the increase in flow (X) is expressed as follows: Y = 0.44 + 0.60X − 0.068X2 (r = 0.82). Conclusion: In humans, the increase in 99mTc-sestamibi myocardial retention underestimates coronary flow reserve, particularly at high flow rates. Knowledge of these tracer retention characteristics will contribute to a more comprehensive understanding of the manner and interpretation of stress sestamibi imaging.
For assessment of the functional severity of coronary artery stenosis, scintigraphic approaches with tomographic or planar imaging technique using perfusion tracers are performed most frequently. Diagnostic imaging will likely need to be performed with exercise or pharmacologic vasodilator stress to detect stress-induced ischemia or coronary flow reserve abnormality, because even significant coronary artery stenosis is not functionally severe enough to produce resting myocardial ischemia. The success of pharmacologic stress myocardial perfusion imaging relies on the ability of a tracer to accumulate in the myocardial tissue in proportion to the rate of coronary blood flow disparity induced by the pharmacologic stressor.
The radiopharmaceutical 99mTc-methoxyisobutylisonitrile (sestamibi) has been used widely in pharmacologic hyperemic stress myocardial scintigraphy as an alternative to 201Tl for noninvasive detection and prognostic assessment of coronary artery disease (CAD) (1–8). The ability of a tracer to accumulate in tissue as a function of delivery is represented by the absolute tissue retention of the tracer. In the clinical setting, the relationship between the retention of the tracer and myocardial blood flow is more pertinent. This relationship defines the accuracy of the tracer to figure myocardial blood flow over a wide flow range. In canine experimental models, when sestamibi is administered under basal conditions, it distributes in the myocardium in proportion to regional myocardial blood flow, but during adenosine or dipyridamole stress its uptake plateaus with flow rates >2–2.5 times normal flow, resulting in an underestimation of high coronary flow rate (9–12). However, the results of animal experimental study are not always true in humans (13). Although a few human studies have reported a comparison of relative sestamibi uptake with myocardial blood flow measured by positron emission CT (14) or flow reserve measured by intracoronary Doppler flow guide wire (3), to our knowledge, no studies have been reported on the ability of sestamibi to accumulate in myocardial tissue during hyperemia in humans.
Accordingly, the goal of this study was to define the relationship between the increase in regional myocardial sestamibi retention and the increase in coronary blood flow velocity measured by intracoronary Doppler flow guide wire (Flowire; Cardiometrics, Inc., Mountain View, CA) during adenosine triphosphate (ATP)–induced hyperemia in patients with suspected CAD.
MATERIALS AND METHODS
Patients
The study population consisted of 22 patients (15 men, 7 women; mean age, 65 ± 9.0 y) who were referred for scintigraphic study because of suspected CAD. Ten patients had a previous myocardial infarction. Fifteen patients had 1-vessel CAD, 4 patients had 2-vessel CAD, 1 patient had 3-vessel CAD, and 2 patients had no significant coronary artery stenosis. Previous coronary revascularization had been performed by angioplasty on 13 patients. A total of 28 measurements of coronary flow velocity by Doppler Flowire performed within a week of the sestamibi myocardial perfusion scintigraphy were included in this study and analyzed. No clinical events or changes in medications occurred between the sestamibi studies and the Doppler Flowire measurements. The hospital review board approved the study protocol, and all patients gave informed consent.
Coronary Flow Velocity Reserve Measurement by Doppler Flowire
Coronary flow velocity measurements were performed with a 0.356-mm (0.014-in.) Doppler Flowire. After diagnostic angiography, the Doppler wire was placed in the target vessel or positioned >2 cm distal to the stenosis when significant stenosis existed. After baseline average peak velocity (APV) measurement, hyperemic APV was recorded during 3–5 min after initiation of the 5-min continuous intravenous ATP injection at a rate of 0.16 mg/kg/min (15,16). Coronary flow velocity reserve (CFR) was calculated as the hyperemic-to-basal APV ratio. No vessels subtended by collateral flow or a bypass graft were studied.
Measurement of Increase in Absolute 99mTc-Sestamibi Myocardial Retention
Absolute tracer retention can be calculated in a manner described (12) as follows:
 where R is the absolute retention (mL/min/g) of the tracer (t), Ct is the radioactivity of the tracer in the myocardium (counts per minute [cpm]/g), Ca is the arterial radioactivity concentration (cpm/mL), and

The myocardial count on the SPECT image (Cm) can be expressed as k1Ct and the arterial count (Cb) on the radionuclide angiogram can be expressed as k2Ca, where k1 and k2 are the correction factors for the counting rate from the myocardium and the left ventricular blood pool, respectively, including attenuation factor, partial-volume effect, and sensitivity of the gamma camera (17). Then,
 Eq. 1
Eq. 1
The change in sestamibi retention from baseline (Rb) to during the hyperemic response (Rh) is expressed as a ratio of the absolute sestamibi retention during hyperemia to that of baseline (retention increase ratio [RIR]). The correction factors of k1 and k2 are considered to be the same at both baseline and hyperemia. Therefore, k1 and k2 are canceled out and, consequently, the RIR can be calculated as follows:
 Eq. 2
where subscripts b and h indicate baseline and hyperemic status, respectively.
Eq. 2
where subscripts b and h indicate baseline and hyperemic status, respectively.
99mTc-Sestamibi Imaging Protocol and Data Analysis
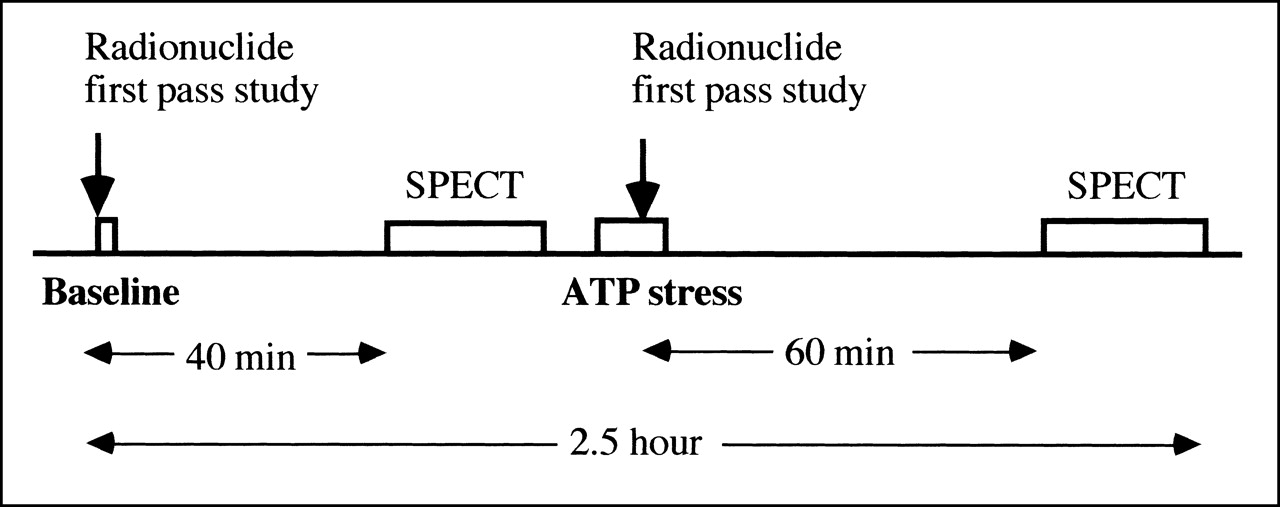
99mTc-sestamibi angiography and SPECT were performed using a same-day rest–stress imaging protocol (Fig. 1). At rest, just after the bolus injection of 300–370 MBq 99mTc-sestamibi into the right medial antecubital vein followed by flushing with 20 mL saline, first-pass radionuclide angiographic data were obtained from the anterior view every second for 90 s using a large-field-of-view gamma camera equipped with a high-resolution, parallel-hole collimator. Planar imaging was performed for 1 min with the patient in the same position 5 min after the radionuclide angiography. Energy discrimination was centered on 140 keV with a 20% window, and data were acquired with 64 × 64 matrices with a 1.5 zoom mode. Forty minutes later, SPECT was performed with a triple-head gamma camera SPECT system equipped with high-resolution, parallel-hole collimators (model 9300A; Toshiba, Tokyo, Japan). The energy discrimination was centered on 140 keV with a 20% window, and a total of 60 projection images were obtained in a 64 × 64 matrix over 360°, with 30 s per view. Tomographic images were reconstructed using a ramp filter with a Butterworth filter (order, 8; cutoff frequency, 0.53 cycle/cm). Attenuation correction was not performed.

Study protocol of rest–ATP stress 99mTc-sestamibi myocardial scintigraphy.
ATP stress was started immediately after the baseline 99mTc-sestamibi SPECT. ATP was infused at a rate of 0.16 mg/kg/min for 5 min through the left antecubital vein (15,16). Three minutes after initiation of the ATP injection, 600–740 MBq 99mTc-sestamibi were injected through the right medial antecubital vein and flushed with 20 mL saline. Radionuclide angiographic data were obtained in the same manner as at the baseline study except that data acquisition was started 5–10 s before the radionuclide injection to obtain data for subtraction of the previously injected radionuclide activity. One hour after the ATP stress, SPECT was performed again.
First-pass angiographic data were analyzed to obtain the time integral of the left ventricular first-pass 99mTc-sestamibi counts as described (17). In brief, on the summed image (3- to 5-s duration) of the left ventricular phase of the first-pass images, a left ventricular region of interest (ROI) was set by delineating the edge where the count was 40% of the left ventricular peak count. The aortic valve plane was delineated manually by detecting a slight narrowing or angulation between the ascending aorta and left ventricle. When the valve plane was unclear, the anterior image obtained 5 min after the first-pass study was used as a reference. The time integral of the left ventricular first-pass 99mTc-sestamibi counts was obtained as an area under the γ-variate–fitted left ventricular time–activity curve derived from the left ventricular ROI. For measurement of the time integral of the left ventricular first-pass counts during ATP stress, the same left ventricular ROI was applied, and curve fitting was performed after subtraction of the previously injected radionuclide activity.
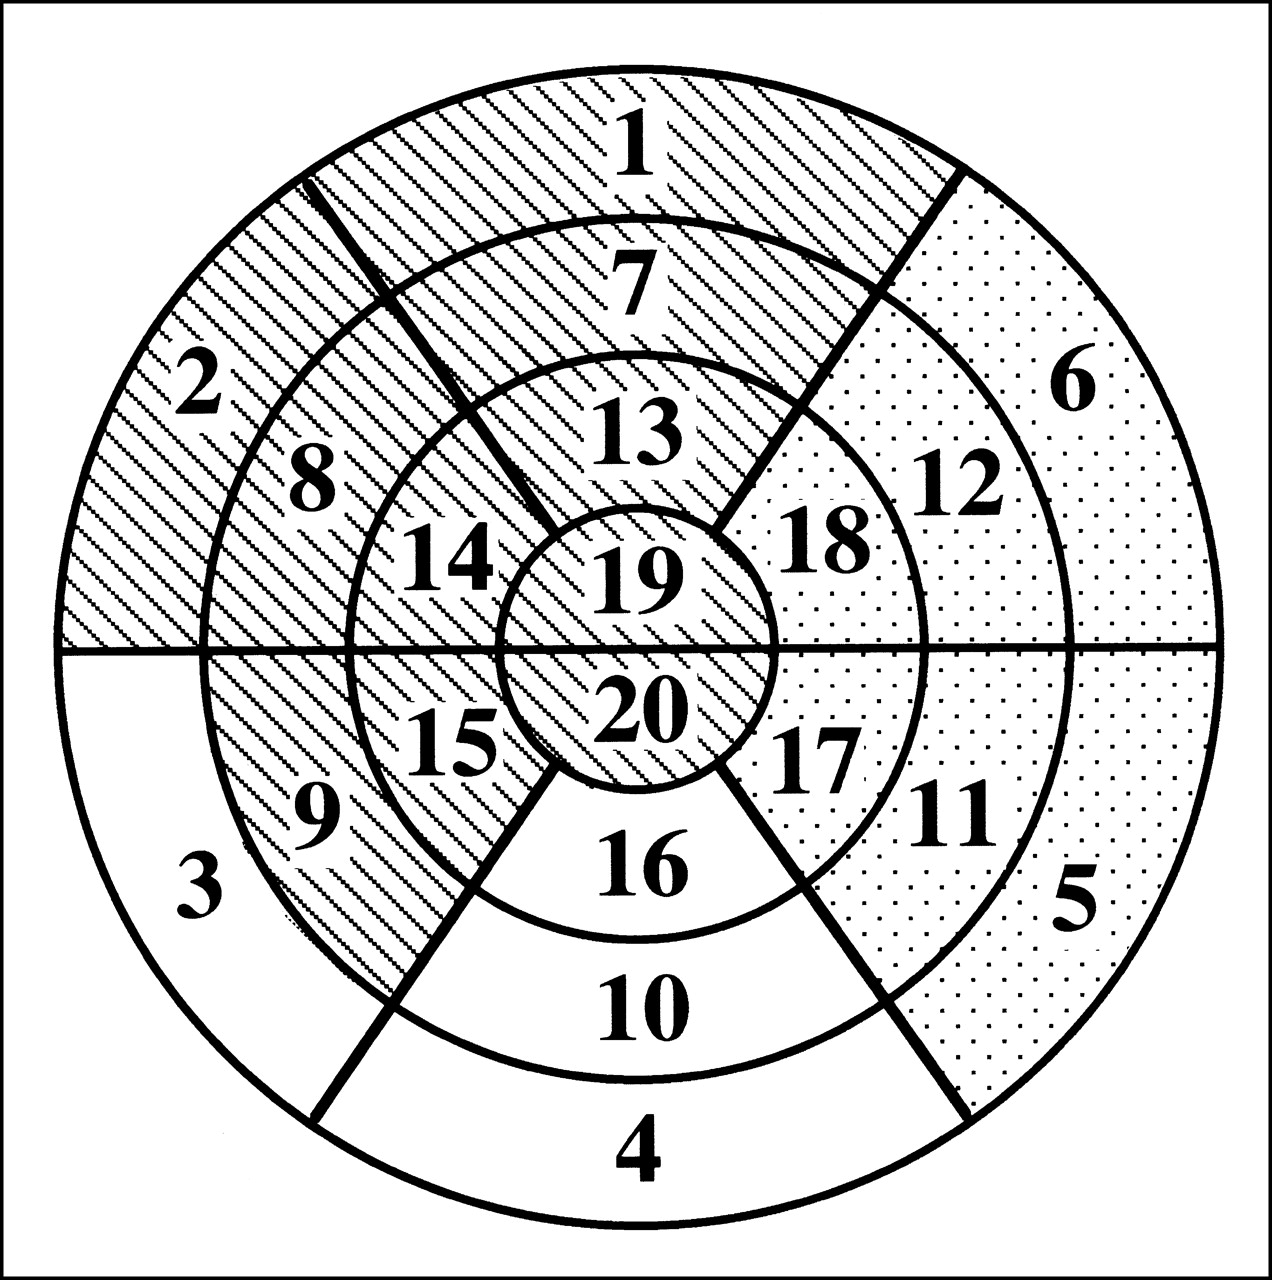
For quantitative analysis of SPECT images after generation of a polar map, 20-segment myocardial territories (Fig. 2) subtended by each of the 3 main coronary arteries (left anterior descending coronary artery [LAD], left circumflex coronary artery [LCx], right coronary artery [RCA]) were assigned on the basis of previous reports of 201Tl SPECT imaging (18,19): segments 1, 2, 7–9, 13–15, 19, and 20 were assigned to the LAD territory, segments 3, 4, 10, and 16 were assigned to the RCA territory, and segments 5, 6, 11, 12, 17, and 18 were assigned to the LCx territory (Fig. 2). This coronary territory assignment was altered for the lower septal, lower lateral, and lower apical walls, depending on patterns of abnormality and coronary anatomy (19). When APV was measured at the proximal portion of the particular coronary artery, all assigned segments to the specific coronary artery area were analyzed. When APV was measured at the middle portion of the particular coronary artery, basal segments in the assigned area were excluded from the analysis.

Segmentation of myocardium on polar map generated from SPECT image. Myocardium is divided into 20 segments. Hatched, dotted, and white areas are assigned to LAD territory, LCx territory, and RCA territory, respectively.
Polar map generation and segmentation of the 20 myocardial areas were performed automatically using commercially available software (QGS software; Cedars-Sinai Medical Center, Los Angeles, CA). The myocardial count in each territory was measured by averaging all segmental counts in the territory at rest and at ATP stress. Because 99mTc-sestamibi activity injected at rest remained at stress, the myocardial count at ATP stress in each territory was obtained by subtracting the decay-corrected resting count from the count on the second image after ATP stress.
Statistical Analysis
Continuous variables were expressed as mean ± SD, and hemodynamic parameters were compared by a paired t test. Sestamibi retention increases in the area with CFR ≤ 2.0, 2.0 < CFR ≤ 3.0, and CFR > 3.0 were compared by ANOVA followed by a Scheffe test. P < 0.05 was considered statistically significant.
RESULTS
Twenty-eight measurements of CFR by Doppler Flowire were performed on 22 patients. Doppler flow analysis was performed 15 times in the LAD, 8 times in the RCA, and 5 times in the LCx. Scintigraphic study and Doppler Flowire analysis in the LAD were repeated in 2 patients 6 mo later. Doppler Flowire analysis was performed in 2 coronary arteries (LAD and LCx in 2 patients, RCA and LCx in 1 patient, LAD and RCA in 1 patient) in 4 patients by repeating ATP stress on the same day. Doppler Flowire analysis was performed in 1 coronary artery in the rest of the 16 patients. The radionuclide study was performed first in 11 measurements, and the CFR study was performed first in 17 measurements.
Hemodynamic Response
Hemodynamic data are summarized in Table 1. With ATP stress, a significant increase in heart rate and a significant decrease in systolic and diastolic blood pressures were found in the radionuclide and Doppler Flowire studies. However, at baseline and at ATP stress, no significant differences between the radionuclide and Doppler Flowire studies were found in heart rate and systolic or diastolic blood pressure.
Hemodynamic Data
Relationship Between Sestamibi Retention and CFR
In Figure 3, the increase in myocardial retention of 99mTc-sestamibi during ATP stress was plotted against the corresponding flow velocity increase measured by Doppler Flowire during ATP stress (CFR). As shown, the increase in myocardial retention of 99mTc-sestamibi plateaued with increasing flow velocity reserve. The solid line in Figure 3 is the nonlinear curve fit (Y = 0.44 + 0.60X − 0.068X2; r = 0.82) (20). As shown in Figure 4A, when CFR was <2.5, the increase in 99mTc-sestamibi retention and CFR showed a good linear correlation (Y = 0.31X + 0.72; r = 0.79; P < 0.005), but the increase in 99mTc-sestamibi retention at higher CFR did not correlate significantly with CFR (Fig. 4B).
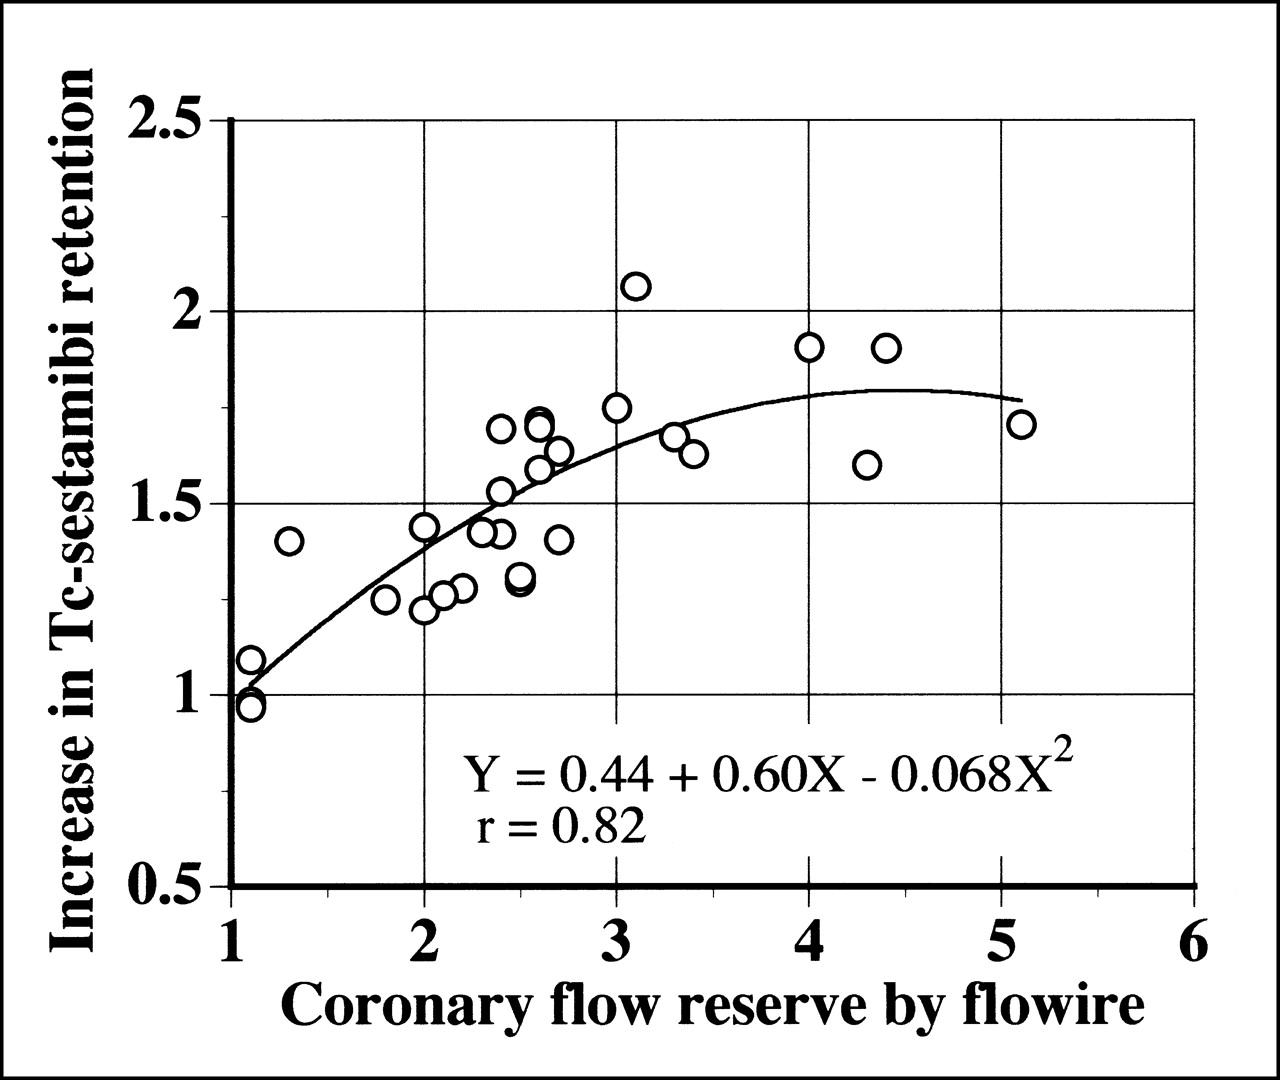
Increase in myocardial 99mTc-sestamibi retention plotted against Doppler Flowire–determined CFR.
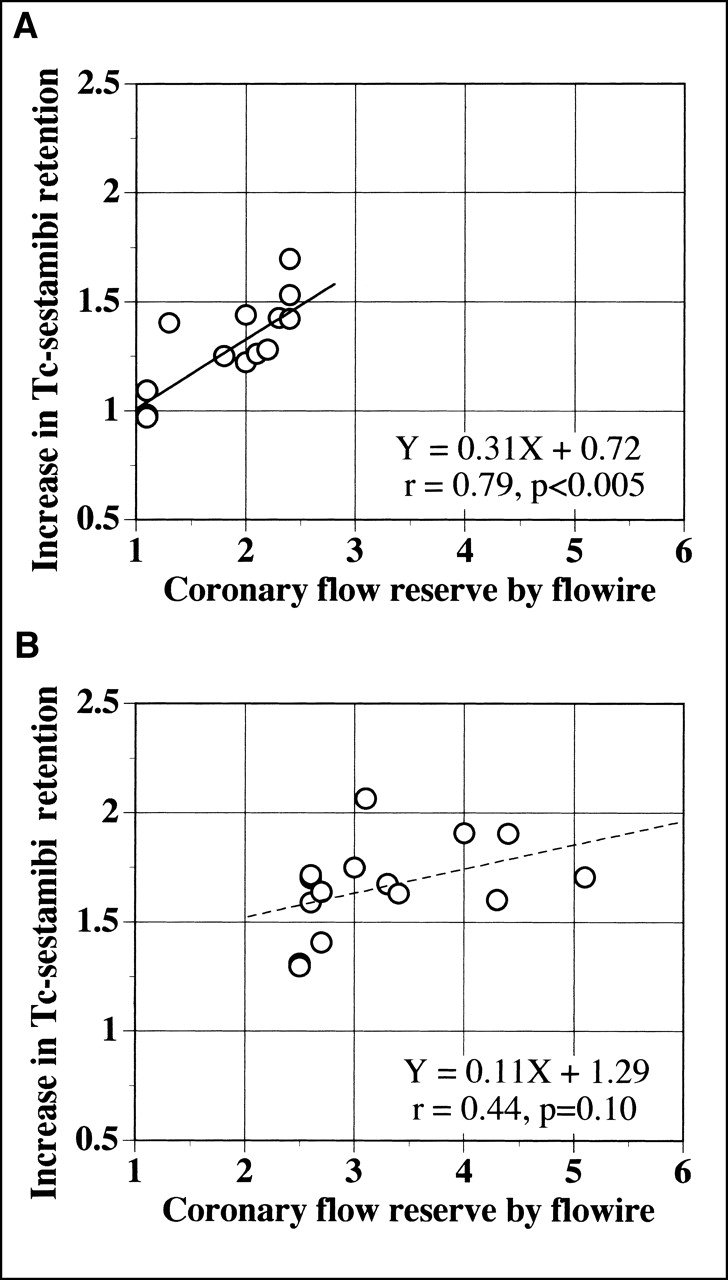
Increase in myocardial 99mTc-sestamibi retention vs. Doppler Flowire–determined CFR with <2.5 (A) and ≥2.5 (B). Solid (A) and dashed (B) lines indicate regression lines.
The increase in myocardial retention of 99mTc-sestamibi with CFR ≤ 2.0 (1.19 ± 0.19) was significantly lower than that with 2.0 < CFR ≤ 3.0 (1.50 ± 0.18; P < 0.005) and CFR > 3.0 (1.78 ± 0.18; P < 0.0001). A significant difference in the increase in 99mTc-sestamibi retention was also found between CFR >3.0 and 2.0 < CFR ≤3.0 (P < 0.01).
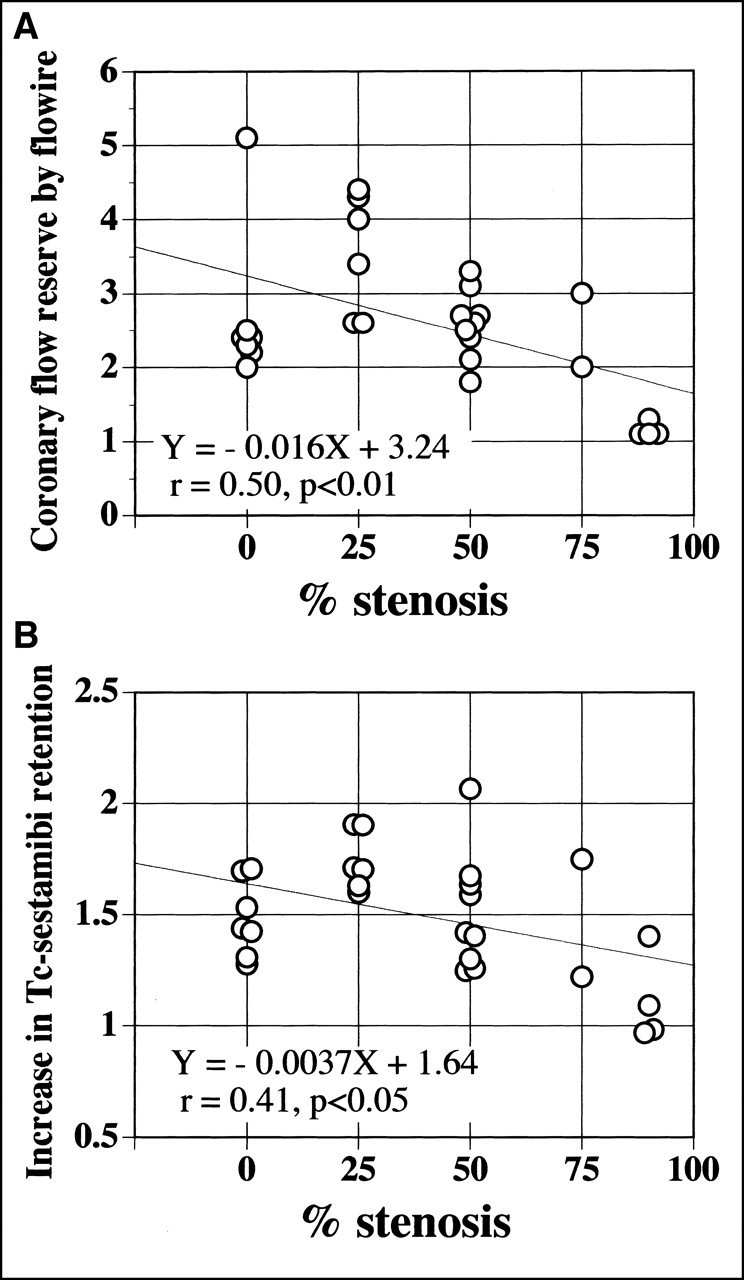
Relationship Between Coronary Stenosis and CFR and Increase in 99mTc-Sestamibi Retention
CFR (Fig. 5A) and the increase in myocardial retention of 99mTc-sestamibi (Fig. 5B) are plotted against the percentage of coronary stenosis. Weak negative linear correlations were found between the percentage of stenosis and CFR (r = 0.50; P < 0.01) and the increase in sestamibi retention (r = 0.41; P < 0.05).

Relationships between percentage of coronary stenosis and CFR (A) and increase in myocardial retention of 99mTc-sestamibi (B). Weak negative linear correlations are found between percentage of stenosis and CFR (r = 0.50; P < 0.01) and increase in sestamibi retention (r = 0.41; P < 0.05). Solid lines indicate regression lines.
DISCUSSION
This study examined the relationship in humans between the increase in myocardial sestamibi retention during hyperemia and hyperemic CFR measured by Doppler Flowire. In both measurements, the hyperemia was induced by intravenous ATP infusion at the same dose, resulting in a similar hemodynamic response. This study in humans showed that the sestamibi retention increased as flow increased, whereas it did not increase proportional to that of blood flow during hyperemia and plateaued at >2.5- to 3-fold the baseline blood flow, indicating an underestimation of the increase in blood flow by myocardial sestamibi uptake especially at higher flow rates.
Because the accuracy of scintigraphic detection of ischemia depends on the heterogeneity of tracer retention achieved between normal and ischemic regions encountered during pharmacologic coronary vasodilation or dynamic exercise stress, high tracer extraction and retention across the broad range of myocardial flow are essential characteristics for an ideal flow tracer. However, as shown in Figure 3, the increase in sestamibi retention was not proportional to that of blood flow and plateaued at a high increase in flow rate (>2.5–3 times baseline flow). Although a linear relationship between sestamibi retention increase and CFR is observed in the range of CFR <2.5, the slope of this line was far from unity (Fig. 4). This curve is characteristic of any extractable flow tracer such as 201T1 in that the amount of tracer extracted is limited by flow only at low flow rates and plateaus at high flow rates, at which the extraction of the tracer becomes limited by membrane transport. This study revealed that sestamibi retention kinetics in humans are similar to those reported in canine experimental models, in which the initial distribution of sestamibi under basal condition correlated closely with regional blood flow, but when sestamibi was administered at flow rates >2–3 mL/min/g, its uptake or retention plateaued (9–12).
For measurement of absolute tracer retention, direct measurement of tissue tracer count (cpm/g) and arterial radioactivity concentration as an arterial input function (cpm/mL) is necessary. In this study, the tissue and arterial counts were measured with a gamma camera; therefore, correction factors for the counting rate from the myocardium and the left ventricular blood pool, which are determined primarily by the attenuation factor, sensitivity of the gamma camera system, and partial-volume effect, are necessary for the determination of absolute tracer retention as shown in Equation 1. These correction factors (k1 and k2) are specific to the gamma camera system used and the individual patient but should be unchanged theoretically between imaging at baseline and at hyperemia. Therefore, they are unnecessary for calculation of the relative increase in the absolute tracer retention from baseline to hyperemia because theoretically they are canceled out. For dynamic data acquisition to obtain arterial radioactivity concentration, left ventricular data were used because statistical error should be minimal (because of a high counting rate) on account of a negligible count loss associated with the dead time of the gamma camera and the large sampling volume (17). Dynamic data acquisition in every second was considered to be adequate because the time integral of arterial radioactivity during the first pass of the tracer was quite similar in serial 1- and 0.5-s acquisitions in a preliminary trial.
Because rest–stress imaging was performed on the same day, subtraction of the myocardial count of the first image (rest image) from the second image (ATP stress image) with consideration of decay correction was necessary to obtain the true stress myocardial count. Although several conflicting reports regarding the sestamibi kinetics, including redistribution after injection in canine and human studies, have been published (10,21–24), the physiologic count change of sestamibi during rest versus during stress imaging can be a source of error. To minimize this error, ATP stress was started just after cessation of the rest imaging, permitting initiation of stress imaging within 1.5 h after rest imaging; also, >2 times the dose of sestamibi at rest imaging was injected at ATP stress.
The results of this study suggest that it is theoretically possible for mild to moderate stenosis with less impaired CFR to be overlooked with sestamibi imaging in conjunction with vasodilator stress. Although it is not proportional, sestamibi retention increased as flow increased up to 2.5–3 times baseline and, when CFR ≤2.0 is considered abnormal as found in earlier Doppler Flowire studies (3,25–27), the increase in sestamibi retention with abnormal CFR was significantly lower than that with normal CFR, suggesting that sestamibi imaging could differentiate the myocardial area with abnormal CFR from that with normal CFR. Previous reports of a comparison between pharmacologic sestamibi stress SPECT imaging and CFR by Doppler Flowire revealed that coronary stenosis with CFR ≤2.0 was found in association with at least 1 reversible sestamibi hypoperfusion defect in all patients, and more reversibly hypoperfused segments were observed in patients with abnormal CFR (2.4 ± 0.7 segments vs. 0.6 ± 1.0 segment; P < 0.05) (3).
Although a significant linear relationship was found between angiographic coronary stenosis severity and indices of functional stenosis severity, variability was noted when either CFR or sestamibi retention increase was plotted against coronary percentage stenosis. These results are consistent with previous studies that compared CFR with angiographic stenosis (3,28).
The approach for evaluation of the relative increase in sestamibi retention would be useful in assessment of the global CFR reduction, such as in balanced 3-vessel ischemia, hypercholesterolemia, and preclinical atherosclerosis. (29,30). However, this issue remains to be elucidated.
For measurement of coronary flow reserve (blood flow increase from baseline to hyperemia), the ratio of hyperemic to baseline APV was used on the basis of the assumption that intravenous ATP infusion would not significantly modify the lumen diameter of major epicardial coronary arteries (31). Additional methodologic limitations of Doppler assessment of CFR include potential errors associated with competitive flow in branching or collateral vessels, although analysis of CFR in the coronary artery with angiographically documented collateral vessels was excluded from this study. Angiographically invisible collaterals, coexisting remote CADs, or the presence of infarction might have a potential confounding effect on CFR measurement.
In this study, the relationship between the increments of sestamibi retention and coronary flow velocity from baseline to hyperemia, rather than absolute tracer retention and coronary flow, was determined. Despite the lack of absolute tracer retention characteristics versus absolute coronary blood flow, the ability of the relative increment of tracer retention against coronary blood flow augmentation should determine the accuracy of sestamibi as a myocardial perfusion tracer in nuclear cardiac imaging because tracer retention heterogeneity associated with blood flow heterogeneity encountered during pharmacologic coronary vasodilation or physical exercise is the diagnostic determinant of physiologically significant coronary artery stenosis. Although more sophisticated methods for quantification of coronary vascular bed size based on coronary angiography have been reported (32), we applied rather simple segmentation to correlate regional tracer retention and flow data in this study.
CONCLUSION
In humans, the increase in 99mTc-sestamibi myocardial retention is not directly proportional to the increase in coronary flow velocity. Sestamibi retention increases as flow increases, with significant underestimation and a plateau at >2.5–3 times baseline flow.
Footnotes
Received Feb. 8, 2001; revision accepted Jun. 12, 2001.
For correspondence or reprints contact: Junichi Taki, MD, PhD, Department of Nuclear Medicine, Kanazawa University School of Medicine, 13-1 Takara-machi, Kanazawa, 920-8640, Japan.
REFERENCES
In this issue


Jump to section
Related Articles
Cited By...
- Absolute Myocardial Blood Flow and Flow Reserve Assessed by Gated SPECT with Cadmium-Zinc-Telluride Detectors Using 99mTc-Tetrofosmin: Head-to-Head Comparison with 13N-Ammonia PET
- Prognostic Value of Myocardial Perfusion SPECT After Intravenous Bolus Administration of Nicorandil in Patients with Acute Ischemic Heart Failure
- Quantification of Myocardial Perfusion Reserve Using Dynamic SPECT Imaging in Humans: A Feasibility Study
- Simplified Quantification of Myocardial Flow Reserve with flurpiridaz F 18: Validation with Microspheres in a Pig Model
- Relationship Between Brachial Artery Flow-Mediated Dilation and Coronary Flow Reserve in Patients with Peripheral Artery Disease
- Influence of Risk Factors on Coronary Flow Reserve in Patients with 1-Vessel Coronary Artery Disease