


Article Figures & Data
Figures
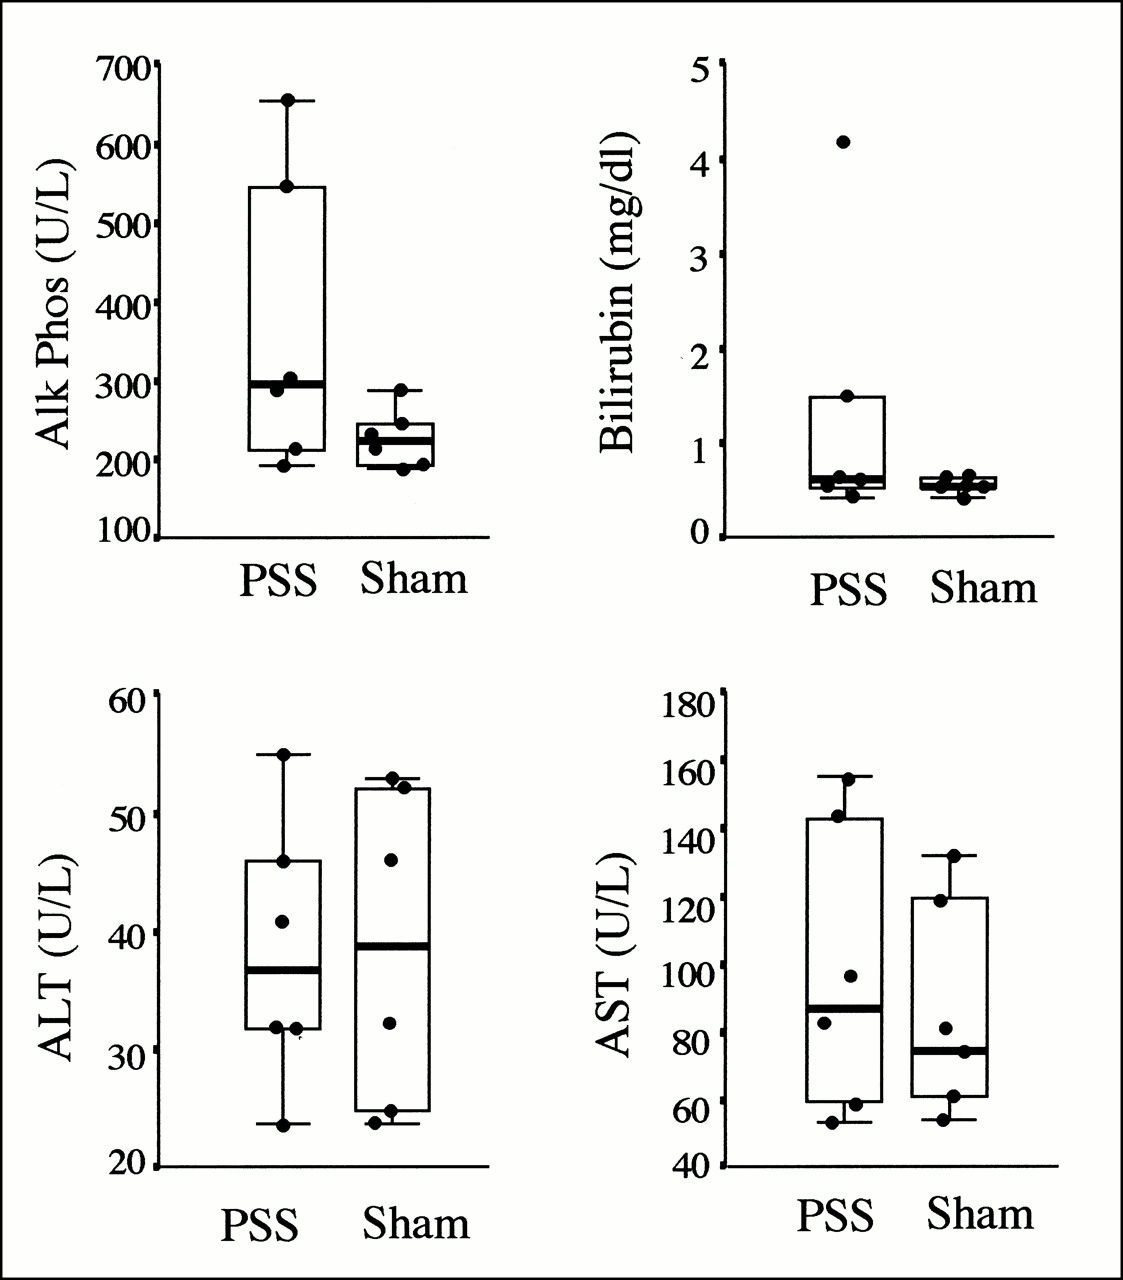
- FIGURE 1.
Liver enzymes and bilirubin were not significantly different in shunted and sham-operated rats. Top and bottom of each box delineate upper and lower quartile ranges, that is, points containing 25% of data points above and 25% of data points below median. Median is indicated by thicker horizontal line. Error bars are shown above or below each box. Dark circles are data points from individual rats. Alk Phos = alkaline phosphatase; ALT = alanine aminotransferase; AST = aspartate aminotransferase.
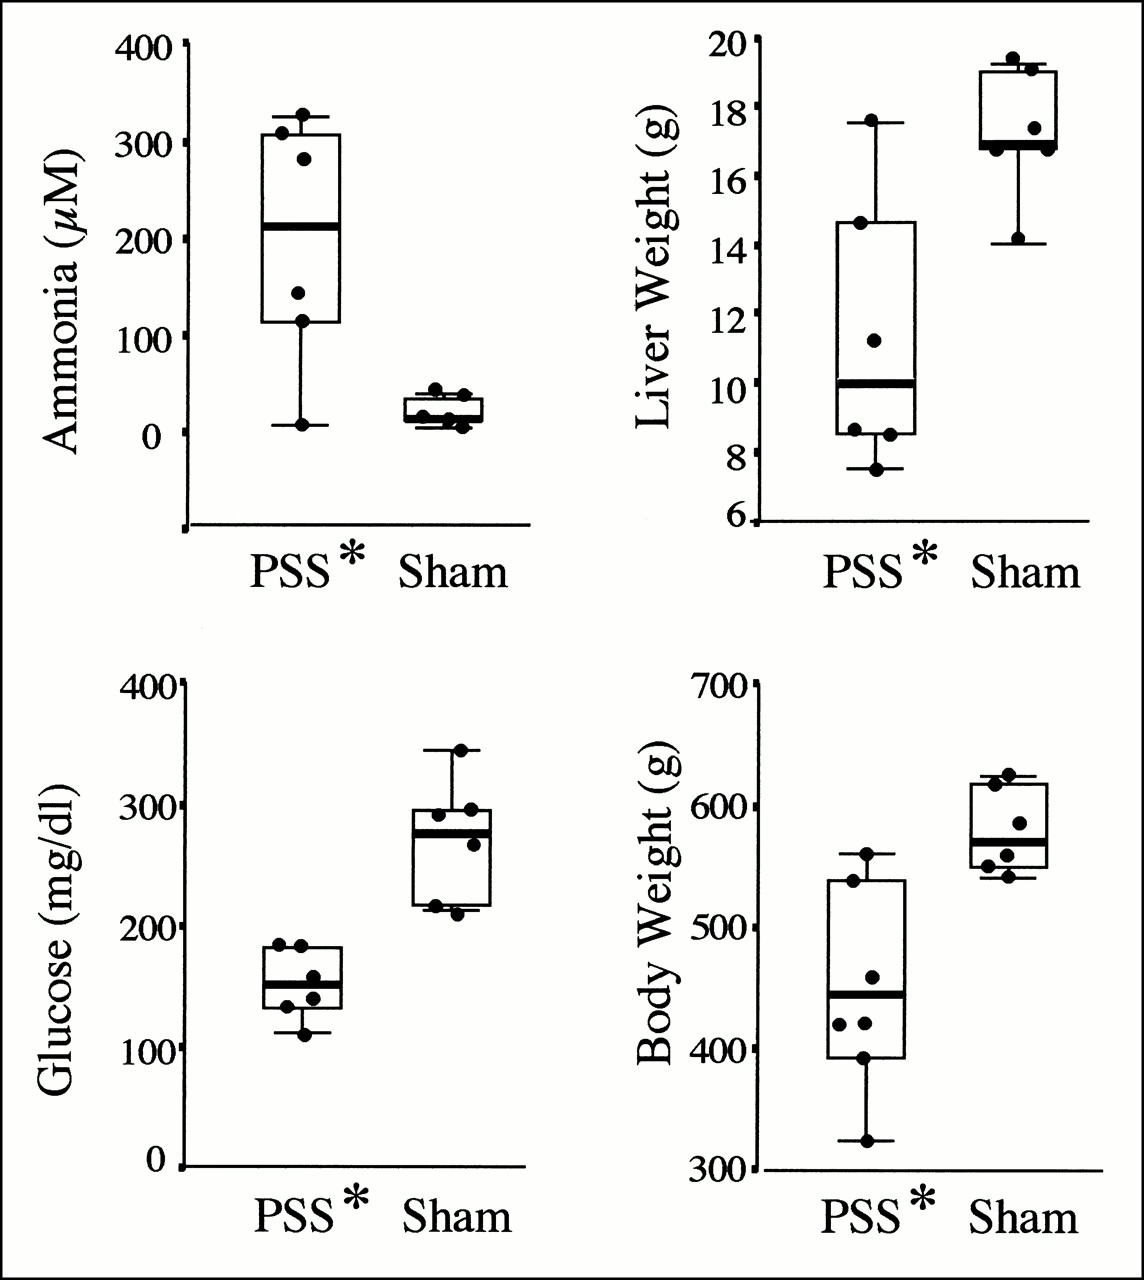
- FIGURE 2.
Ammonia, glucose, liver, and body weights were significantly different in shunted and sham-operated rats. Top and bottom of each box delineate upper and lower quartile ranges, that is, points containing 25% of data points above and 25% of data points below median. Median is indicated by thicker horizontal line. Error bars are shown above or below each box. Dark circles are data points from individual rats. Asterisks indicate significant differences (P < 0.05).
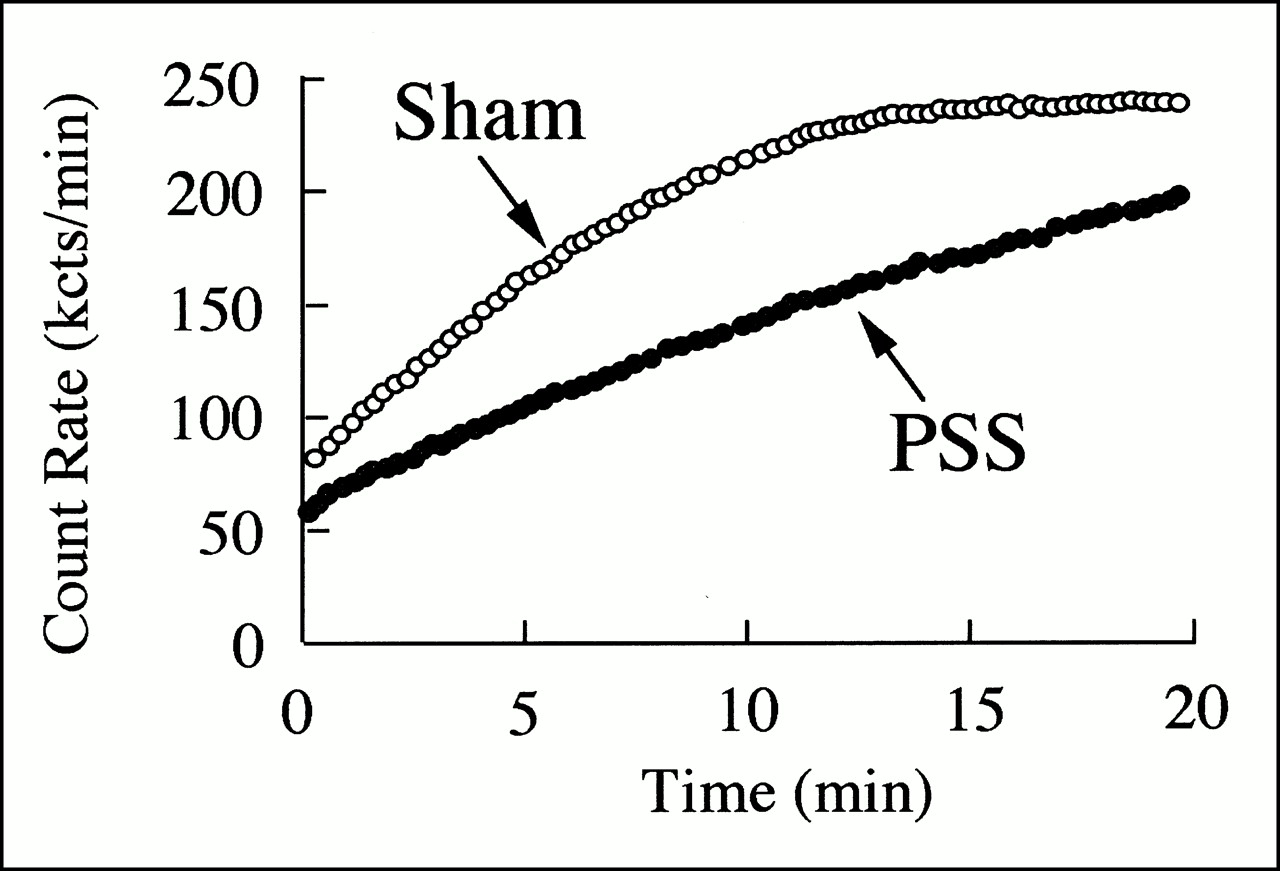
- FIGURE 3.
Liver time–activity data with model simulations from two representative studies: sham-operated rat and shunted rat. R̃o of sham-operated rat was 0.286 ± 0.007 nmol/g; receptor concentration [R]o was 0.901 ± 0.021 μmol/L. Shunted rat had R̃o of 0.018 ± 0.001 nmol/g and [R]o of 0.273 ± 0.001 mol/L. kcts = kilocounts.
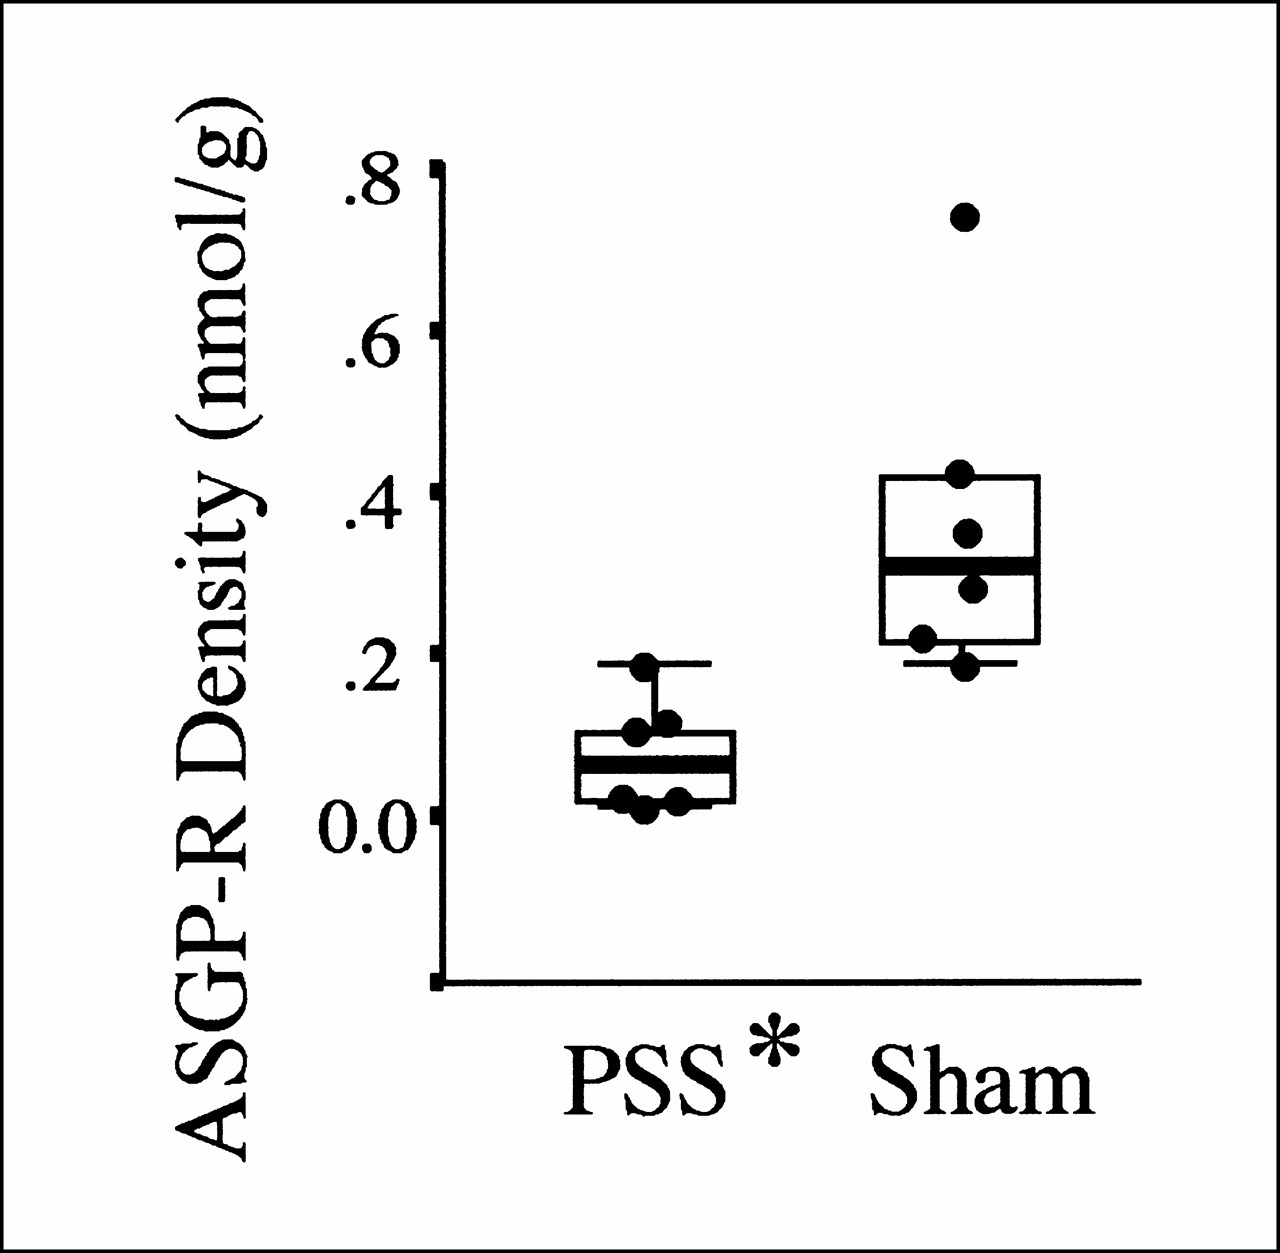
- FIGURE 4.
Representation of ASGP-R R̃o for shunted and sham-operated rats. Top and bottom of each box delineate upper and lower quartile ranges, that is, points containing 25% of data points above and 25% of data points below median. Median is indicated by thicker horizontal line. Error bars are shown above or below each box. Dark circles are data points from individual rats. Asterisk indicates significant differences (P < 0.05).
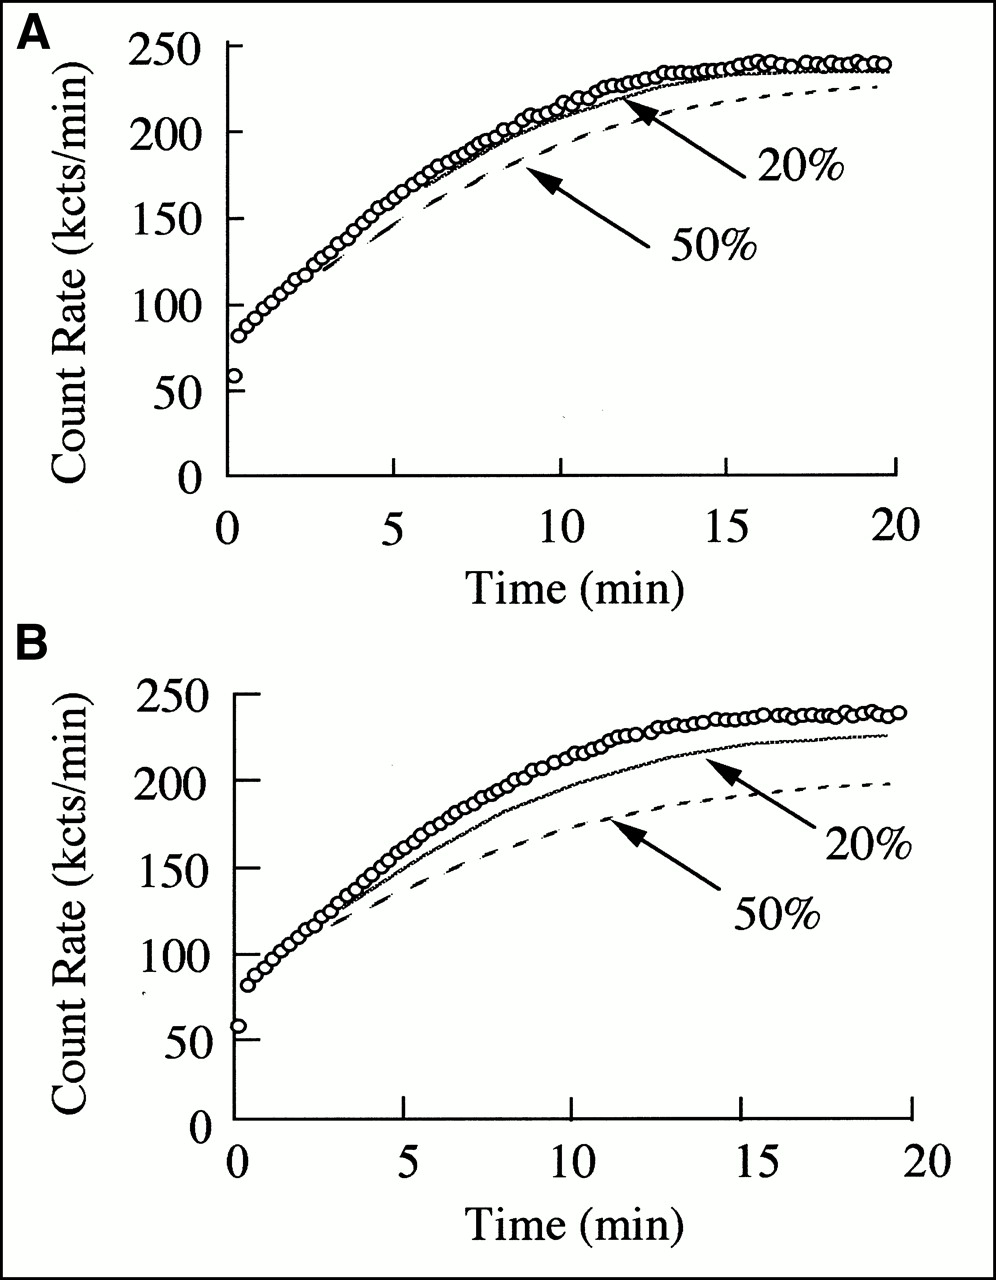
- FIGURE 5.
(A) Simulated changes in 99mTc-GSA liver–activity curve if hepatic blood flow is reduced by 20% (solid line) or 50% (dashed line). (B) Simulated changes in 99mTc-GSA liver–activity curve if receptor concentration is reduced by 20% (solid line) or 50% (dashed line). 99mTc-GSA liver time–activity data from sham-operated rat are indicated by circles. kcts = kilocounts.


Tables
Parameter Symbol PSS Sham P Receptor concentration (μmol/L) [R]o 0.366 ± 0.138 0.683 ± 0.323 0.052 Forward binding rate constant (L/μmol per minute) kb 0.972 ± 0.730 1.859 ± 0.901 0.090 Hepatic plasma flow/liver weight (mL/min/g) F̃ 0.676 ± 0.437 0.355 ± 0.123 0.114 Receptor/liver weight (nmol/g) R̃o 0.082 ± 0.066 0.254 ± 0.119 0.012 Receptor/rat weight (pmol/g) Ro/tbw 2.11 ± 1.85 7.53 ± 3.57 0.008 Maximum transport rate (nmol/L per min/g) Rmax 0.384 ± 0.501 1.686 ± 1.113 0.027 Hepatic plasma volume/liver weight (mL/g) Ṽh 0.213 ± 0.144 0.388 ± 0.087 0.029 ASGP-R density (R̃o) significantly decreased in PSS rats, with no change in hepatic plasma flow/liver weight (F̃). Statistical comparisons of other parameters measured in PSS (n = 6) and sham-operated (n = 6) rats are also indicated.
In this issue


Jump to section
Related Articles
Cited By...
- No citing articles found.