


Article Figures & Data
Figures
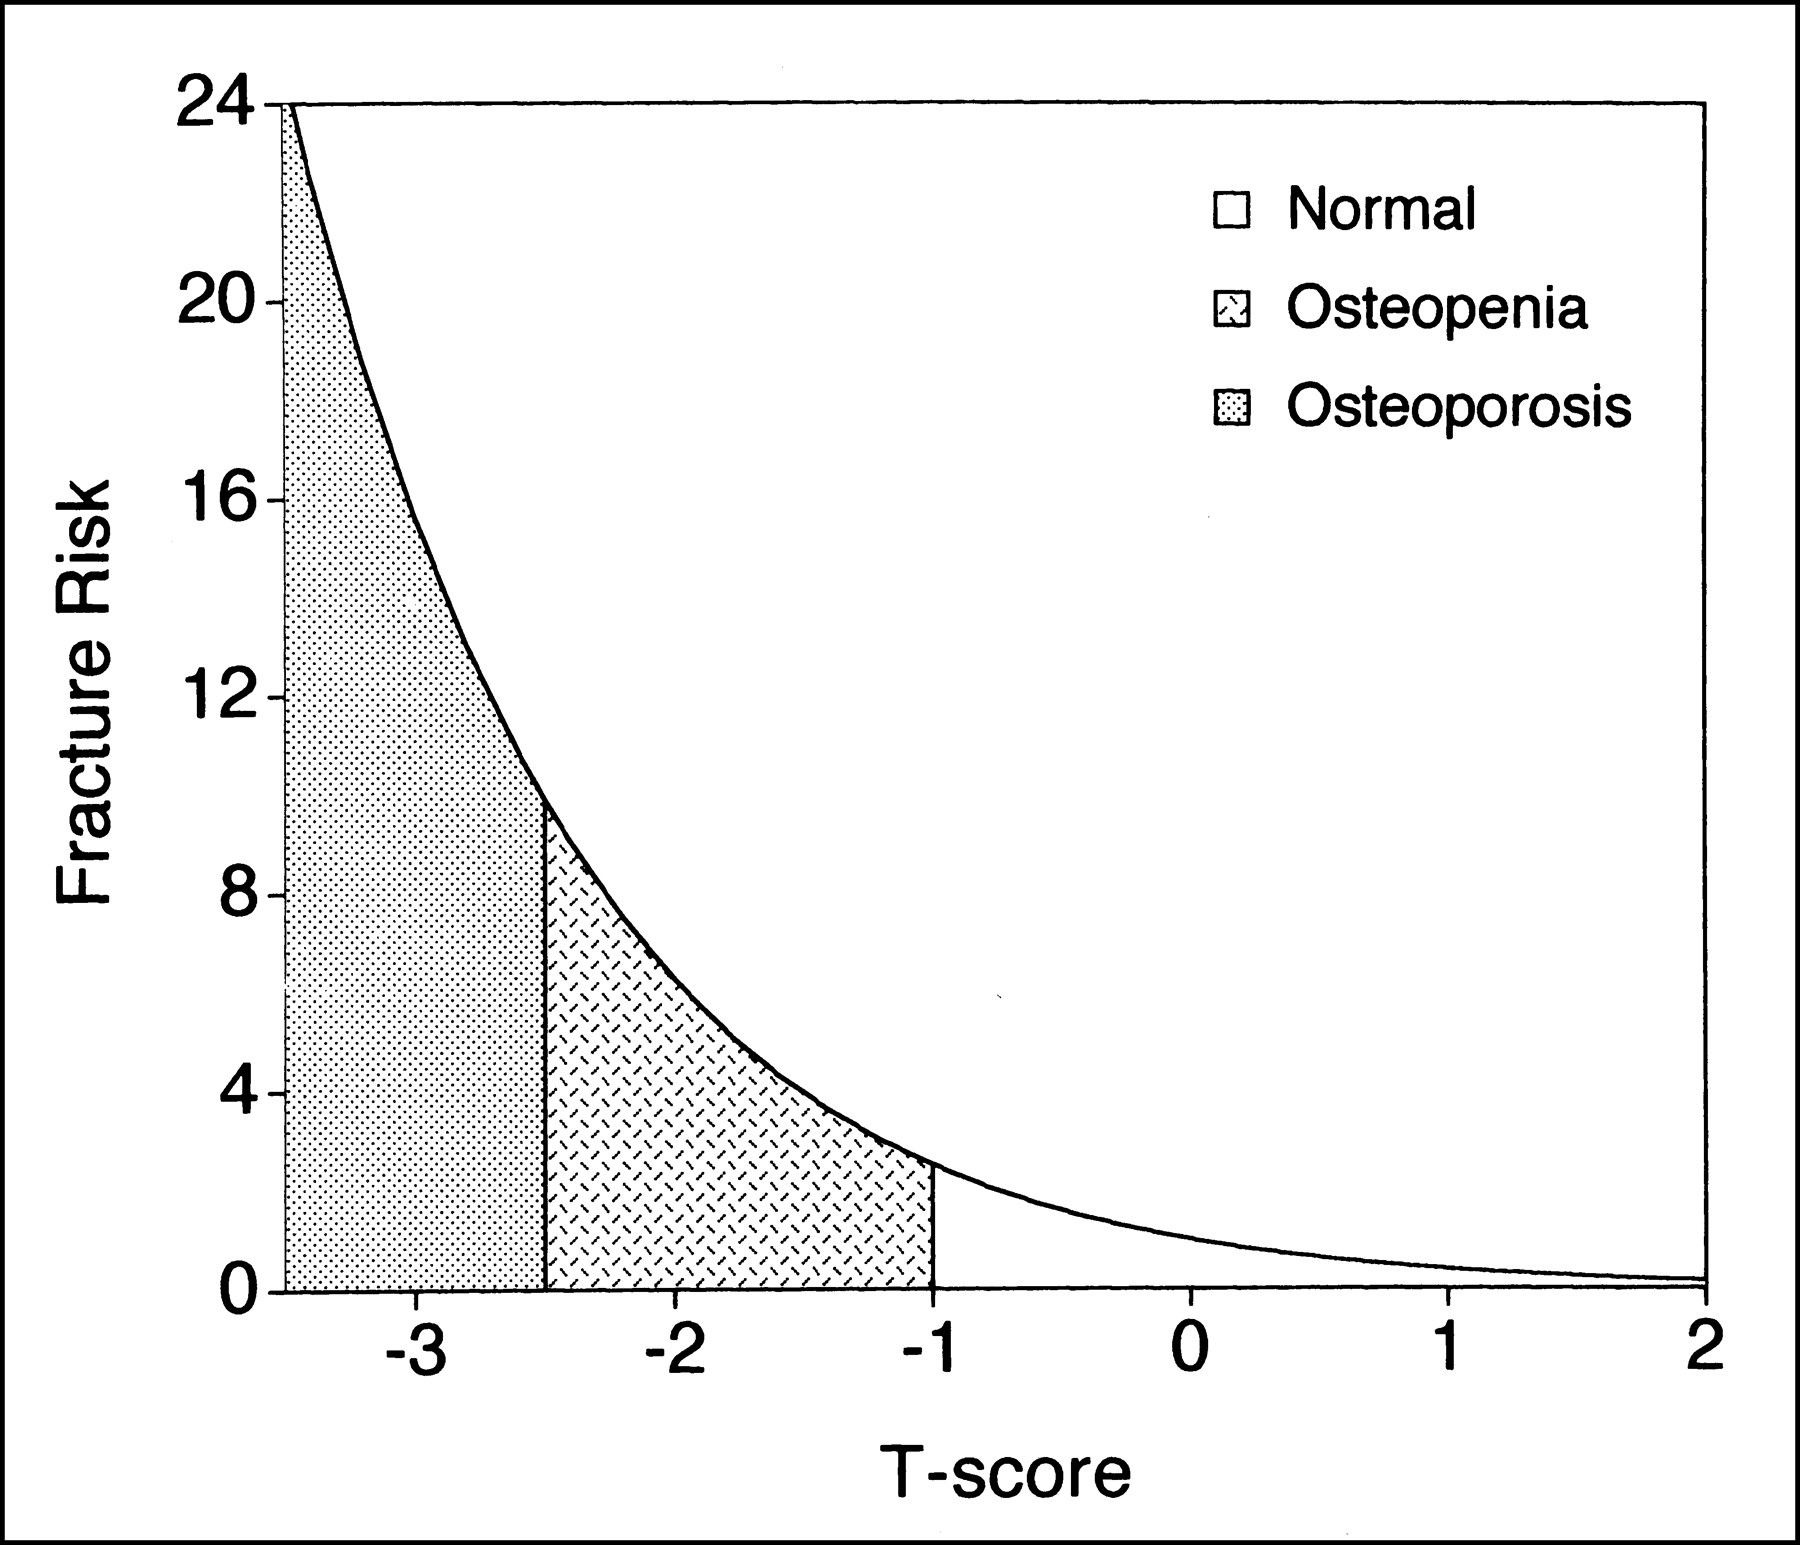
- FIGURE 1.
Gradient-of-risk relationship between bone density and fracture risk. Bone density is plotted in T-score units relative to mean and SD of healthy young adult population. WHO definitions of osteoporosis, osteopenia, and “normal” are intended to identify patients at high, intermediate, and low risks of fracture. In this figure, a decrease in T-score by 1 unit increases fracture risk by a factor of 2.5. This approximates to relationship between hip BMD and hip-fracture risk (see Figure 2).
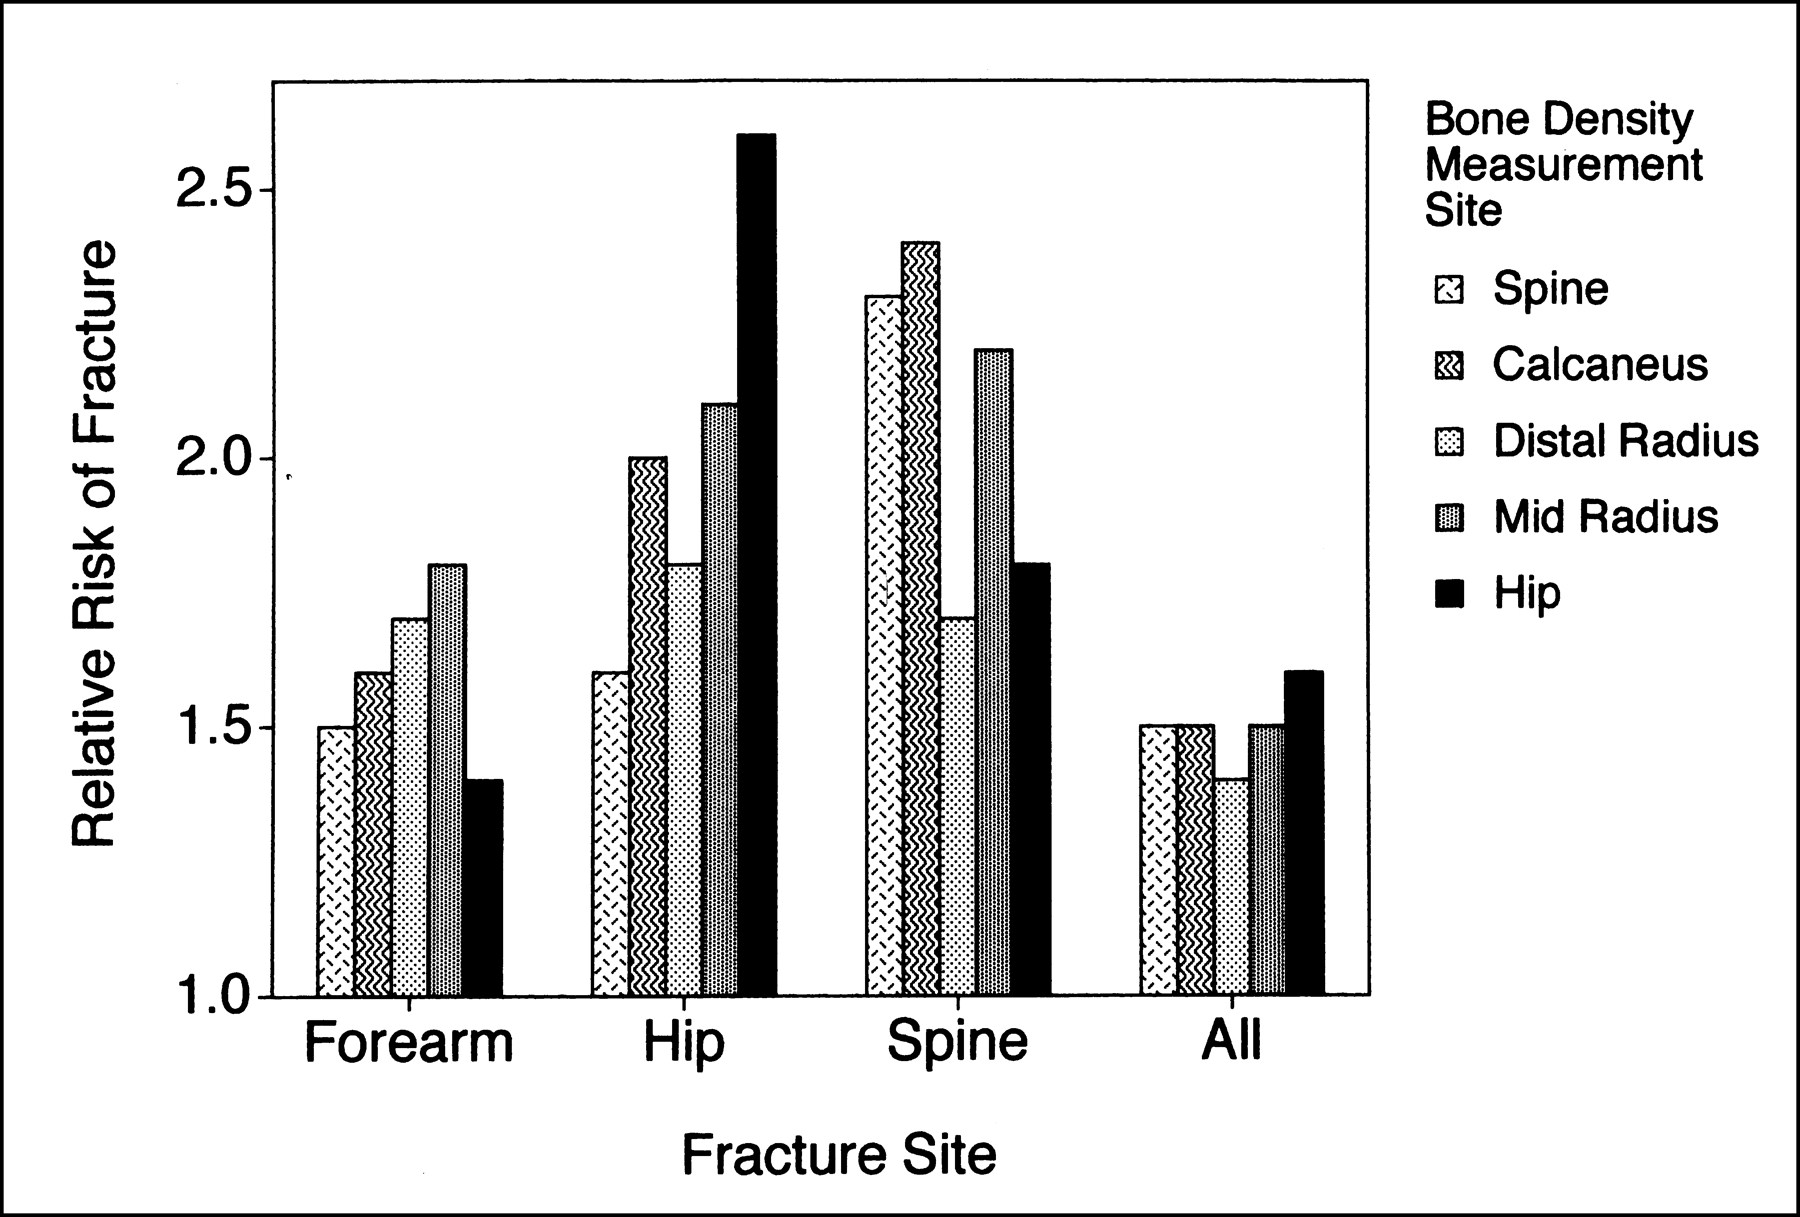
- FIGURE 2.
RR values for fractures at different skeletal sites for bone density measurements in spine, calcaneus, distal radius, midradius, and hip. RR is defined as increased risk of fracture for a 1-SD decrease in BMD. Data are taken from meta-analysis of prospective studies collated by Marshall et al. (24).
- FIGURE 3.
(A) QDR4500 fanbeam DXA scanner (Hologic, Bedford, MA). Densitometers such as this are most frequently used for measuring spine and hip BMD but can also be used for total body, forearm, and lateral projection studies of the spine. (B) Portion of computer printout from DXA scan of the spine. Printout shows (clockwise from left): scan image of lumbar spine; patient's age and BMD plotted with respect to the reference range; and BMD figures for individual vertebrae and total spine (L1–L4) with interpretation in terms of T-scores and Z-scores. (C) Portion of computer printout from a DXA scan of the hip. Printout shows (clockwise from left): scan image of proximal femur; patient's age and BMD for the total femur ROI plotted with respect to the NHANES III reference range; and BMD figures for 5 ROIs in hip (femoral neck, greater trochanter, intertrochanteric, total femur, and Ward's triangle) together with interpretation in terms of T-scores and Z-scores using the NHANES III reference range.
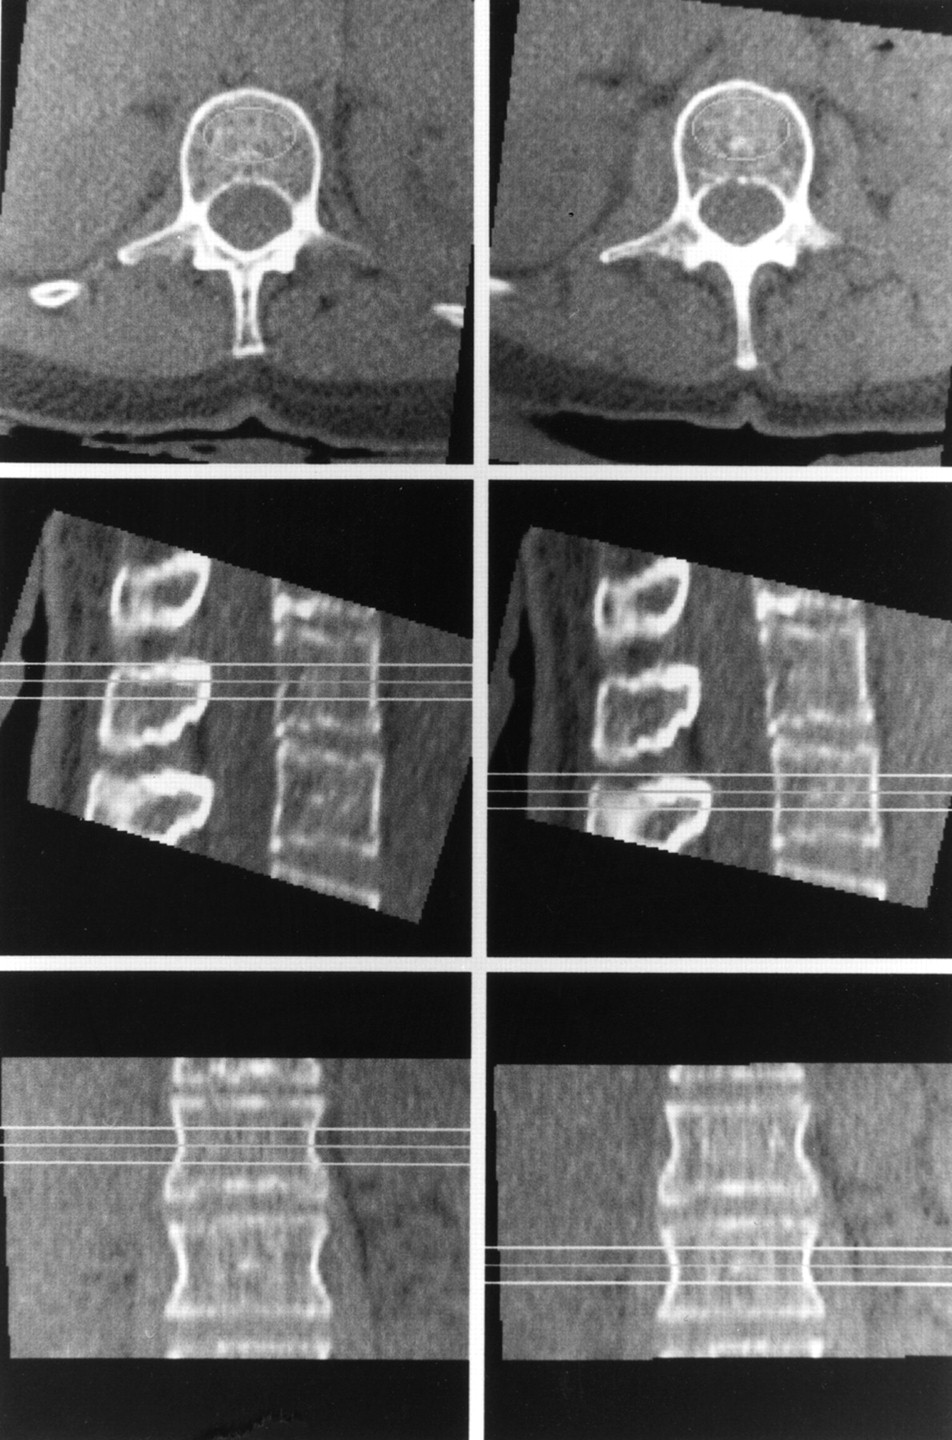
- FIGURE 4.
Portion of computer printout from spinal QCT scan showing transverse, sagittal, and coronal images of 2 lumbar vertebrae. The study was analyzed using commercially available QCT software package (Mindways Software, San Francisco, CA).
- FIGURE 5.
Computer printout from pDXA scan of distal forearm. Scan was performed on DTX-200 system (Osteometer Meditech, Hawthorne, CA).
- FIGURE 6.
Achilles system for performing QUS measurements in the heel (Lunar Corp., Madison, WI). Devices such as this measure BUA and SOS in calcaneus. The 2 measurements are combined into 1 index (“Stiffness”), which is supposed to improve discrimination compared with BUA or SOS alone.
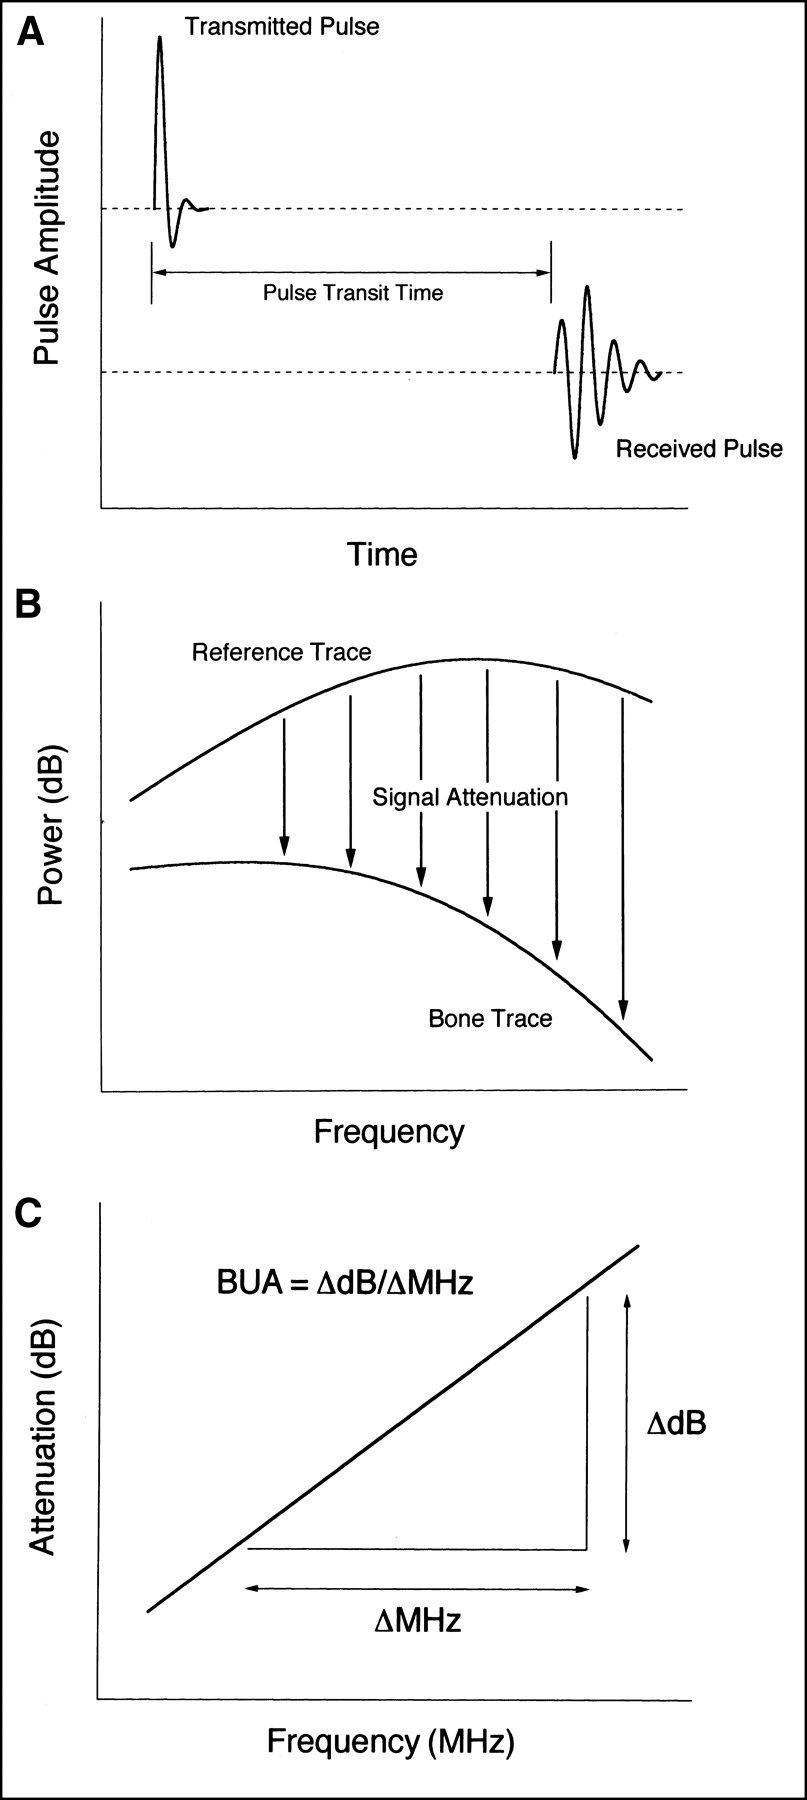
- FIGURE 7.
Physical principles behind measurement of BUA and SOS. (A) Received pulse is digitized, and fourier analysis used to determine the power spectrum. Pulse transit time is used for SOS measurement. (B) Power spectrum of signal transmitted through patient's heel is compared with reference trace from signal transmitted through water. Difference between the 2 traces represents attenuation from patient's heel. (C) When attenuation through patient's heel is plotted against frequency, linear relationship is found at frequencies less than 1 MHz. BUA is defined as slope of regression line and is measured in units of dB/MHz.


Tables
Technique Regions of interest Units reported Precision (%CV) Effective dose (μSv) DXA PA spine BMD (g/cm2) 1% 1–10 Proximal femur 1%–2% 1–10 Total body 1% 3 QCT Spine BMD (g/cm3) 3% 50–500 pDXA Forearm BMD (g/cm2) 1%–2% 0.1 Calcaneus 1%–2% 0.1 pQCT Forearm BMD (g/cm3) 1%–2% 1–3 RA Phalanx BMD (g/cm2) 1%–2% 10 QUS Calcaneus BUA (dB/MHz) 2%–5% None Calcaneus SOS (m/s) 0.1%–1% None Tibia SOS (m/s) 1%–2% None Multisite SOS (m/s) 1%–2% None PA = posteroanterior; BUA = broadband ultrasonic attenuation; SOS = speed of sound.
- TABLE 2.
Risk Factors for Osteoporosis, Additional to Age and BMD, Incorporated in the NOF Guidelines for Therapeutic Intervention
• History of fracture after age 40. • History of hip, wrist, or vertebral fracture in a first-degree relative. • Being in lowest quartile for body weight (≤57.8 kg [127 lb]). • Current cigarette smoking habit. Data from NOF guidelines (57,59).
Category Risk factor Presence of strong risk factors Estrogen deficiency Premature menopause (age <45 y) Prolonged secondary amenorrhea (>1 y) Primary hypogonadism Corticosteroid therapy Prednisolone >7.5 mg/day for 1 y or more Maternal family history of hip fracture Low body mass index (<19 kg/m2) Other disorders associated with osteoporosis Anorexia nervosa Malabsorption syndrome Primary hyperparathyroidism Post-transplantation Chronic renal failure Hyperthyroidism Prolonged immobilization Cushing's syndrome Radiographic evidence of osteopenia or vertebral deformity Previous fragility fracture, especially of the hip, spine, or wrist Loss of height, thoracic kyphosis (after radiographic confirmation of vertebral deformities) Data from RCP guidelines (58).


