


Abstract
The need to draw regions of interest (ROIs) manually may reduce the convenience and reliability of estimating renal function from renal scintigraphy. We developed a semiautomated method to define ROIs for renal scintigraphy with 99mTc-mercaptoacetyltriglycine (MAG3) and evaluated the clinical applicability of the method to the estimation of renal function by camera-based methods. Methods: Dynamic renal scintigraphy with 99mTc-MAG3 was performed on 21 patients. An operator placed a large rectangular ROI over each kidney, a circular ROI within the liver, and a rectangular ROI between the kidneys. Using these ROIs, semiautomated renal ROIs were determined on the basis of the temporal changes in counts, in addition to the absolute counts, and a subrenal background ROI was automatically assigned for each renal ROI. Background-subtracted renograms were generated using these renal and subrenal ROIs, and renogram parameters were derived from the slope of the renogram and the area under the renogram. Clearance was calculated using the renogram parameters and equations determined previously with manual ROIs and correlated with clearance measured by a single-sample method. The relative function of the right kidney determined by the semiautomated method was compared with that determined by the manual method. Data processing was performed independently by another operator to assess interoperator reproducibility. Results: ROIs defined by the semiautomated method were visually judged to be acceptable for clinical use in all patients with a wide range of renal function. Clearance was successfully predicted with the semiautomated ROIs (r = 0.968 using the slope of the renogram; r = 0.934 using the area under the renogram), and relative function calculated with the semiautomated ROIs was almost identical to that calculated with manual ROIs. There was almost complete concordance in absolute and relative function between the two operators. Conclusion: The semiautomated method can define ROIs for 99mTc-MAG3 renal scintigraphy with limited operator intervention. Camera-based methods using the semiautomated ROIs allow estimation of renal function with high accuracy and little interoperator variability and are suggested to be suitable for clinical use.
Measurement of absolute and relative renal function is a major role of dynamic renal scintigraphy. The clearance of 99mTc-mercaptoacetyltriglycine (MAG3) is a relatively new index of renal function, and camera-based methods without blood sampling have been described to calculate 99mTc-MAG3 clearance (CL) (1–7). In camera-based methods, it is necessary to select regions of interest (ROIs) for the kidneys and background areas, a task commonly performed manually by an operator. Determination of manual ROIs needs to be done carefully and imposes a substantial burden on the operator. Moreover, the margin of the kidney is unclear on renal scintigrams because of the reduction of renal thickness in the periphery and the effect of scatter and respiratory movement, and arbitrariness appears to be inevitable in determining the tightness of the renal contour. Interoperator variability in drawing ROIs is a potential source of interoperator and interinstitutional difference in calculating indices of renal function (8–12). Operator dependency can cause a substantial problem, especially in institutes with no physicians or technologists experienced in nuclear nephrology, and it may impair the feasibility and reliability of estimation of renal function from renal scintigraphy.
Although several methods have been reported to decrease operator dependency in selecting ROIs for the estimation of renal function (8–10,13–16), none has been widely accepted as a method of choice in clinical practice. In addition, accuracy in estimating renal function with decreased operator dependency has not been addressed in previous reports. Because the purpose of selecting ROIs in a camera-based method is to quantitate renal function, assessment of the accuracy of estimated renal function seems to be essential in determining the success of defining ROIs.
We have examined the relation between various renogram parameters and CL and described camera-based methods to estimate CL on the basis of the slope of the early part of the renogram (slope method) or the area under the renogram (area method) (7). The ROIs used in the previous study were drawn manually with care by an experienced operator. In this study, we developed a semiautomated method to define ROIs for renal scintigraphy with 99mTc-MAG3 and visually evaluated the quality of the generated ROIs. The semiautomated technique was introduced into our camera-based methods, and the accuracy of calculated CL was examined. The goal of this study was to determine the applicability of camera-based methods combined with the semiautomated ROI definition to the estimation of renal function in clinical practice.
MATERIALS AND METHODS
Subjects
Twenty-one patients (8 men, 13 women; age range, 21–87 y; mean age, 58.0 ± 20.2 y) who underwent renal scintigraphy with 99mTc-MAG3 to evaluate various renal disorders were studied. One patient had a single kidney; all others had two kidneys. Patient data were the same as those used in the previous study (7).
Imaging Procedures
Thirty minutes after the oral intake of 250 mL water, the patient received a bolus injection of 99mTc-MAG3 (250 MBq) in the supine position, and posterior dynamic imaging was performed for 30 min. A total of 80 3-s frames were acquired in a 128 × 128 matrix with a 20% energy window centered at 140 KeV, followed by the collection of 52 30-s frames. The pixel size was 4.74 mm. A gamma camera system (Vertex; ADAC Laboratories, Milpitas, CA) equipped with a low-energy, general-purpose collimator interfaced to a dedicated workstation was used.
The injection syringe was also imaged to estimate injected count. A hollow paper box 20 cm in height was put on the imaging table above the detector head. The syringe was placed on the paper box before and after injection, and data were acquired for 30 s each.
Standard Method
The single-sample method proposed by Bubeck et al. (17) was used as a standard to measure the CL. Forty minutes after tracer injection, venous blood samples were obtained from the arm contralateral to the injection site. The sample was centrifuged, and plasma activity was measured with a well counter. CL normalized for body surface area (BSA) was calculated with the following equations:
 Eq. 1
Eq. 1
 Eq. 2
Eq. 2
 Eq. 3
Eq. 3
 Eq. 4 where ID is injected dose (cps), t is time of blood sampling after injection (min), and Cnt is plasma concentration at time t (cps/L). The BSA was calculated with the equation described by Haycock et al. (18).
Semiautomated ROI Definition
Renal and subrenal background ROIs were generated by a semiautomated method. First, an operator assessed the dynamic images visually and determined the time of tracer arrival in the kidney. Then, data obtained at 1–2.5 min after tracer arrival were added to produce a reference image. The operator placed preliminary ROIs for each kidney, liver, and background area between the kidneys (inter-renal area) on the image (Fig. 1A). A rectangular ROI of 20 × 30 pixels was automatically displayed for each kidney, a circular ROI of 10 pixels in diameter for the liver, and a rectangular ROI of 4 × 10 pixels for the inter-renal area. The operator then moved them to appropriate positions. The preliminary kidney ROI was placed to contain an entire kidney, avoiding the contralateral kidney. The liver ROI was set within the liver, excluding renal activity. The operator placed the inter-renal ROI at the middle position between the renal hila, taking care not to include renal activity. In the patient with a single kidney, the inter-renal ROI was set in the center of the body at the level of the renal hilum. If necessary, the operator adjusted the size of the ROI that was displayed automatically.

Process of defining semiautomated ROIs in patient with CL of 231.5 mL/min/1.73 m2. (A) Preliminary ROIs for kidneys, liver, and background area between kidneys. (B) Intermediary binary image generated with image subtraction. (C) Final binary image. Intersections of diagonals of preliminary kidney ROIs are superimposed. (D) Renal and subrenal background ROIs as final products.
A time–activity curve was generated for the liver ROI with 5-point temporal smoothing, and the peak time for the liver was determined automatically. The image 0–0.75 min after liver peak was subtracted from that 0.75–1.5 min after liver peak, and 25-point spatial smoothing was applied to the obtained image. The kernel used for smoothing was as follows:
 A binary image, termed the intermediary binary image, was produced on the basis of the result of subtraction (Fig. 1B). A pixel in the preliminary kidney ROIs whose value on the subtraction image after smoothing was positive was determined to have a value of 1 on the intermediary binary image, and 0 was assigned for the other pixels.
The mean count in the inter-renal ROI (Cb, counts/pixel) was obtained on the image 1–2.5 min after tracer arrival in the kidney without smoothing. The image 1–2.5 min after tracer arrival with 25-point smoothing was multiplied by the intermediary binary image, and the resulting image was termed the 1- to 2.5-min process image. A threshold count for the right kidney (Tr) was calculated using the following equation:
 Eq. 5where Cmr is the maximal count in the preliminary right kidney ROI on the 1- to 2.5-min process image. A final binary image was produced using the threshold (Fig. 1C). If the count of a pixel in the preliminary right kidney ROI was more than the Tr on the 1- to 2.5-min process image, the value of the pixel was determined to be 1 on the final binary image. Similarly, a threshold for the left kidney was computed, and the pixels in the preliminary left kidney ROI that would have a value of 1 on the final binary image were selected. A value of 0 was assigned for the remaining pixels.
The intersection of the diagonals of each preliminary kidney ROI was displayed on the final binary image (Fig. 1C). The ROI for the right kidney was defined as a continuous area that had a value of 1 on the final binary image and contained the intersection for the preliminary right kidney ROI (Fig. 1D). When the intersection was on a pixel that had a value of 0, the operator moved the intersection to an appropriate point. Similarly, the ROI for the left kidney was selected.
An imaginary ROI was defined as the smallest rectangular ROI to include each renal ROI. A subrenal background ROI that was 4 pixels in height and two thirds of the corresponding imaginary ROI in width was automatically generated (Fig. 1D). The subrenal ROI was located 4 pixels below the imaginary ROI, and the lateral margins of the subrenal and imaginary ROIs had the same abscissa.
In addition, renal and subrenal ROIs were generated by a semiautomated method modified to omit the use of a liver ROI. In producing the intermediary binary image, the image 0.5–1.25 min after tracer arrival in the kidney was subtracted from that 1.25–2 min after tracer arrival. Otherwise, the technique was the same as the original semiautomated method using a liver ROI.
ROI Definition by Threshold Method
Renal ROIs were also defined by a simple threshold method. A preliminary rectangular ROI was placed over each kidney as described for the semiautomated method. The maximal count for each preliminary kidney ROI was determined on the image 1–2.5 min after tracer arrival in the kidney with 25-point smoothing. The threshold was determined as 30% of the maximal count, and a binary image was produced on the basis of the thresholds for the right and left kidneys. When the count of a pixel in a preliminary kidney ROI was more than the threshold for the respective kidney, the value of the pixel was determined to be 1 on the binary image. Renal ROIs were generated on the binary image in the same way as the final selection of renal ROIs in the semiautomated method. In addition, renal ROIs were generated using thresholds of 40% and 50% of the maximal count.
Data Analysis
The quality of renal ROIs defined for each patient by the semiautomated method, the modified semiautomated method, and the simple threshold method was evaluated visually and graded as excellent, good, fair, or poor. The quality of ROIs was graded as excellent when the ROIs were concordant with renal areas identified visually, good when they were closely concordant with renal areas identified visually but showed some minor discrepancy, and fair when there was obvious discrepancy between the ROIs and renal areas identified visually but clinical use was considered permissible. When the generated ROIs were judged unacceptable for clinical use, their quality was graded as poor. The grading was done independently by two observers who were unaware of the method of defining ROIs. In cases of discrepant assessments, the final decision was made by a third observer, taking account of the two preceding assessments.
CL was calculated using the renal and subrenal background ROIs selected by the semiautomated method with a liver ROI. The counting rate (cps) per pixel in the subrenal ROI was multiplied by the number of pixels in the corresponding renal ROI and subtracted from the counting rate in the renal ROI to produce a background-subtracted renogram. The counts in the entire field of view were determined for the preinjection and postinjection syringes and corrected for decay to the injection time. The injected count (Ci) was assessed by subtracting the count for the postinjection syringe from that for the preinjection syringe and expressed as cpm. The depth of each kidney (D [cm]) was calculated with the equations of Taylor et al. (19) for attenuation correction, and the attenuation factor was determined as e−0.12 × D.
The slope method and the area method were used to calculate CL from the renogram. For the slope method, the slope of the background-subtracted renogram (cps/s) was determined at 0.5–2 min after tracer arrival in the kidney by linear regression analysis. Slope index (SI) was calculated with the following equation:
 Eq. 6 where Sr and Sl are slopes calculated from the right and left renograms at 0.5–2 min, respectively, and AFr and AFl are attenuation factors for the right and left kidneys, respectively.
For the area method, renal accumulation at 1–2.5 min was calculated as area under the background-subtracted renogram and expressed as cpm. The percent renal uptake (RU) was computed as follows:
 Eq. 7where Car and Cal are accumulation at 1–2.5 min in the right and left kidneys, respectively.
The equation used to convert the SI or RU to CL was determined with manual ROIs in the previous study (7). The equation for the SI at 0.5–2 min using the subrenal background is as follows:
 Eq. 8and that for the RU at 1–2.5 min using the subrenal background is:
 Eq. 9In this study, these equations were used to predict CL from the SI or RU obtained with the semiautomated ROIs. Predicted CL was compared by linear regression with that measured by the single-sample method to evaluate accuracy in assessing absolute renal function using the semiautomated technique.
Relative renal function was estimated in 20 patients who had both kidneys. Relative function of the right kidney (%RK) was calculated using the following equation in the slope method:
 Eq. 10and with the following equation in the area method:
 Eq. 11
Because standard values of %RK were not available, %RK obtained using the semiautomated ROIs was correlated by linear regression with that obtained using manual ROIs in the previous study (7). In the manual technique, the slope at 0.5–2 min and the renal accumulation at 1–2.5 min were computed using the subrenal background, and the %RK was determined.
Semiautomated ROIs were defined independently by the second operator. CL and %RK determined by the semiautomated technique were compared between the two operators to evaluate interoperator reproducibility in assessing absolute and relative renal function. Both the slope method and the area method were used for the calculation of the CL and the %RK.
RESULTS
Visual Assessment
In defining semiautomated ROIs, the shape of the liver ROI had to be adjusted in one patient. In the other patients, placement of preliminary ROIs was attained by simply moving the ROIs that were displayed automatically. The intersection of the diagonals of the preliminary renal ROI was transferred for one kidney in selecting a renal ROI on the final binary image.
The results of visual evaluation of the quality of defined ROIs are presented in Table 1. CL measured by the single-sample method had a wide range, from 17.5 to 320.0 mL/min/1.73 m2. The semiautomated method provided ROIs acceptable for clinical use in all patients, including those with high, low, and asymmetric renal function (Fig. 2). The quality of ROIs was graded as excellent in 13 patients, good in 4, fair in 4, and poor in none. The quality was graded as excellent in patients with high renal function, and excellent results were also obtained in 2 of 5 patients with measured CL of <100 mL/min/1.73 m2 (Fig. 3A). ROIs generated by the modified semiautomated method with no liver ROI were judged to be acceptable for clinical use in 20 (95%) of 21 patients. The quality was graded as poor in one patient, who had liver damage. In this patient, hepatic activity decreased slowly after a delayed peak, and the ROI for the right kidney contained a large area of the liver. There was no statistically significant difference in the results of grading between the semiautomated method and the modified semiautomated method (sign test, P > 0.05).

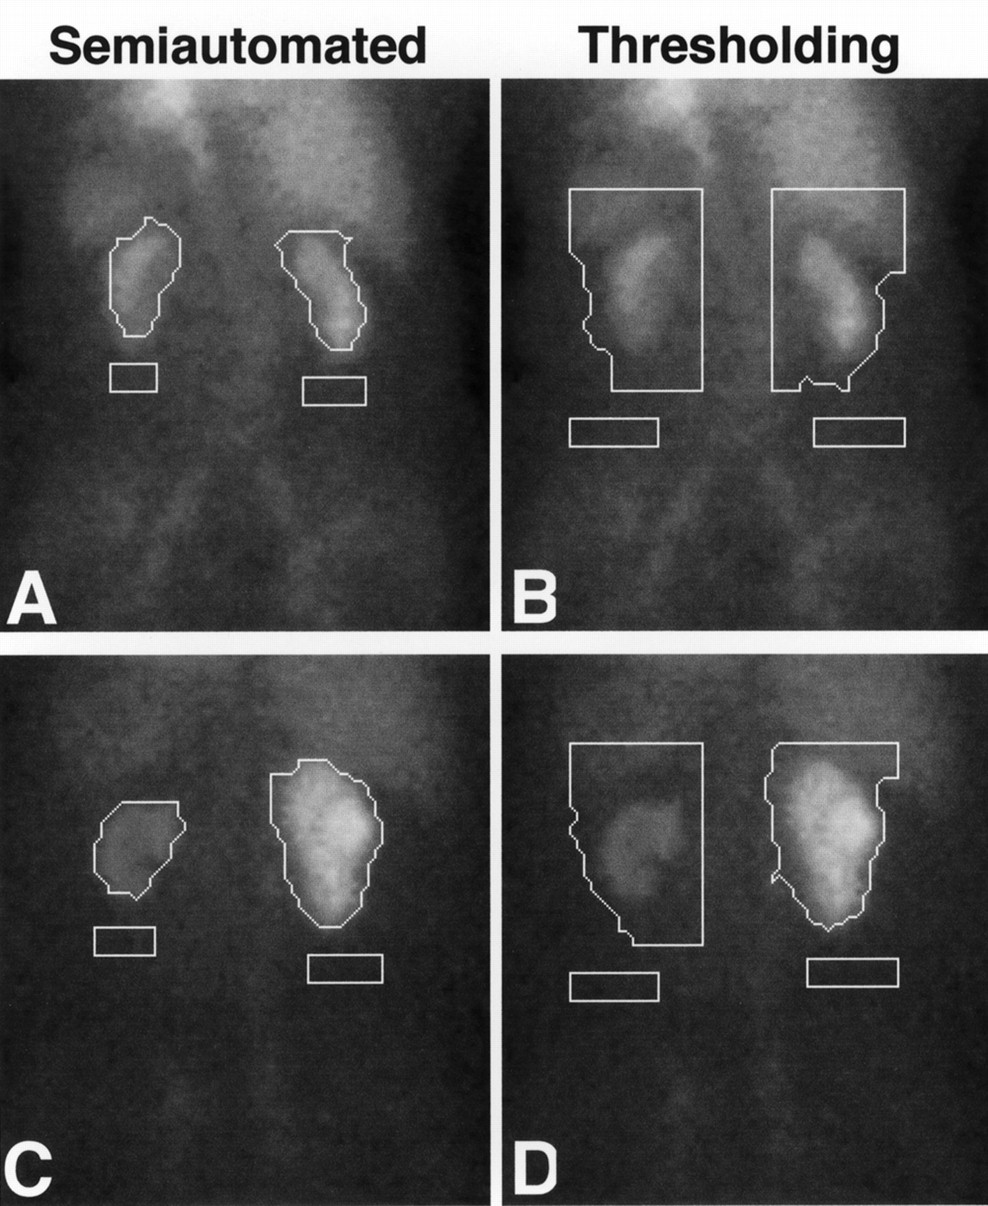
Examples of ROIs defined by semiautomated method and simple threshold method with 30% threshold. Qualities of semiautomated (A) and threshold (B) ROIs in patient with CL of 17.5 mL/min/1.73 m2 were graded as fair and poor, respectively. Semiautomated (C) and threshold (D) methods provided good and poor results, respectively, in patient with CL of 79.9 mL/min/1.73 m2 and relative hypofunction of left kidney. Use of simple threshold overestimates renal area, especially for left side.

Visual grading and CL measured by single-sample method. (A) Semiautomated method. (B) Simple threshold method with 30% threshold.
Visual Grading of Quality of Renal ROIs
ROIs defined by the simple threshold method with a threshold of 30% were judged to be acceptable for clinical use in 11 of 21 patients (52%), and the quality was graded as poor in the remaining 10 patients. The grading results obtained by the method using a 30% threshold were significantly worse than those obtained by the semiautomated method or the modified semiautomated method (P < 0.0001 for both methods). The quality of ROIs was graded as poor in all patients with measured CL of <100 mL/min/1.73 m2 (Fig. 3B). The ROIs assigned for kidneys of low function tended to be too large and to include the liver and spleen. The simple threshold methods with thresholds of 40% and 50% provided ROIs acceptable for clinical use in 3 of 21 patients (14%) and no patients, respectively, and were inferior to the method with a 30% threshold (P < 0.01 and P < 0.001, respectively). The generated ROIs were too large for hypofunctional kidneys and too small for kidneys of high function.
Prediction of Clearance
CL was successfully predicted from the SI or RU calculated using the semiautomated ROIs (Fig. 4). Correlation coefficients between predicted and measured CLs were high (0.968 for the slope method and 0.934 for the area method), and the regression lines were close to the identical line. The %RK calculated from the slope at 0.5–2 min did not differ substantially between the semiautomated and the manual techniques (Fig. 5A). Similarly, the %RK obtained with the semiautomated technique was almost identical to that obtained with the manual technique when the %RK was calculated from renal accumulation at 1–2.5 min (Fig. 5B). There was almost complete concordance in both CL (Fig. 6) and %RK (Fig. 7) between the two operators, indicating excellent interoperator reproducibility in assessing absolute and relative renal function.

CL measured by single-sample method and predicted with semiautomated ROIs. SI at 0.5–2 min was used in predicting CL by slope method (A), and RU at 1–2.5 min was used for area method (B). Solid and broken lines represent identical line and regression line, respectively.

%RK obtained with manual ROIs and semiautomated ROIs. %RK was calculated by slope method (A) or area method (B). Solid and broken lines represent identical line and regression line, respectively.

CL predicted with semiautomated ROIs defined by 2 operators. CL was calculated by slope method (A) or area method (B). Solid line represents regression line.

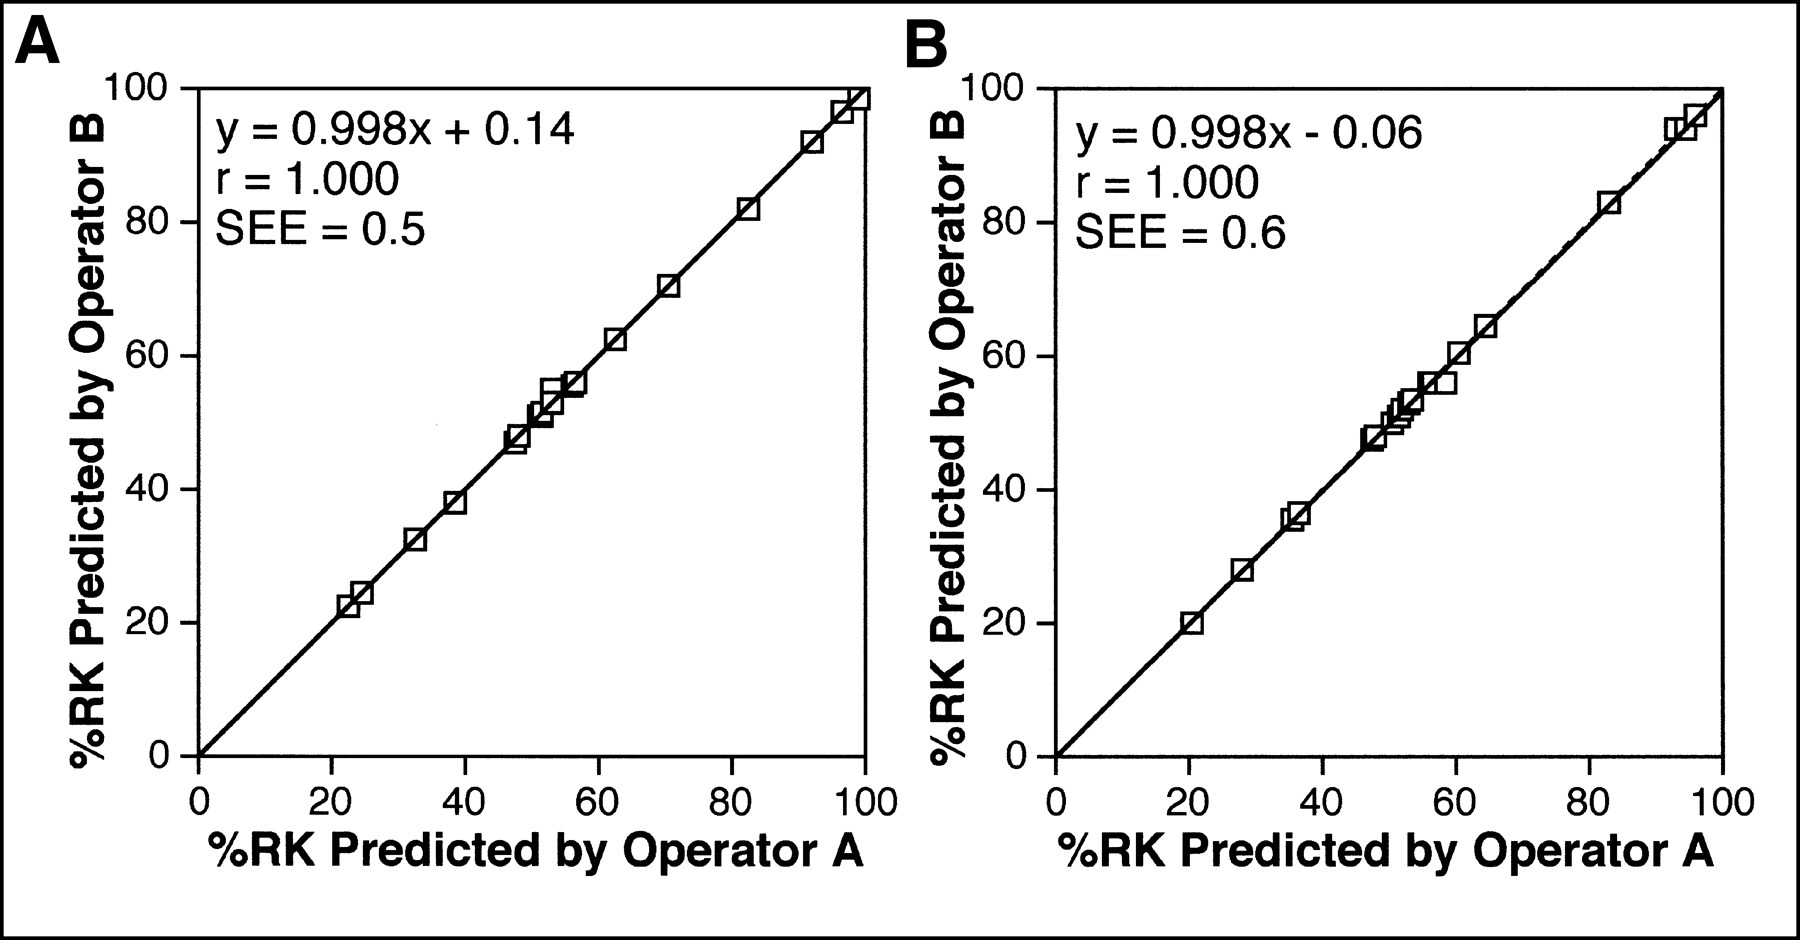
%RK predicted with semiautomated ROIs defined by 2 operators. %RK was calculated by slope method (A) or area method (B). Solid line represents regression line.
DISCUSSION
Simple threshold methods are based on a threshold determined from the maximal renal count and require minimal intervention by an operator. In this study, ROIs were selected by simple threshold methods using 30%, 40%, and 50% thresholds. The threshold method using a 30% threshold provided the best results but failed to define ROIs acceptable for clinical use, especially in patients with reduced renal function. The kidney-to-background contrast at the early phase of renal scintigraphy is low in patients with renal impairment, and use of a simple threshold tends to overestimate renal area. High-count organs such as the liver and spleen are liable to be included in renal ROIs, which may cause serious errors in calculated CL. Use of a simple threshold method appears to be inappropriate to select renal ROIs in patients with a wide range of renal function.
Our method of semiautomated ROI definition uses temporal changes in counts, in addition to absolute counts, and consists of two steps: image subtraction and threshold processing. In the early period of dynamic renal scintigraphy, renal counts increase and background counts decrease. On the basis of the temporal changes, image subtraction removes high-count extrarenal organs such as the liver, spleen, and great vessels from renal ROIs. Overlapping between the liver and right kidney is common and is intensified by the effect of scatter and respiratory movement. This overlapping makes appropriate separation of the liver from the right kidney difficult. In our method, a pixel is included in the right kidney ROI when temporal change in the activity of the right kidney is the dominant factor determining temporal change in the value of the pixel. Counts in low-count background areas do not necessarily decrease in the period used for image subtraction, and part of the low-count background areas remains after subtraction. Threshold processing is performed to remove the residual low-count background. The threshold count is determined considering not only maximal renal count but also count in the background area so that the threshold can be applied to patients with various levels of renal function.
Displaying generated ROIs on a renal scintigram is not essential for data processing; however, display aids in visually evaluating the quality of the ROIs. The semiautomated method defined ROIs acceptable on visual inspection in all patients, including those with reduced renal function. Absolute renal function was successfully predicted using the generated ROIs, and the estimates of relative function were comparable with those obtained using ROIs drawn manually. Excellent interoperator reproducibility was observed in assessing absolute and relative renal function. The semiautomated method presented in this article can provide ROIs suitable for clinical use with limited operator intervention and appears to improve the feasibility of reliable estimation of renal function.
In a previous study, the equations used to convert renogram parameters, SI and RU, to CL were determined using manual ROIs (7). Although a different method of ROI definition may necessitate different equations, CL was successfully predicted using the equations determined in the previous study and renogram parameters obtained with semiautomated ROIs. This held true for both the slope method and the area method. Because the same equations can be used to calculate CL, the use of manual ROIs for patients in whom the semiautomated method fails to generate satisfactory ROIs would not cause a substantial problem in computing and interpreting CL.
Count in the renal ROI is the sum of the true renal count and the background count, and background correction is commonly required to estimate renal function by a camera-based method. Although a perirenal ROI has been found to better represent the actual background in the renal ROI (20–22), a subrenal ROI was used for background correction in this study. We selected subrenal ROIs because the mean count in a subrenal ROI was thought to be less susceptible to the quality of the corresponding renal ROI than that in a perirenal ROI. Selection of the type of background ROIs was found to have little effect on the accuracy of calculated CL in our previous study (7). The use of subrenal ROIs appears to be justifiable in estimating renal function from 99mTc-MAG3 renal scintigraphy.
We imaged the injection syringe with the gamma camera to estimate injected count. The counting rate in imaging the preinjection syringe is high, resulting in a relatively large dead-time count loss, and dead-time correction is often applied to the estimation of the injected count when assessing renal function by camera-based methods (4,23–25). Dead-time count loss also occurs during dynamic renal scintigraphy. Whereas count loss in estimating the injected count causes overestimation of fractional renal accumulation, loss in dynamic imaging causes underestimation and in part compensates for the effect of loss in imaging the syringe. We have found that correction for count loss only in estimating the injected count does not improve the accuracy of assessing fractional renal accumulation (26), and thus no dead-time correction was performed in this study.
In our semiautomated method, a preliminary ROI is placed within the liver, and peak time for the liver is obtained. The frames to be used for image subtraction are determined on the basis of the liver peak so that the liver is sure to be removed from the renal ROI. The semiautomated method provided better results on visual evaluation in some patients than did the method modified to omit the liver ROI; however, the benefit gained with a liver ROI seemed to be small. Whether the liver ROI is substantially helpful remains to be determined.
Only a small number of patients were examined in this study. Further validation should be done in patients with a variety of morphologies and differing function. To accurately estimate renal function using empiric equations, the tightness of the definition of renal contour should be comparable with that in the institution where the equations were developed. This is not warranted when ROIs are drawn manually, and determination of empiric equations may be required for each institution. Improved interinstitutional reproducibility is inferred to be a merit of reduced operator dependency. A multicenter trial appears warranted to assess the accuracy and clinical usefulness of the camera-based method combined with semiautomated ROIs.
CONCLUSION
We described a semiautomated method to select ROIs for dynamic renal scintigraphy with 99mTc-MAG3. The method defined visually acceptable ROIs with limited operator intervention, and camera-based methods using the semiautomated ROIs allowed estimation of renal function with a high level of accuracy and negligible interoperator variability. Semiautomated ROI definition is expected to enhance the feasibility of reliable estimation of renal function by a camera-based method.
Acknowledgments
The authors thank Koichi Nitta (Sumitomo Metal Industries, Ltd.) for his valuable support and also thank Kyohito Iida, Shojiro Koyama, and Masaru Kashima for their assistance.
Footnotes
Received Dec. 28, 1999; revision accepted May 5, 2000.
For correspondence or reprints contact: Yusuke Inoue, MD, Department of Radiology, Institute of Medical Science, University of Tokyo, 4-6-1 Shirokanedai, Minato-ku, Tokyo 108-8639, Japan.
REFERENCES
In this issue


Jump to section
Related Articles
Cited By...
- No citing articles found.