


Abstract
Proposed renal hemodynamic mechanisms of captopril suggest that quantitation of renographic retention parameters should help identify patients suspected of having renovascular disease. The parenchymal mean transit time (MTT) is theoretically superior to other measures of retention, but data supporting its superiority are few. Methods: Two groups of subjects were studied with diethylenetriamine pentaacetic acid (DTPA) baseline and captopril renography, one (n = 43) with demographically defined essential hypertension (group I) and the other (n = 60) with a high prevalence of renovascular disease (group II). Abnormal parenchymal MTT values were derived from the statistical confidence limits of group I data and then applied to group II subjects for comparison with angiographic results. Results: Depending on the sensitivity of the threshold chosen, specificity varied, but the overall accuracy of baseline parenchymal MTT for renovascular hypertension detection ranged from 54% to 58%. Change in parenchymal MTT (post-captopril − pre-captopril) accuracy was 55%–61% and was not significantly different. Neither method improved on previously reported quantitative or qualitative criteria. Group II subjects had significantly worse renal function than did group I subjects, and 23% had nondiagnostic renograms. Conclusion: Parenchymal MTT analysis of DTPA captopril renography is not more accurate and offers no advantages compared with qualitative renography or with more commonly used renographic measures in our subjects. This may relate to the high prevalence of renal dysfunction in our population. In subjects with renal dysfunction, the low sensitivity and the trend toward low specificity of parenchymal MTT do not support its routine use for the evaluation of renovascular disease among patients suspected of having renovascular hypertension.
Substantial consensus has emerged in defining qualitative and quantitative criteria for the diagnosis of renovascular hypertension (RVH) using captopril renography (1,2). However, no quantitative criteria have been found to be superior to qualitative evaluation. In view of proposed renal mechanisms of captopril in RVH, measures of parenchymal retention of tracer might be expected to perform as well or better than other quantitative parameters. Parenchymal retention parameters that have been examined most thoroughly are the time to peak activity (Tpk) and ratios of renal activity at 20 or 30 min to peak activity (20/Pk and 30/Pk, respectively). These are relatively crude measures of renal parenchymal transit and retention and have performed no better than qualitative evaluation (2). The parenchymal mean transit time (MTT), in principle, is a more representative and sensitive measure of delays in parenchymal transit. In practice, however, the clinical value of the MTT is uncertain. Most reports, including the consensus report on captopril renography, have provided ambiguous or conflicting recommendations with respect to parenchymal MTT analysis (1,3–7). Our objective was to evaluate parenchymal MTT in the diagnosis of renal vascular disease among subjects suspected of having RVH.
MATERIALS AND METHODS
Subjects
Patients were enrolled in the Albert Einstein College of Medicine/Cornell University Medical Center prospective study of captopril renography, which has been described (2,8,9). In brief, normative values of quantitative and qualitative captopril renography were derived from a group of 43 mildly hypertensive subjects (mean age, 59 y; range, 35–71 y), serum creatinine levels < 1.8 mg/dL (mean, 1.0 + 0.2 mg/dL), who were demographically >99% likely to have essential hypertension (9) (group I). Secondary hypertension was excluded by previous history, physical examination, follow-up, and other clinical variables.
A second group, comprised of 84 subjects with more severe hypertension, had a high prevalence of renal artery stenosis (RAS) (group II). After exclusions, 60 of these subjects underwent a complete study, including baseline and captopril-stimulated renography, the in vitro captopril test, and arteriography.
Methods
Radionuclide renography was done supine, gamma camera underneath, with simultaneously administered 99mTc–diethylenediamine pentaacetic acid (DTPA) and 131I-orthoiodohippurate (OIH). After hydration, 185 MBq (5 mCi) 99mTc-DTPA and 5.5 MBq (150 μCi) 131I-OIH were given intravenously for the baseline study. One hour after the baseline injection, 25 mg captopril were given orally. Sixty minutes after administration of captopril, 370 MBq (10 mCi) 99mTc-DTPA and 11.1 MBq (300 μCi) 131I-OIH were injected. A medium-energy collimator on a model 409AT digital gamma camera (Elscint Ltd., Haifa, Israel) was used to acquire both the 140-keV 99mTc photopeak and the 364-keV 131I γ peak. Dual isotope acquisition was performed at 3-s intervals for 8 min and at 30-s intervals for 22 min with a 64 × 64 pixel matrix. Kidneys and heart were included within the field of view.
Limits on injected activity of OIH necessarily restricted our analysis of MTT to data derived from 99mTc-DTPA injections. Within the 140-keV channel, downscatter from the 131I emissions constituted <3% of the total count rate.
MTTs of whole kidney and cortex were measured using a matrix method of deconvolution (9–11). The input function for deconvolution analysis was generated from the left ventricular region of interest (ROI), and the output function was the renogram curve derived from either a whole kidney or renal cortical ROI. Parenchymal MTT was calculated to reduce the effect of renal pelvic urinary retention.
Quantitative and Statistical Analysis
Abnormal values for parenchymal MTT were established using methods similar to those reported previously (2,8). Using group I subjects (i.e., those without RVH), mean values and the SDs of parenchymal MTT were determined for baseline and post-captopril studies as well as for the difference between post- and pre-captopril parenchymal MTT. Because an increase in parenchymal MTT after captopril is expected in studies positive for RVH, 1-tailed limits for change were used, which required an increase of 1.64 SDs to define a change with 95% confidence and an increase of 1.28 SDs for 90% confidence. Abnormal was defined to lie in excess of these upper limits.
The Wilcoxon signed rank test was used for comparison of pre- versus post-captopril paired data. Pooled data for group II versus group I subjects were compared using Mann-Whitney U testing. Contingency tables of true-positive, true-negative, false-positive, and false-negative results were evaluated by χ2 analysis. Comparison between contingency tables was performed by calculating χ2 heterogeneity.
The subject of this report is the quantitative statistical analysis of parenchymal MTT in group II subjects, using group I parenchymal MTT values to define the normal range. The statistical analysis of qualitative renography and other quantitative renographic parameters in group I and group II subjects has been reported (2).
RESULTS
Characteristics of group I and group II subjects are compared in Table 1. There was no significant difference in age between groups. Basal renal function (creatinine clearance and serum creatinine concentration) was significantly worse in group II (P < 0.01). The systolic and diastolic blood pressure and prevalence of RVH were higher in group II (P < 0.01).
Characteristics of Group I and Group II Subjects
Whole-Kidney Versus Cortical MTT Data
We have noted previously that ∼20% of group I subjects have abnormal, qualitatively observed, pelvic retention (PR) after captopril administration (12). In this subgroup of subjects (n = 17), the whole kidney MTT is prolonged (5.010 ± 0.66) in comparison with subjects (n = 55) without PR (4.177 ± 0.93) (P < 0.002). In contrast, no significant difference in cortical (parenchymal) MTT is observed after captopril in the 17 kidneys with PR (3.715 ± 0.50) compared with the 55 kidneys without PR (3.381 ± 0.68) (P > 0.05). As a result, all subsequent MTTs are understood to represent data from cortical ROIs.
The parenchymal MTT among all baseline group I kidneys (n = 80 kidneys for 40 evaluable subjects) is 2.79 ± 0.70 and for all post-captopril group I kidneys is 3.44 ± 0.68 (P > 0.05) (Table 2).
Group I vs. Group II: Parenchymal MTT ± SD (min)
Exclusions from Parenchymal MTT Quantitation
Among group II subjects with angiograms and complete captopril studies (n = 60), there were 41 subjects with positive angiograms (25 bilateral, 16 unilateral). Fifteen of these 41 subjects were excluded from quantitative analysis (12 bilateral, 3 unilateral) because of renogram curves that were indistinguishable from blood background. Four more were excluded (2 bilateral, 2 unilateral) because of technical problems.
Among group II subjects with normal bilateral angiograms (n = 19), 3 were excluded because of blood background curves, and 1 was excluded for technical reasons.
Therefore, renograms were available for quantitative parenchymal MTT in 22 subjects with positive angiograms, of whom 11 had bilateral disease and 11 had unilateral disease, for a total of 33 kidneys with positive angiograms.
Similarly, the 11 normal kidneys from subjects with unilateral disease plus the 15 subjects with bilateral negative angiograms (consisting of 30 kidneys) resulted in a total of 41 kidneys with negative angiograms.
Quantitative Parenchymal MTT Evaluation
Neither baseline MTT nor post-captopril MTT or the change in MTT differed significantly (P > 0.05) between group I and group II subjects (Table 2).
In comparing baseline parenchymal MTT, division of group II subjects into those with positive or negative angiograms or with unilateral or bilateral disease (or both) did not disclose any significant subgroup distinctions. Statistically significant differences were not found for post-captopril parenchymal MTT or the change in parenchymal MTT among these subgroups (not shown).
Establishment of Criteria for Abnormal Parenchymal MTT
Upper thresholds for baseline parenchymal MTT and the change in parenchymal MTT were established from the group I data (Table 2). The 90% confidence limit for the upper normal range (3.69 min) was calculated as lying within 1.28 SDs of the group I mean. Similarly, 1.64 SDs above the group I mean resulted in an upper 95% confidence limit of 3.94 min. A more sensitive threshold of 3.00 min was chosen arbitrarily, at a confidence limit of <50%.
Thresholds were calculated similarly for the change in parenchymal MTT after captopril administration at 1.49, 1.73, and 0.85 min for the 90%, 95%, and <50% thresholds, respectively.
Identification of Renovascular Disease Using Abnormal Parenchymal MTT Versus Angiographic Standard
The quantitative criteria were applied to all interpretable group II renograms to define each as positive or negative for RAS. The accuracy, sensitivity, and specificity of an abnormal change in parenchymal MTT versus angiography are displayed in Table 3. The most sensitive threshold (0.85 min) resulted in an accuracy per kidney of 61% (45 true diagnoses of 74 angiograms), a sensitivity of 27% (9 true-positive studies of 45 positive angiograms), and a specificity of 88% (36 true-negative studies of 41 negative angiograms). The least sensitive (most specific) threshold (1.73 min) resulted in an accuracy of 55%, a sensitivity of 12%, and a specificity of 90%. No statistically significant difference was found in diagnostic performance among the thresholds.
Diagnosis of RAS: Abnormal Change in Parenchymal MTT Post-Captopril vs. Angiographic Standard
Analysis of the results by patient rather than by kidney gave a sensitivity of 23% (5 true-positive/22 positive), a specificity of 87% (13 true-negative/15 negative), and an accuracy of 49% (18 correct/37 total) at the 90% threshold. At the 95% threshold, the accuracy was 46% (17/37); at the <50% threshold, the accuracy was 49% (18/37).
The diagnostic performance of an abnormal baseline parenchymal MTT versus angiography for the most sensitive threshold (3.00 min) resulted in a 54% accuracy (among kidneys), a sensitivity of 55%, and a specificity of 37%. The least sensitive (most specific) threshold (3.94 min) resulted in an accuracy of 58%, a sensitivity of 27%, and a specificity of 83%. None of the contingency tables of varying thresholds was statistically different from each other by evaluation of χ2 heterogeneity (P > 0.05). The accuracies for these thresholds when analyzed by patient were 59% (22/37), 54% (20/37), and 54% (20/37), respectively.
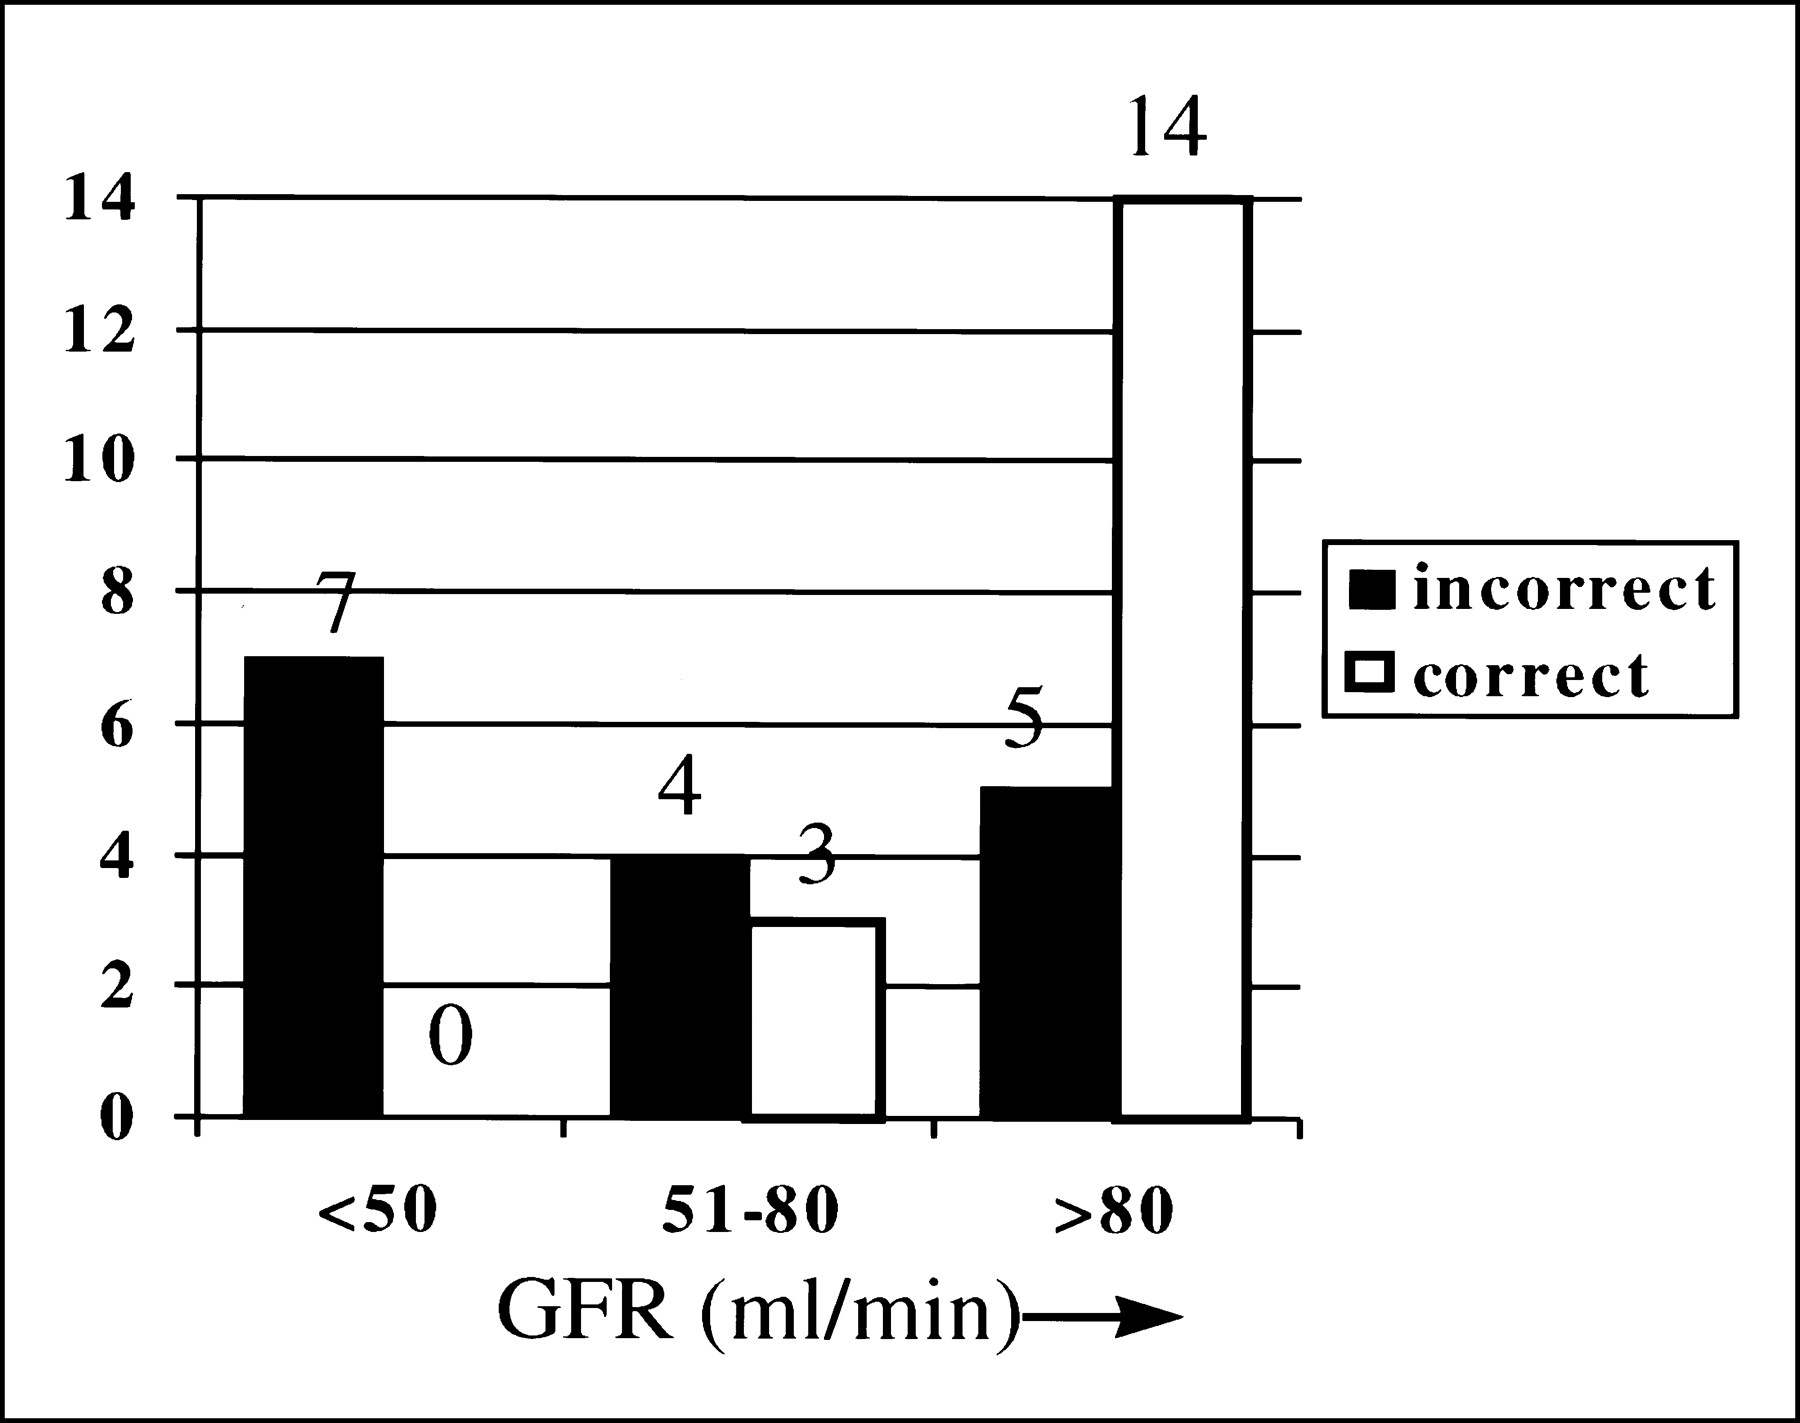
Using the change in parenchymal MTT (ΔMTT), the total number of correct patient studies among those with calculable MTT (true-positive + true-negative) versus incorrect studies (false-positive + false-negative) shows a clear trend toward decreased accuracy with decreasing renal function (Fig. 1). For glomerular filtration rate (GFR) <50 mL/min, no correct studies were identified for 7 subjects, whereas 14 of 19 studies were correct for GFR >80 mL/min and 4 of 7 studies were correct for GFR in the intermediate range (50–80 mL/min). A similar relationship was observed using baseline parenchymal MTT to evaluate for RAS (not shown).

Increase in parenchymal MTT after captopril administration is more accurate in predicting RAS in patients with higher glomerular filtration rate (GFR). Seven of 7 subjects with GFR <50 mL/min had incorrect examinations, whereas 14 of 19 studies were correct in subjects with GFR >80 mL/min.
DISCUSSION
In our previous evaluation of qualitative and quantitative captopril renography in the same patient populations as in this study, we found an accuracy of 43% for qualitative DTPA renography, tending toward improvement (although insignificant) to 63% with supplemental in vitro captopril-stimulated peripheral plasma renin testing (2). Quantitative renographic measures (Tpk, 20/Pk, 30/Pk, and relative renal uptake) ranged in accuracy from 48% to 54%. No quantitative or qualitative criterion showed a statistically significant advantage. However, all techniques shared a low false-positive rate (high specificity), an important consideration in attempting to identify patients with suspected RVH, a disease of low prevalence.
There are theoretic advantages of parenchymal MTT compared with other renographically derived measures of renal parenchymal retention such as 20/Pk, 30/Pk, and Tpk. Technical problems resulting from poor intravenous injections may cause delays in the latter 3 measures that would falsely be considered delays in transit or parenchymal retention. Parenchymal MTT, because it calibrates an intravenous injection against the cardiac arterial input function, would be expected to reduce these kinds of false-positive studies. Alternatively, parenchymal delay may be detected by prolongation only of Tpk or only of 20/Pk (or 30/Pk) on renogram curves. Parenchymal MTT, which, more inclusively, mathematically integrates all kinds of parenchymal retention, might be expected to detect either of these kinds of parenchymal transit delays and, therefore, should demonstrate more true-positive studies than either Tpk or 20/Pk alone. Improvements in both true-positive rates and false-positive rates should be reflected by improved accuracy.
Despite these theoretic advantages of parenchymal MTT, we were unable to show a clinical advantage of parenchymal MTT compared with the more widely used renographic parameters. The range of diagnostic accuracy in the present study was 46%–49% for patients and 55%–61% for kidneys, using various thresholds of change in parenchymal MTT as the criteria for a positive study. Similarly, the range of accuracy was 54%–59% for patients and 54%–58% for kidneys, using baseline parenchymal MTT for the diagnostic criterion. These values were not statistically different from each other or from our previously reported values using the more widely used renographic parameters in the same subjects. Furthermore, the parenchymal MTT tended toward more false-positive studies than the other diagnostic criteria we reported previously (2). Our results agree with those of Russell et al. (4), which indicate no diagnostic advantage of parenchymal MTT for captopril renography compared with Tpk, 20/Pk, or 30/Pk.
Gruenwald et al. (13,14), using methods similar to ours to determine MTT (10,11), report a sensitivity of 78% using parenchymal MTT for the prediction of RVH from clinical follow-up data of angioplasty in 31 patients with documented RAS (14). Because all patients studied had RAS, the selection bias makes it impossible to determine test specificity. Similarly, Rutland and Stuart (15) also report only on patients with documented RAS. These studies do not address the clinical problem of attempting to diagnose RVH from among patients with a variety of clinical presentations.
It is possible that the high proportion of subjects with renal dysfunction may be partially responsible for our results. Figure 1 showed decreasing accuracy of the change of parenchymal MTT with declining GFR. Parenchymal ΔMTT correctly predicted RAS in 14 of 19 subjects with GFR >80 mL/min but in 0 of 7 subjects with GFR <50 mL/min and a total of 4 of 14 with GFR <80 mL/min. Previously, we reported a similar decline in diagnostic accuracy of 20/Pk and Tpk with decreasing GFR (2). An additional 18 group II subjects were excluded from analysis because of renal dysfunction severe enough to cause the renogram to resemble a blood-pool disappearance curve. Therefore, among 32 subjects with GFR <80 mL/min, only 4 had correctly interpretable studies.
The statistical uncertainties and mathematic artifacts that arise when transit time calculations are performed also may compound the poor results in our subjects. These kinds of errors can be magnified in subjects with renal dysfunction. The matrix method of parenchymal MTT calculation produces reproducible results in individuals with normal renal function (10). It is less clear that precision is as good in subjects with renal dysfunction (11,13), even with 185 and 370 MBq (5 and 10 mCi) of injected activities of DTPA. Furthermore, the mathematic requirements for accurate deconvolution of renograms with high background activity and incomplete transit, as found in many subjects with renal insufficiency, are poorly defined (10). Our method of deconvolution has been shown to improve on the noise propagation usually found in matrix methods (10,11,13). We were able to analyze the parenchymal MTT in subjects with renal dysfunction more reproducibly with our modification (10) of Diffey et al. (11) than with the unmodified technique.
Following Whitfield et al. (16), Russell et al. (17) found the dispersion of intrarenal transit times to be a better discriminant of RAS than the parenchymal MTT itself. We have not evaluated the dispersion of parenchymal MTT in our data, but it would be important to confirm the results of Russell et al. in subjects with renal dysfunction.
We were unable to perform transit time analysis with a tubular agent because of the necessary limitation on injected activity of simultaneously administered 131I-OIH (5). It is possible that results would differ if 99mTc-labeled mercaptoacetyltriglycine were used.
In our subjects, parenchymal MTT without captopril stimulation had no greater diagnostic usefulness than other reported quantitative or qualitative measures of parenchymal transit. The addition of captopril stimulation caused no improvement.
CONCLUSION
Parenchymal MTT analysis of DTPA captopril renography is not more accurate and offers no advantages compared with qualitative renography or with more commonly used renographic measures in our subjects. This may relate to the high prevalence of renal dysfunction in our population. In subjects with renal dysfunction, parenchymal MTT may complement other techniques of renal functional assessment. However, the low sensitivity and the trend toward low specificity do not support a unique role for parenchymal MTT analysis in the evaluation of patients suspected of having RAS as the cause of their hypertension.
Acknowledgments
This work was supported in part by National Heart, Lung, and Blood Institute 5RO1 HL40566 and 5RO1 HL30163 grants.
Footnotes
Received Sep. 14, 1999; revision accepted Mar. 8, 2000.
For correspondence or reprints contact: Eugene J. Fine, MD, Department of Nuclear Medicine, Jacobi Medical Center, BN13, Pelham Pkwy. and Eastchester Rd., Bronx, NY 10461.


