


Abstract
The objective of this study was to compare MRI response assessment with metabolic O-(2-18F-fluoroethyl)-L-tyrosine (18F-FET) PET response evaluation during antiangiogenic treatment in patients with recurrent high-grade glioma (rHGG). Methods: Eleven patients with rHGG were treated biweekly with bevacizumab–irinotecan. MR images and 18F-FET PET scans were obtained at baseline and at follow-up 8–12 wk after treatment onset. MRI treatment response was evaluated by T1/T2 volumetry according to response assessment in neurooncology (RANO) criteria. For 18F-FET PET evaluation, an uptake reduction of more than 45% calculated with a standardized uptake value of more than 1.6 was defined as a metabolic response (receiver-operating-characteristic curve analysis). MRI and 18F-FET PET volumetry results and response assessment were compared with each other and in relation to progression-free survival (PFS) and overall survival (OS). Results: At follow-up, MR images showed partial response in 7 of 11 patients (64%), stable disease in 2 of 11 patients (18%), and tumor progression in 2 of 11 patients (18%). In contrast, 18F-FET PET revealed 5 of 11 metabolic responders (46%) and 6 of 11 nonresponders (54%). MRI and 18F-FET PET showed that responders survived significantly longer than did nonresponders (10.24 vs. 4.1 mo, P = 0.025, and 7.9 vs. 2.3 mo, P = 0.015, respectively). In 4 patients (36.4%), diagnosis according to RANO criteria and 18F-FET PET was discordant. In these cases, PET was able to detect tumor progression earlier than was MRI. Conclusion: In rHGG patients undergoing antiangiogenic treatment, 18F-FET PET seems to be predictive for treatment failure in that it contributes important information to response assessment based solely on MRI and RANO criteria.
- recurrent high-grade glioma
- antiangiogenic treatment
- MRI response criteria
- 18F-FET PET response assessment
High-grade gliomas (HGGs) are highly aggressive primary brain tumors, with an incidence of 7–8 per 100,000 people per year. Despite combination therapy including surgery, radiation, and temozolomide chemotherapy, these tumors have a dismal prognosis (1). A major reason for the aggressiveness of HGG is a pronounced tumor neovascularization, mainly driven by the vascular endothelial growth factor (VEGF) pathway (2). The newly formed tumor vessels are characterized by structural and functional abnormalities, prompting an increase in blood–brain barrier (BBB) permeability (3). A main treatment hypothesis is that tumor progression can be arrested by inhibiting proangiogenic proteins (4). In recurrent HGG (rHGG), bevacizumab (Avastin; Genentech/Roche), a humanized monoclonal antibody inhibiting the biologic activity of VEGF, is used as a single antiangiogenic agent or in combination with chemotherapy (e.g., irinotecan) (5).
Antiangiogenic treatment targeting the VEGF pathway causes a rapid decrease in T1 contrast-enhancing (cT1) tumor parts, with high radiographic response rates ranging between 30% and 63% (5). This decrease is largely due to a pseudonormalization of abnormal BBB permeability followed by a reduction in tumor edema. Therefore, antiangiogenic therapy causes difficulties in distinguishing between antivascular and true antitumor effects when using standard MRI Macdonald criteria (6,7). To define a more precise tumor response assessment, the response assessment in neurooncology (RANO) criteria, which incorporate nonenhancing T2/fluid-attenuated inversion recovery (FLAIR) sequences into standard Macdonald criteria, were recently published (8).
Radiolabeled amino acid tracers for PET constitute an innovative class of tumor-imaging agents (9). These tracers are particularly attractive for imaging glial brain tumors because of the high uptake in glioma cells and the low uptake in normal brain tissue. One of the most promising tracers is O-(2-18F-fluoroethyl)-L-tyrosine (18F-FET), whose diagnostic potential in brain tumors is already well documented. To date, it is known that 18F-FET PET in combination with MRI improves the diagnostic assessment of cerebral glioma for neurosurgery and radiotherapy planning and might help to distinguish tumor recurrence from posttherapeutic changes (10,11). However, the role of 18F-FET PET in the course of antiangiogenic treatment has not been assessed so far.
Therefore, we retrospectively evaluated a case series of 11 patients to study the predictive value of 18F-FET PET in rHGGs during bevacizumab/irinotecan (B/I) treatment. We compared 18F-FET PET tumor volumes and response assessment with standard MRI T1/T2 volumetry, RANO criteria, progression-free survival (PFS), and overall survival (OS). In addition, 2 representative cases describe the differences between morphologic and metabolic neuroimaging of rHGG before and during antiangiogenic treatment.
MATERIALS AND METHODS
Patients and Treatments (Table 1)
The local ethics committee of Innsbruck Medical University approved retrospective data evaluation. Patients gave informed consent before each MRI and 18F-FET PET investigation. Patient selection was as follows: every patient with a progressive HGG who failed first-line or second-line treatment not eligible for further surgery or reirradiation was offered treatment with bevacizumab (10 mg/kg) and irinotecan (125 mg/m2) (B/I) with accompanying PET/MRI assessment in 8- to 12-wk intervals.
Clinical and Histopathologic Characteristics of Patient Population
At the time of disease progression, rHGG was divided into the following categories: 4 primary glioblastoma multiformes (GBMs), 1 gliosarcoma, and 6 secondary GBMs (sGBMs; of these, 3 were confirmed histologically and 3 were diagnosed by MRI criteria). In total, 7 of 11 patients had a histologically confirmed primary or sGBM. The other 3 patients with anaplastic astrocytoma (AA) World Health Organization (WHO) grade III showed typical characteristics of sGBMs on standard MR images; their tumors were classified as HGGs.
At first tumor occurrence, all 11 patients underwent surgery (5 macroscopic total resections, 5 partial tumor resections, and 1 stereotactic biopsy). Nine patients with WHO grade III–IV tumors received radiation therapy (extended tumor field, cumulative maximum dose of 60 Gy). In addition, 8 patients underwent concomitant and adjuvant temozolomide chemotherapy according to the Stupp protocol (1), 1 patient was treated with adjuvant procarbazine, lomustine, vincristine (PCV) chemotherapy, and 1 patient was treated with PCV chemotherapy only as initial therapy. During the disease course and before B/I therapy, our patient cohort developed between 1 and 5 recurrences, which were treated with temozolomide, sunitinib malate (Sutent; Pfizer), PCV chemotherapy, anthracyclines (Caelyx; Schering-Plough), and reirradiation.
All 11 patients received steroids at the time of baseline imaging before B/I treatment (dose range, 4–16 mg of dexamethasone daily). Four patients were given steroids in reduced dosages throughout the B/I treatment course; in 7 patients steroid administration could be discontinued during antiangiogenic therapy.
PFS (in mo) was defined from the beginning of B/I therapy to radiologic progression (RANO criteria, Table 2) (8). Median PFS was 4.8 mo and varied from 1.9 to 10.2 mo. Two patients showed no progression at the 6-mo follow-up and were progression-free at the time of study evaluation (PFS at study evaluation, 18.9 and 19.9 mo). Median OS, specified as time from first tumor occurrence until death, was 48 mo and ranged between 18.2 and 169 mo. Three patients were still alive at study evaluation (patient 3, 45.7 mo; patient 9, 81.9 mo; and patient 10, 119.7 mo). Median recurrent OS (rOS), defined as the period from treatment commencement until death, was 6.0 mo and varied from 3.7 to 8.4 mo.
Tumor Volumetry (T1 Postcontrast, T2, 18F-FET PET) Response Assessment
MRI Protocol
Every patient underwent standard MRI and 18F-FET PET for treatment monitoring at regular 8- to 12-wk intervals. The mean interval between MRI and 18F-FET PET was 2–3 d. Because of the retrospective nature of this study, the time points for follow-up imaging studies are not as homogeneous as would be expected in a prospective trial design. MRI studies were conducted on a 1.5-T scanner (Sonata; Siemens-Erlangen) and included T1-weighted (repetition time, 1,860 ms; echo time, 4.38 ms; slice thickness, 1.2 mm; and matrix, 256 × 192), T2-weighted, and fast-spin echo (6,600 ms/100–110 ms, 2-mm slice thickness, and 320 × 240 matrix) sequences. Enhanced images were acquired at 5 min after contrast agent injection (gadodiamide [Omniscan; GE Healthcare]; gadoteric acid [Dotarem; Guerbet]; 0.1 mmol/kg).
MRI Postprocessing Procedures
MRI response assessment according to RANO criteria (8) was performed routinely and visually by an experienced neuroradiologist. In addition, another masked analyst segmented cT1 and T2 hyperintense lesions (hT2), and their volumes were calculated with a semiautomated active contour method (snake evolution, ITK-SNAP software, version 2.0). This software has already demonstrated excellent reliability and high efficacy for 3-dimensional segmentation (12). Afterward, MRI response according to RANO criteria (8) was assessed with the calculated cT1 and hT2 volumes and cross-checked with the results obtained by the experienced neuroradiologist.
PET
18F-FET PET was performed at baseline within 1 wk before treatment commencement, and follow-up scans were obtained at 8- to 12-wk intervals isochronal with MRI. PET scans were acquired on a dedicated PET scanner (Advance; GE Healthcare) with a 15-cm axial field of view and a 28-cm transaxial field of view. Radiation dosimetry of 18F-FET was described previously by Pauleit et al. (13,14). The administered 18F-FET PET brain standard dose ranged between 150 and 180 MBq. 18F-FET PET images were acquired in 3-dimensional mode for 20 min in 35 contiguous transaxial slices of the entire brain, with a slice thickness of 4.25 mm.
Thirty minutes after intravenous tracer administration and patient positioning within the gantry, the emission scan (15 min) was started. Afterward, a transmission scan (5 min) was obtained with a 67Ge pin source for attenuation correction. The attenuation-corrected emission dataset was reconstructed with filtered backprojection and interpreted visually on a workstation with an output image in a 128 × 128 transaxial matrix by an experienced analyst.
For image-reading purposes, 18F-FET PET images were fused with corresponding MRI datasets, which were used as a reference for image coregistration. The following established semiquantitative analysis method (standardized uptake value [SUV] calculation (15)) was used for comparison of 18F-FET PET datasets in a follow-up control to estimate the tracer activity in tumor tissue:
For calculation of the tumor volume, a region-of-interest approach was used to determine the maximal tracer uptake of the summed images. A region of interest was placed over normal-appearing brain tissue in the contralateral hemisphere, and its mean SUV was calculated. In accordance with previous studies (10,13), a lesion with an SUV 1.6 times greater than that of the normal brain tissue (lesion-to-brain ratio) was defined as an 18F-FET PET–positive tumor. Tumor volumes were calculated by a masked analyst (Table 2) with Hermes Software (Hermes Medical Systems) (16). For image interpretation, the 18F-FET PET image was coregistered with the corresponding MRI dataset.
Definition of 18F-FET PET Response
To specify the best cutoff value for defining a metabolic response in 18F-FET PET, receiver-operating-characteristic curve analysis was performed using PFS at 6 mo (17). The calculation revealed that a tumor volume reduction of 45% at the time of the follow-up scan served as the optimal threshold. The area under the receiver-operating-characteristic curve was 0.875 ± 0.117, with a sensitivity of 87.5% and a specificity of 100%.
As shown in previous studies of metabolic imaging with 3′-deoxy-3′-18F-fluorothymidine and 18F-FDG, activity reduction of more than 25% is deemed a threshold for treatment response (18,19). In keeping with this threshold, in our study population a 25% tumor volume reduction revealed a sensitivity of 75% and a specificity of 100%. By using both thresholds in our study, we achieved equal response rates.
Statistics
Statistical analysis was performed at the first imaging follow-up, 8–12 wk after treatment commencement. For this purpose, the patient cohort was divided twice into 2 subgroups. The first stratification separated radiologic and metabolic responders from nonresponders according to RANO criteria and 18F-FET PET metabolic response assessment (18F-FET uptake reduction > 45%). The second stratification divided the patient population into 2 subgroups depending on the time to tumor progression. Patients with a PFS of 6 mo or more were designated long-term survivors, and patients with a PFS of less than 6 mo short-term survivors.
The statistical significance of the differences in values between the groups was calculated with the Mann–Whitney U test (MWU test) at a 95% significance level. Survival estimates were calculated according to the Kaplan–Meier and the log rank method (univariate analysis) for PFS and rOS. P values of less than 0.05 were deemed statistically significant.
RESULTS
Response Evaluation
According to RANO criteria, 7 of 11 patients (64%) showed a partial response, 2 of 11 (18%) stable disease, and 2 of 11 (18%) tumor progression at follow-up (Table 2). Patients with a partial response or stable disease had a significantly longer mean PFS than did patients with tumor progression (mean PFS, 7.9 vs. 2.3 mo; P = 0.015, MWU test; Fig. 1). Univariate survival analysis using the RANO criteria was not possible, because only 2 patients showed tumor progression at follow-up.

PFS according to RANO criteria and 18F-FET PET response assessment. Responders according to RANO or 18F-FET PET showed longer PFS than did nonresponders (RANO: mean PFS, 7.92 mo for responders vs. 2.25 mo for nonresponders, n = 9 vs. n = 2, respectively, P = 0.015; 18F-FET PET: mean PFS, 10.24 mo for responders vs. 4.1 mo for nonresponders, n = 5 vs. n = 6, respectively, P = 0.025; MWU test). Comparison of the 2 groups reveals that 18F-FET PET responders tended to have longer PFS than RANO responders (mean PFS, 10.24 vs. 7.92 mo, P = 0.25; MWU test).
According to 18F-FET PET response criteria, 5 of 11 patients (45%) showed tumor response (responders) and 6 of 11 patients (55%) tumor progression (nonresponders) (Table 2) at follow-up. 18F-FET PET responders demonstrated a significantly longer mean PFS than did nonresponders (mean PFS, 10.24 vs. 4.1 mo; P = 0.025, MWU test). In univariate survival analysis, a response in 18F-FET PET predicts a significantly longer PFS (P = 0.038, log rank test; Fig. 2A). 18F-FET PET responders tended to have a longer PFS than did RANO responders (10.24 vs. 7.9 mo; P = 0.25, MWU test) and showed a mean rOS almost twice as long that of nonresponders (11.0 vs. 5.85 mo; P = 0.12, MWU test). In univariate survival analysis, 18F-FET PET responders also tended to have a longer rOS (P = 0.098; log rank test; Fig. 2B).
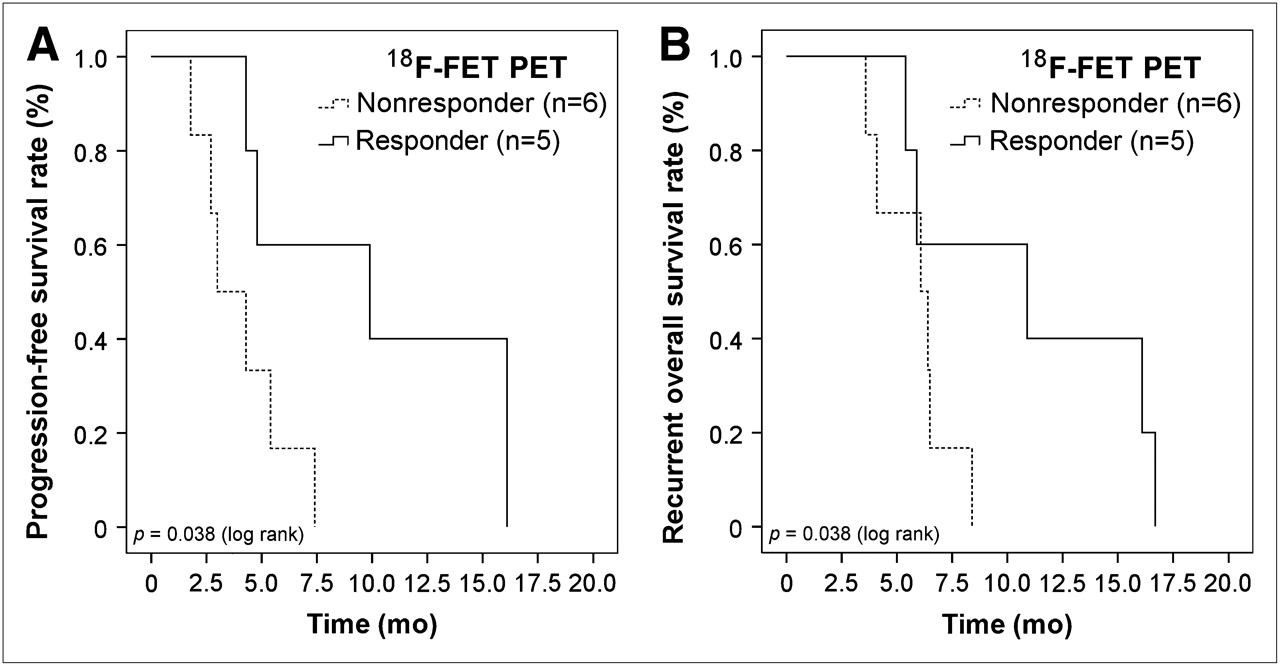
Univariate survival analysis of 18F-FET PET responders vs. nonresponders during antiangiogenic treatment. (A) 18F-FET PET analysis predicts significantly longer PFS for responders than for nonresponders (P = 0.038, log rank test). (B) 18F-FET PET responders tend to have longer rOS than do nonresponders (P = 0.098, log rank test).
Comparison of MRI and 18F-FET PET Response Assessment
Comparison of RANO and 18F-FET PET response criteria revealed that 5 (45%) patients had a response or stable disease at follow-up, whereas 2 (18%) patients showed progression on both MR and 18F-FET PET images. However, 4 (36%) patients demonstrated a discrepancy in response assessment, namely a response or stable disease according to RANO criteria but no 18F-FET PET response. In these 4 patients, 18F-FET PET was able to detect treatment failure earlier than was MRI. Normally tumor progression shown on MR images and not 18F-FET PET images was decisive for the termination of B/I treatment. In our case, a mean time benefit of 9 wk (range, 4–14 wk) for earlier detection of treatment failure with 18F-FET PET was estimated.
At the time MR images demonstrated tumor progression in these 4 patients, neuroimaging showed a slow but continuously infiltrating tumor growth without cT1 but a stepless increase in hT2 signal and 18F-FET PET metabolic activity (Supplemental Fig. 1A; supplemental materials are available online only at http://jnm.snmjournals.org). This progression type would be consistent with a gliomatotic tumor growth pattern. In contrast, the other 5 progressing patients developed a fast-growing tumor mass with increased (Supplemental Fig. 1B) or reduced (Supplemental Fig. 1C) cT1 tumor volumes and strong metabolic activity on 18F-FET PET. Interestingly, in 2 of these patients a solid, knotty T2 signal abnormality could be seen (Supplemental Fig. 1C).
Comparison of Tumor Volume Changes During Antiangiogenic Treatment
Evaluation of calculated tumor volume changes at follow-up revealed that the median cT1, hT2, and 18F-FET PET tumor volumes had decreased by 62.4%, 14.5%, and 13.2%, respectively (n = 11). Comparison of long-term survivors (PFS ≥ 6 mo; n = 3) and short-term survivors (PFS < 6 mo; n = 8) revealed that median cT1 volumes were reduced by 67.2% versus 33.9% (P = 0.45, MWU test), whereas median hT2 volumes had decreased by 20.9% versus 1.6% (P = 0.31, MWU test). Importantly, median 18F-FET PET volumes decreased significantly in long-term survivors but increased in short-term survivors (−86.3% vs. +23.8%, P = 0.042, MWU test; Fig. 3).

Changes in MRI and 18F-FET PET tumor volumes during antiangiogenic treatment. Median cT1 tumor volumes decreased in both patient populations—that is, long-term survivors (PFS ≥ 6 mo; n = 3) and short-term survivors (PFS < 6 mo; n = 8)—by 67.2% vs. 33.9% (P = 0.45, MWU test), respectively. Median hT2 volumes also decreased in long-term survivors (n = 3) and short-term survivors (n = 8), by 20.9% vs. 1.6% (P = 0.31, MWU test). In contrast, 18F-FET PET showed tumor to have significantly decreased by 86.3% in long-term survivors, whereas in short-term survivors it had increased by 23.8% (P = 0.042, MWU test).
Case Studies
The following 2 representative cases highlight the differences detected between MRI and 18F-FET PET in the course of antiangiogenic treatment.
Patient 8 (Table 1; Fig. 4A) initially had a right frontoparietal anaplastic astrocytoma WHO grade III (histologically confirmed) and on the MR image showed malignant transformation to a secondary glioblastoma according to WHO criteria. Baseline MRI before B/I treatment showed a small central necrotic cT1 lesion in the ventral part of the tumor and a large hT2 volume. T2 sequences also showed a solid tumor node without contrast enhancement in the dorsal part of the tumor (Fig. 4Ab). Importantly, 18F-FET PET revealed 2 metabolically active lesions in the ventral and dorsal tumor parts, overlapping well with the ventral cT1-positive and the dorsal cT1-negative tumor lesions (seen on PET/MRI fusion image).
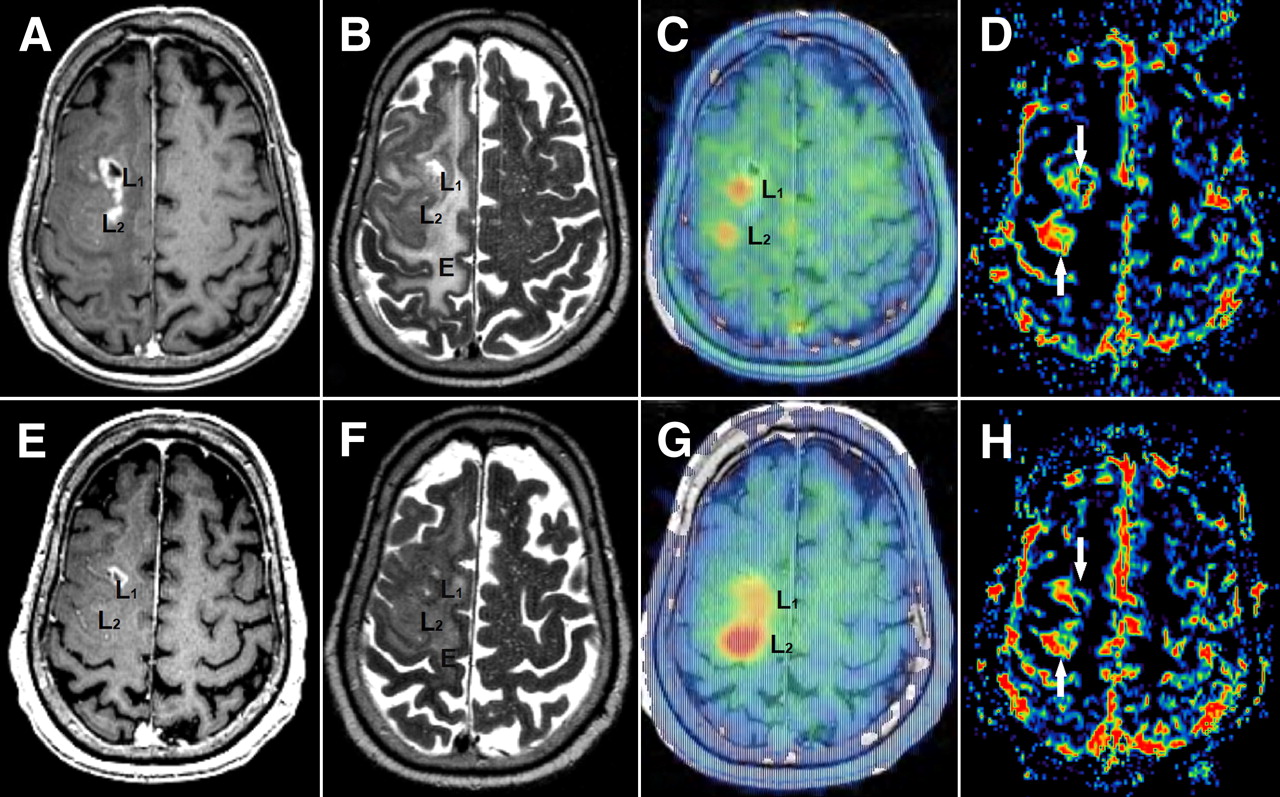
(A–D) Pretreatment images. (A) Contrast-enhanced T1-weighted MRI shows a small central necrotic contrast-enhancing lesion in ventral part of the tumor (L1, cT1-positive) and nonenhancing tumor lesion in dorsal tumor mass (L2, cT1-negative). (B) MRI shows T2-hyperintense tumor and perifocal edema (E). (C) MRI/FET PET image fusion reveals tracer uptake in both MRI lesions L1 and L2. (E–H) Imaging after 12 wk of treatment. (E and F) MRI shows decrease in T1 contrast enhancement (L1) as well as in T2 signal hyperintensity in peritumoral edema (E). (G) 18F-FET PET/MRI image fusion shows partial response for cT1-positive ventral metabolic lesions (L1) but progression for dorsal tumor part (L2). (D and H) MRI perfusion reveals increased local cerebral blood volume in both tumor fractions (white arrows). This observation suggests differently involved molecular pathways in tumor angiogenesis and gliomagenesis (ventral lesion: VEGF-dependent; dorsal lesion: VEGF-independent). E = peritumoral edema; L1 = ventral, cT1-positive tumor part; L2 = dorsal, cT1 negative tumor part.
At 12 wk after treatment onset (6 B/I cycles), the MRI cT1 volume significantly decreased whereas the hT2 volume remained stable (partial response according to RANO criteria). In contrast, 18F-FET PET showed an 82% increase in metabolic activity. However, PET/MRI image fusion revealed that the metabolic activity of the ventral cT1-positive tumor part decreased during treatment, whereas the metabolic activity of the dorsal cT1-negative tumor lesion significantly increased. Interestingly, additional MRI perfusion demonstrated increased local cerebral blood flow in both tumor fractions (cerebral blood volume).
Patient 11 (Table 1; Fig. 5) initially had a bifrontal oligoastrocytoma WHO grade II (histologically confirmed) and developed a malignant transformation to a sGBM WHO grade IV (histologically confirmed). Baseline MRI before B/I treatment showed a bifrontal tumor mass with large cT1 and hT2 volumes. 18F-FET PET also identified a large hypermetabolic tumor volume. However, PET/MRI image fusion showed that the main metabolically active area appeared to be on the left frontally, in contrast to MRI, where the contrast enhancement was more pronounced on the right frontally and in the ventral corpus callosum.
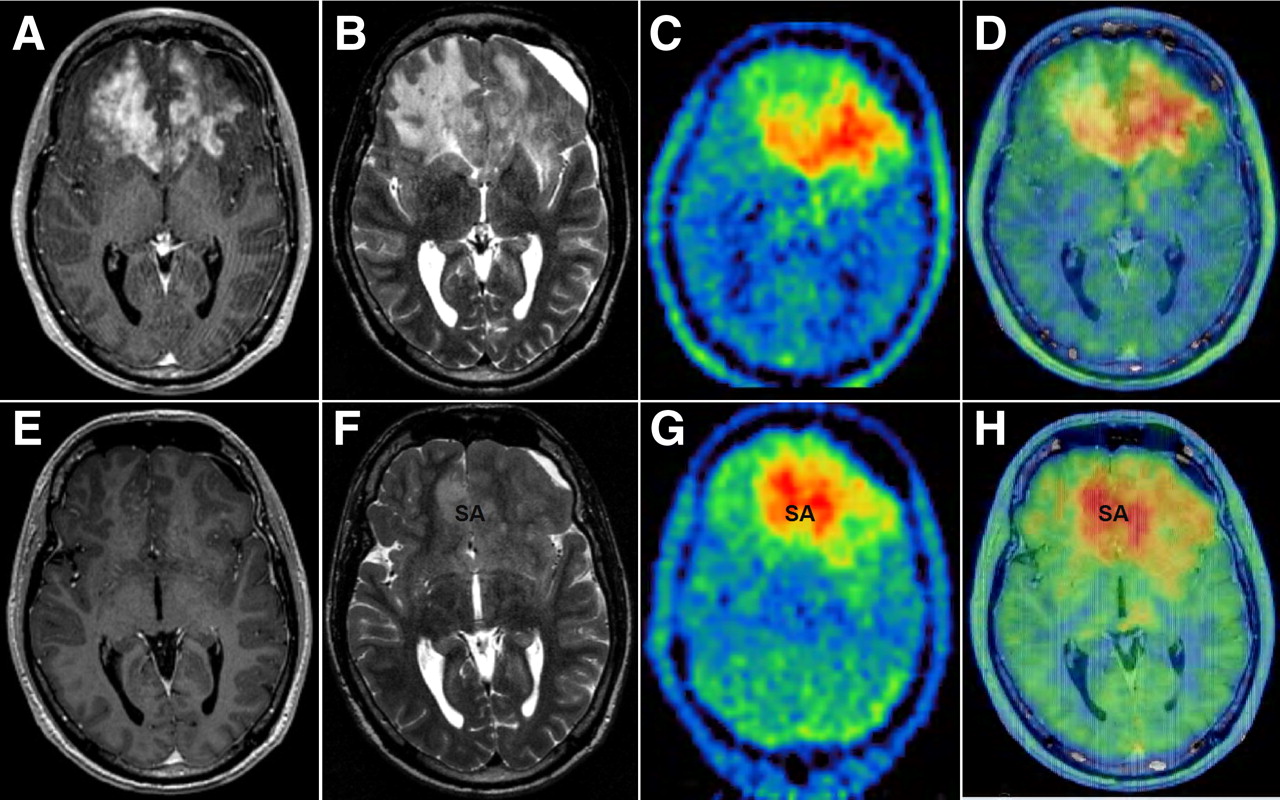
Comparison of MRI and 18F-FET PET during antiangiogenic therapy for patient (Table 1). (A–D) Pretreatment images. (A and B) Contrast-enhanced T1-weighted MR image shows bifrontal tumor mass with large cT1 (A) and hT2 volume (B). (C) 18F-FET PET reveals large hypermetabolic tumor left frontal lobe, whereas contrast enhancement is more pronounced in right frontal lobe. (D) 18F-FET PET/MRI image fusion shows inconsistent overlap of contrast enhancement in T1 and 18F-FET PET uptake. (E–H) Imaging after 12 wk of treatment, during which patient's neurologic symptoms inexorably progressed. (E and F) MRI shows decrease in T1 contrast-enhancement (E) and T2 signal hyperintensity (F, signal abnormality). (G) 18F-FET PET reveals slight decrease in volume (−13%) but striking change in hypermetabolic distribution pattern (decrease in left frontal lobe but increase in ventral corpus callosum and right frontomesial lobe). (H) PET/MRI image fusion shows increased local cerebral blood flow in both tumor fractions. Tumor extent on MRI did not match 18F-FET PET hypermetabolic tumor areas. This discrepancy may provide important information regarding further planning of, for example, radiotherapy. SA = signal abnormality.
At 12 wk after treatment onset (6 B/I cycles), the patient's neurologic symptoms had inexorably progressed. However, the MRI at that time showed a partial response according to RANO criteria. 18F-FET PET, in contrast, demonstrated only a slight decrease in volume of 13% (this patient was categorized as a nonresponder). In addition, a striking change in the hypermetabolic distribution pattern had occurred, namely a decrease in 18F-FET PET metabolic activity on the left frontally but an increase within the ventral corpus callosum and in the right hemisphere frontomesially. Additional PET/MRI image fusion showed that the metabolically active tumor matched a solid glioma transformation in T1 and T2 sequences.
DISCUSSION
This study demonstrates that 18F-FET PET contributes important information to MRI-based RANO criteria for tumor response assessment in patients with rHGG treated with B/I. In our study, both imaging modalities were able to predict PFS to antiangiogenic therapy. In a subset of patients, 18F-FET PET was able to detect treatment failure earlier than was MRI.
Valid and precise imaging response assessment may help to noninvasively predict drug efficacy early in the course of treatment (20). Recently, using the same patient population, our group showed that apparent diffusion coefficient gray-scale histograms from diffusion-weighted MRI as a display of cellular density and tissue composition might be a predictive imaging biomarker for the early assessment of infiltrative tumor growth and for identifying responders to VEGF pathway–inhibiting treatment regimens (21). In addition, the amount of hyperperfusion is a marker of the biologic behavior and aggressiveness of a glioma. The estimated relative cerebral blood volume measured by perfusion MRI is a semiquantitative parameter that correlates with the number of capillaries (22) and glioma grading (23). MRI perfusion showed correlations with PFS during antiangiogenic treatment (24) and can differentiate between recurrent tumor and pseudoprogression (25). Chen et al. (18) evaluated antiangiogenic treatment response using 3′-deoxy-3′-18F-fluorothymidine. Responders to this nucleotide survived 3 times longer than did nonresponders (10.8 vs. 3.4 mo) but tended to experience only prolonged PFS. So far, no study has compared RANO criteria with 18F-FET PET in HGG patients treated with antiangiogenic agents.
In our study population, the 5 metabolic responders had almost 3 times longer PFS and a tendency to experience longer rOS than did the 6 nonresponders. Furthermore, median 18F-FET PET volumes significantly decreased in patients with a PFS of 6 mo or more but increased in patients with a PFS less than 6 mo. However, MRI and 18F-FET PET response assessment was not concordant in 4 of 11 patients, who showed a partial response according to RANO criteria but were nonresponders according to 18F-FET PET. For these 4 patients, 18F-FET PET was able to detect anti-VEGF therapy failure and nonenhancing tumor growth significantly earlier than were RANO criteria alone, and 18F-FET PET corresponded better with the patients’ clinical performance than did MRI. The mean time benefit in our patients was 9 wk, an important period while treating these terminally ill patients.
The differences in MRI and 18F-FET PET might be explained first by a morphologic heterogeneity of HGG, leading to difficult interpretation of standard MRI sequences. There are highly malignant tumor parts with and without T1 contrast enhancement (Fig. 4A). Furthermore, T2 signal hyperintensity is a combination of infiltrating tumor cells, necrotic areas, tumor edema, and treatment-related leukoencephalopathy (26). In contrast, 18F-FET PET shows metabolically active tumors independent of any anatomic or pathophysiologic changes and may therefore reflect tumor extension more accurately than does MRI (13). In this context, we showed that the localization of 18F-FET PET metabolically active tumor does not always match the contrast-enhancing glioma seen on MR images (Supplemental Fig. 1B).
Second, VEGF pathway inhibition results in pseudonormalization of a highly permeable BBB. This treatment effect results in T1 contrast-enhancement withdrawal and in tumor edema reduction. For this reason, the Macdonald criteria considering changes in the cT1 tumor (27–29) were supplemented with T2/FLAIR signal abnormality (RANO criteria (8)). Because metabolic 18F-FET PET does not rely on an abnormally highly permeable BBB, it may provide a reliable molecular imaging method for monitoring antiangiogenic treatment response (Fig. 4A).
Third, HGGs not only have 18F-FET PET–positive hypermetabolic tumor parts overlapping with T1 contrast enhancement but also have highly 18F-FET PET–positive tumor lesions that correspond to nonenhancing tumor lesions (Fig. 4A). Importantly, cT1-positive, but not cT1-negative, 18F-FET PET hypermetabolic tumor lesions showed a response to anti-VEGF treatment on MR and 18F-FET PET images. This observation indicates a biologic heterogeneity with VEGF-dependent (cT1-positive) and VEGF-independent (cT1-negative) tumor parts and a difference in their response to bevacizumab treatment.
All 4 patients who were partial responders on MR images but nonresponders on 18F-FET PET images developed a gliomatotic tumor growth pattern characterized by a slow but inexorable increase in T2 hyperintensity and moderate metabolic activity on 18F-FET PET (Supplemental Fig. 1A). Recently it was shown that continuous inhibition of VEGF-induced angiogenesis may promote tumor escape and consequently a VEGF-independent phenotype with hypercellularity, a diffuse tumor infiltration pattern, and a greater invasiveness of tumor cells (30).
The limitations of this study are the relatively low number of patients and a heterogeneous patient population including both primary and secondary GBMs.
CONCLUSION
Our data indicate that 18F-FET PET is a reliable molecular neuroimaging tool in patients with rHGG undergoing antiangiogenic treatment. 18F-FET PET is predictive for anti-VEGF treatment and is able to identify in a subset of patients tumor progression and treatment failure earlier than can standard MRI. Therefore, in clinical practice 18F-FET PET in addition to MRI might add important information in response assessment, as compared with standard MRI alone. These preliminary findings are being further evaluated in a prospective clinical trial with a larger patient cohort.
DISCLOSURE STATEMENT
The costs of publication of this article were defrayed in part by the payment of page charges. Therefore, and solely to indicate this fact, this article is hereby marked “advertisement” in accordance with 18 USC section 1734.
Acknowledgments
We confirm the originality of this study. Parts of the study were presented at the ASCO 2010 and published in abstract form (J Clin Oncol. 2010;28:e12545). Martha Nowosielski was supported by the DOC-fFORTE Fellowship from the Austrian Academy of Science at the Department of Neurology, Innsbruck Medical University.
Footnotes
↵* Contributed equally to this work.
- © 2011 by Society of Nuclear Medicine
REFERENCES
- Received for publication December 15, 2010.
- Accepted for publication March 18, 2011.


Jump to section
Related Articles
Cited By...
- Amino Acid PET in Neurooncology
- Amino Acid PET in Neurooncology
- MRI and 18FET-PET Predict Survival Benefit from Bevacizumab Plus Radiotherapy in Patients with Isocitrate Dehydrogenase Wild-type Glioblastoma: Results from the Randomized ARTE Trial
- Imaging necrosis during treatment is associated with worse survival in EORTC 26101 study
- Influence of Bevacizumab on Blood-Brain Barrier Permeability and O-(2-18F-Fluoroethyl)-L-Tyrosine Uptake in Rat Gliomas
- Combined PET Imaging of the Inflammatory Tumor Microenvironment Identifies Margins of Unique Radiotracer Uptake
- Lessons From Anti-Vascular Endothelial Growth Factor and Anti-Vascular Endothelial Growth Factor Receptor Trials in Patients With Glioblastoma
- Treatment Response Evaluation Using 18F-FDOPA PET in Patients with Recurrent Malignant Glioma on Bevacizumab Therapy
- Progression types after antiangiogenic therapy are related to outcome in recurrent glioblastoma
- Dynamic 18F-FET PET in Newly Diagnosed Astrocytic Low-Grade Glioma Identifies High-Risk Patients
- Assessment of Treatment Response in Patients with Glioblastoma Using O-(2-18F-Fluoroethyl)-L-Tyrosine PET in Comparison to MRI
- Impact of 3,4-Dihydroxy-6-18F-Fluoro-L-Phenylalanine PET/CT on Managing Patients with Brain Tumors: The Referring Physician's Perspective
- 3'-Deoxy-3'-18F-Fluorothymidine PET and MRI for Early Survival Predictions in Patients with Recurrent Malignant Glioma Treated with Bevacizumab