


Abstract
Patients with triple-negative breast cancer (TNBC) have poor outcome when pathologic complete response (pCR) is not reached after neoadjuvant chemotherapy. Early prediction would be helpful. We evaluated the association between metabolic response after 2 cycles of neoadjuvant chemotherapy, pCR, and outcome in patients receiving 2 different anthracycline-based regimens (conventional and intensified). Methods: Of 77 consecutive TNBC patients, 23 received EC-D (4 cycles of epirubicin + cyclophosphamide followed by 4 cycles of docetaxel at conventional doses) and 55 received a dose-intensified, dose-dense concomitant regimen of epirubicin + cyclophosphamide (historically called SIM) for 6 cycles. PET/CT with 18F-FDG was performed at baseline and after 2 cycles of neoadjuvant chemotherapy. The associations between clinical factors, biologic factors, early metabolic change, pCR, and event-free survival (EFS) were examined (log-rank test). Results: Of the 78 patients, 29 (37%) achieved pCR. The change in SUVmax (∆SUVmax) after 2 cycles was more pronounced in patients who achieved pCR (−72% vs. −42%; P < 0.0001). ∆SUVmax was more pronounced under SIM than under EC-D (−68% vs. −35%, P = 0.009), and there was a trend for a higher pCR rate (44% vs. 22%, P = 0.078). Twenty-two patients relapsed and 10 of them died (median follow-up, 34 mo). pCR was associated with EFS (log-rank, P = 0.001). ∆SUVmax was also significantly associated with EFS both in patients receiving SIM (P = 0.028) and in those receiving EC-D (P = 0.021). The optimal ∆SUVmax for predicting pCR and EFS was, however, specific to the treatment regimen. EFS was not associated with tumor grade (P = 0.98), histologic subtype (P = 0.17), or clinical stage (P = 0.097). Conclusion: Early metabolic change during neoadjuvant chemotherapy can predict pathologic response and EFS in TNBC patients under different chemotherapy regimens. However, the metabolic response varies with the type of chemotherapy.
- 18F-FDG PET/CT
- triple-negative breast cancer
- neoadjuvant chemotherapy
- dose-dense chemotherapy
- metabolic response
- prognosis
Pathologic complete response (pCR) after neoadjuvant chemotherapy is a strong predictor of favorable outcome, especially in aggressive breast cancer subtypes such as triple-negative breast cancer (TNBC; lacking estrogen and progesterone receptors and without HER2 overexpression) (1,2). Large or locally advanced breast cancers are currently treated with an anthracycline-based sequence followed by a taxane-based sequence at conventional doses (3). Dose-dense and dose-intensified chemotherapy has yielded encouraging results in TNBC (4,5). One phase III trial, “GeparOcto,” is now comparing 2 different dose-dense, dose-intensified regimens (6). Other approaches could be of interest in TNBC (e.g., PARP inhibitors (7), inhibitors of immune checkpoints (8), and pan-EGF-R inhibitors (9)). When novel treatments are tested, the pCR rate is currently an important endpoint. However, although pCR is a strong predictor of outcome, studies have not shown that an increase in pCR translates into better patient outcome (2,10), although some associations have been found in trials comparing intensified, dose-dense chemotherapy with standard-dose regimens (10).
The pathologic response is known only at the end of neoadjuvant chemotherapy. An earlier prediction of residual disease would lead to treatment adaptation in an attempt to increase the pCR rate in nonresponders and improve the clinical outcome (11). PET/CT with 18F-FDG has shown potential to detect residual disease early and also to predict poor outcome. The main advantage of metabolic imaging over conventional imaging is its ability to assess response earlier because the tumor metabolic changes occur before the morphologic changes (12). The potential prognostic value of PET gains full power and clinical meaning when each breast cancer phenotype is considered separately (13–18). Recently, in 142 HER2-positive breast cancer patients, the pCR rate was increased when the neoadjuvant treatment was changed early according to PET information (18).
In TNBC patients, some small series have suggested that PET information can be used to predict pCR early (14,16), while others found that PET was not predictive (15,17). Mixed chemotherapy regimens were used in those studies. The main objective of our study was to determine whether PET is useful in predicting pCR and patient outcome early in TNBC patients and to evaluate whether the type of chemotherapy regimen influences metabolic response. The secondary objectives were to optimize the PET criteria for predicting pathologic response and to determine whether assessing 18F-FDG changes in axillary nodes, in addition to the primary tumor, improves PET prediction as recently suggested (19).
MATERIALS AND METHODS
Patients
The Institutional Review Board approved the study and stated that no informed consent was needed, considering the noninterventional design of this retrospective analysis. The eligibility criteria were patients with stage II or III TNBC scheduled for neoadjuvant chemotherapy. Patients with distant metastases and patients with uncontrolled diabetes were not included.
All patients underwent PET at baseline (PET1) and after 2 cycles of neoadjuvant chemotherapy (PET2). After completion of the neoadjuvant chemotherapy, the patients underwent breast-conserving surgery or mastectomy, as well as axillary lymph node dissection. Two regimens were used: conventional-dose chemotherapy with an anthracycline-based sequence followed by a taxane-based sequence, EC-D (4 cycles of epirubicin, 75 mg/m2 d1, plus cyclophosphamide, 750 mg/m2 d1, every 3 wk, followed by 4 cycles of docetaxel, 100 mg/m2 d1, every 3 wk), and a dose-dense, dose-intense concomitant regimen historically called SIM (epirubicin, 75 mg/m2 d1, plus cyclophosphamide, 1,200 mg/m2 d1, every 2 wk for 6 cycles). Promising preliminary results encouraged continuation of the prospective study (14). The present study involved a larger number of patients so that the influence of the chemotherapy regimen on metabolic response could be analyzed.
Breast Cancer Diagnosis and Neoadjuvant Chemotherapy Regimen
Breast cancer was diagnosed by core-needle biopsy. Histologic grade was determined using the modified Scarff-Bloom-Richardson (SBR) system for invasive carcinoma. Tumors were defined as triple-negative when they were negative for both estrogen receptor (ER) and progesterone receptor (PR) and did not overexpress HER2.
Twenty-three patients received EC-D. Fifty-five patients (from the more recent period) received SIM. After surgery, patients who received SIM received 3 cycles of docetaxel, 75 mg/m2 d1, plus cyclophosphamide, 600 mg/m2 d1, every 3 wk. The shift toward the use of SIM in TNBC patients at Saint-Louis Hospital was based on our previous data (20), with the aim of increasing pCR rates.
18F-FDG PET/CT Imaging
Patients fasted for 6 h, and blood glucose level had to be less than 7 mmol/L. 18F-FDG (5 MBq/kg) was administered, and imaging started almost 60 min later. A Gemini XL PET/CT scanner (Philips) was used. CT data were acquired first (120 kV; 100 mAs; no contrast enhancement). PET emission data were acquired for 2 min per bed position. SUV was defined as [tracer concentration (kBq/mL)]/[injected activity (kBq)/patient body weight (g)].
A 3-dimensional region of interest was drawn around the primary tumor and, when present, around axillary lymph nodes. The percentage ΔSUVmax within the region of interest after 2 cycles of chemotherapy was calculated as 100 × (second-cycle SUVmax − baseline SUVmax)/baseline SUVmax.
Pathology Assessment and Event-Free Survival
pCR was defined as no evidence of residual invasive cancer in breast tissues or lymph nodes (2). Absence of carcinoma in situ was not mandatory.
During neoadjuvant chemotherapy, the patients underwent clinical examination every 2 cycles. After surgery, the patients made follow-up visits every 4 mo for 2 y and then twice yearly. Events included local, regional, or distant recurrence or death. Event-free survival (EFS) was defined as the time between PET1 (or the date of surgery if considering the impact of pathologic response on EFS) and the date of the first event or of the last follow-up.
Statistical Analysis
Variables were compared using the Wilcoxon rank sum test for quantitative variables and the Fisher exact test for categoric variables.
The performance of PET parameters for prediction of non-pCR was evaluated using receiver-operating-characteristic analyses. Areas under the curve (AUCs) were estimated, along with their 95% confidence intervals, and compared using DeLong and DeLong’s test. The predictive performance of SUVmax at PET1 and PET2 and of ΔSUVmax was evaluated according to measurements in different locations (primary tumor, axillary lymph nodes, and target, i.e., the site with the highest baseline SUVmax, either the breast tumor or a lymph node) and combining ΔSUVmax in the primary tumor and axillary nodes using the linear predictor of a logistic regression model predicting pathologic response (19). Predictive performance was examined at various cutoffs.
EFS was estimated using the Kaplan–Meier method and compared using the log-rank test according to clinical factors, biologic factors, pathologic findings, and PET parameters.
The predictive value of ΔSUVmax as a continuous variable was also estimated in multivariate analysis for pathologic response (logistic regression) and for EFS (Cox regression).
All tests were 2-sided, and P values equal to or less than 0.05 were considered statistically significant. Analyses were performed using R software (version 3.0.2).
RESULTS
Patient and Tumor Characteristics
Seventy-eight M0 patients with large or locally advanced TNBC were consecutively enrolled. Twenty-three patients were treated with EC-D, and 55 with SIM. Except for tumor grade, characteristics did not differ between the groups. Grade 3 tumors were more frequent in the SIM group (Table 1).
Patient and Tumor Characteristics in Whole Population and in EC-D and SIM Groups
Metabolic PET Parameters at Baseline and Association with Tumor Characteristics
The median SUVmax of the 78 primary breast tumors at baseline was 10.1 (range, 1.6–27.5). In 58 patients, there was 18F-FDG uptake in the axilla suggesting lymph node invasion (median SUVmax, 5.1; range, 0.8–21.2). In 20 patients, the site with the highest initial uptake was a lymph node.
Baseline SUVmax was higher in grade 3 than grade 2 tumors (P = 0.004). There was no statistical difference in SUVmax according to tumor size (≤5 vs. > 5 cm; P = 0.72), lymph node status (cN0 vs. cN1-2-3; P = 0.32), or American Joint Committee on Cancer (AJCC) stage (II vs. III; P = 0.60). Baseline tumor uptake was also similar between the EC-D and SIM groups (median SUVmax, 9.9 and 10.1, respectively; P = 0.84).
Relation Between pCR and Clinical, Biologic, Histologic, and PET Parameters
Of the 78 patients, 29 (37%) achieved pCR and 49 (63%) had residual disease. pCR was more frequent in patients with high-grade tumors (P = 0.022), with smaller tumors (P = 0.003), without (or with limited) clinical lymph nodes (P = 0.019), and with a low AJCC stage (P = 0.031) (Table 2). The pCR rate was higher in patients treated with SIM, but the difference from EC-D was not significant (44% vs. 22%, P = 0.078).
Clinical, Histologic, and Immunohistochemical Factors and PET Parameters According to Pathologic Response
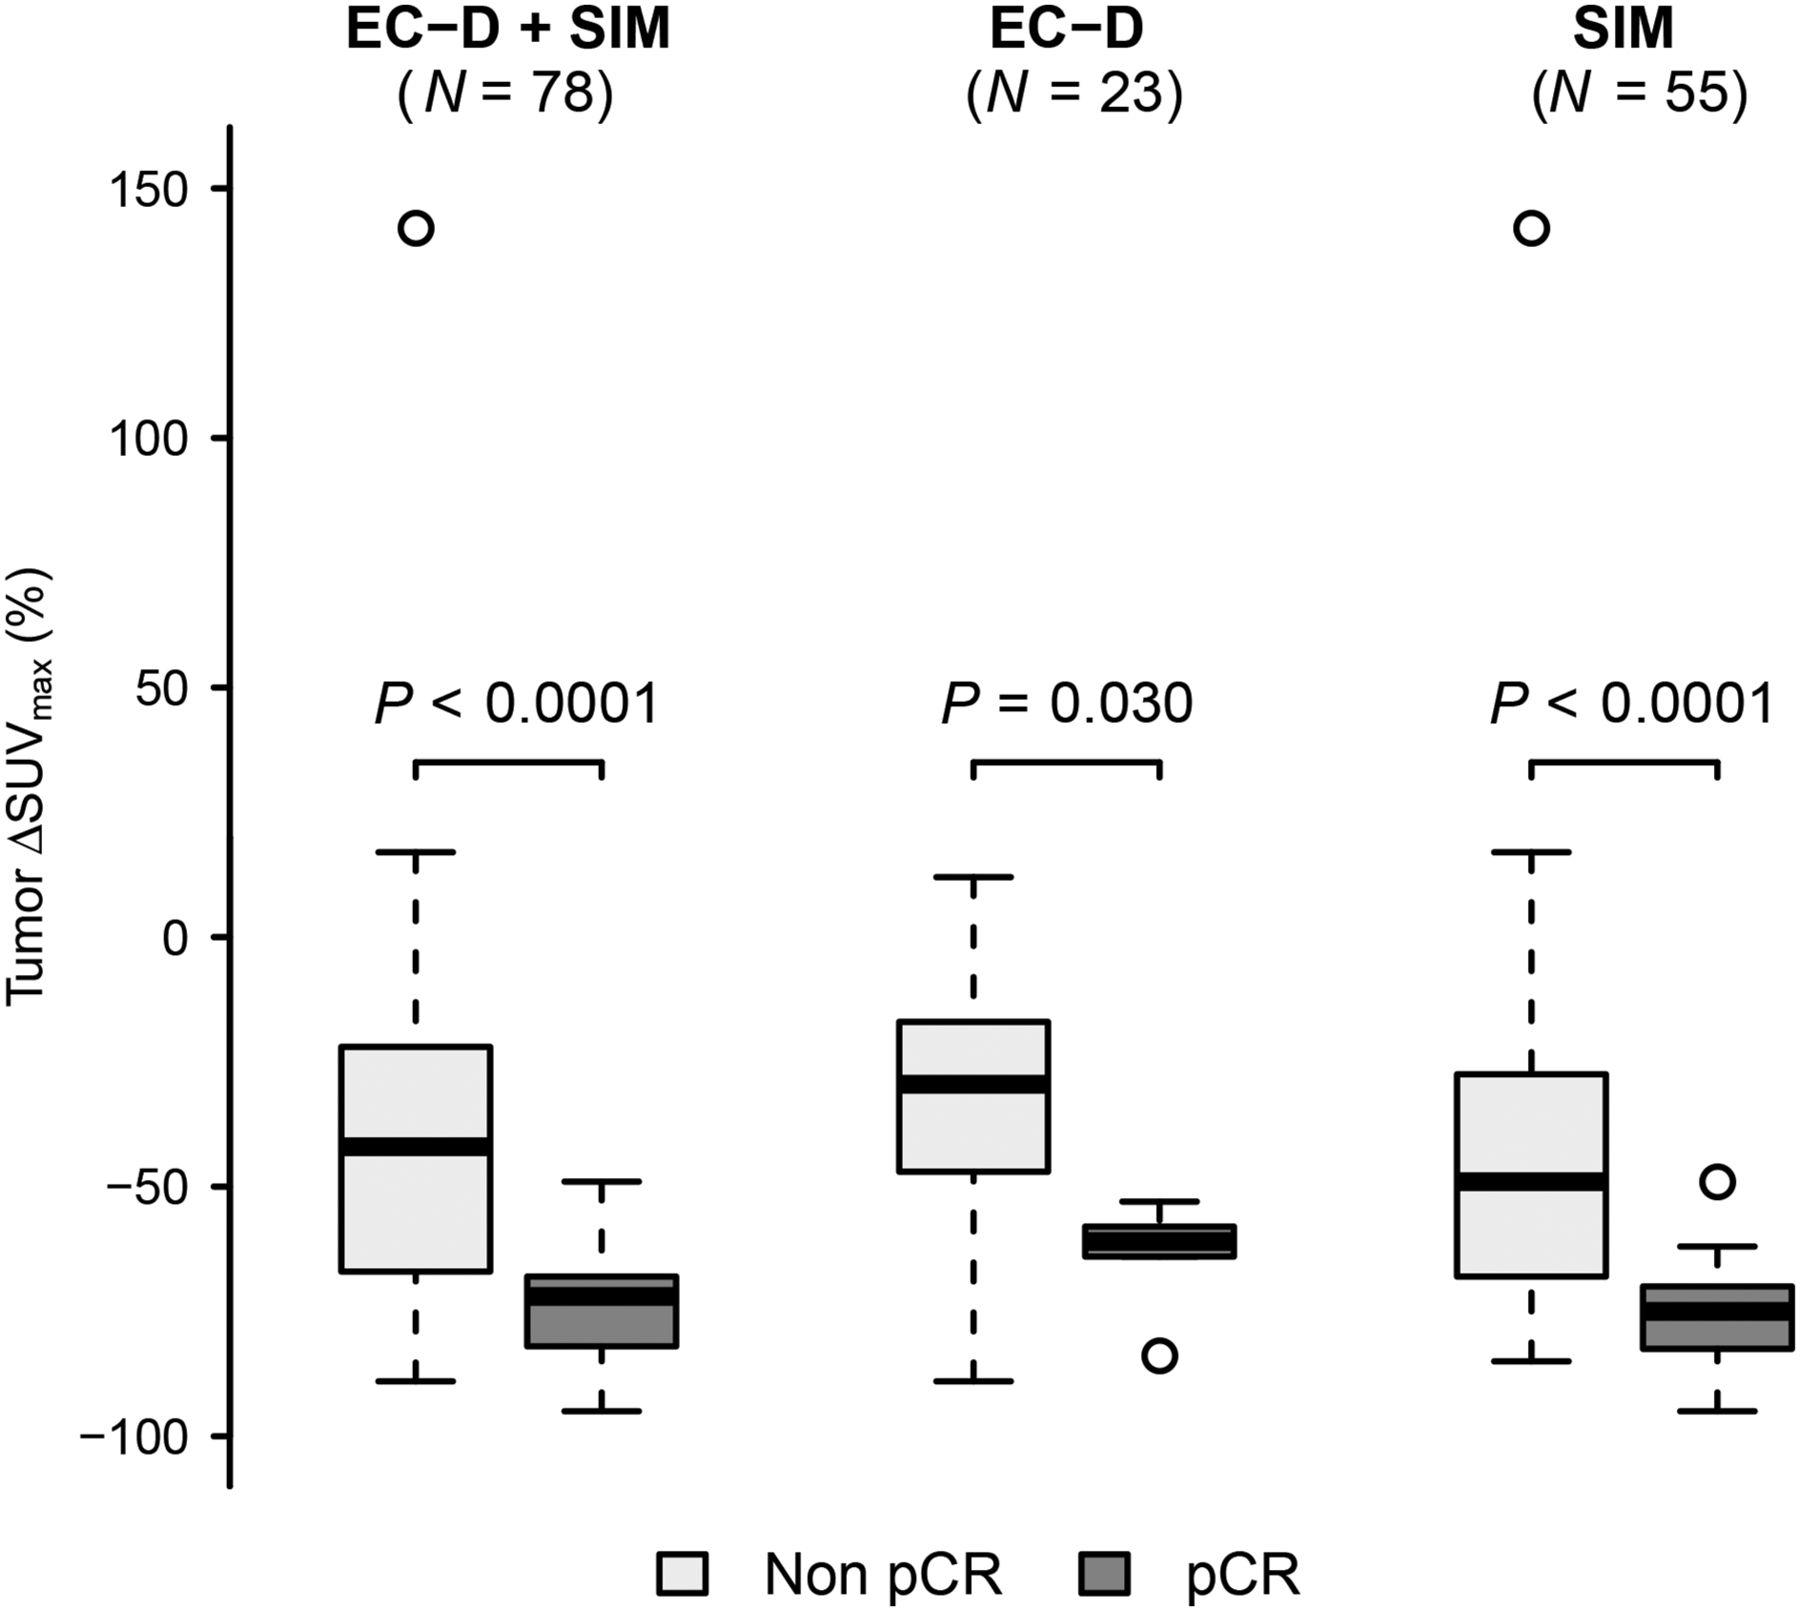
Among the 78 TNBCs, all PET parameters measured in the primary tumor (PET1 SUVmax, PET2 SUVmax, and ΔSUVmax) were predictive of pCR (Table 2). Baseline tumor uptake was higher in patients who achieved pCR (median SUVmax, 13 vs. 9; P = 0.004). At PET2, residual tumor uptake was lower in patients who achieved pCR (median SUVmax, 3 vs. 5; P = 0.013). The decrease in tumor uptake between PET1 and PET2 was more pronounced in patients who achieved pCR (−72% vs. −42%; P < 0.0001) (Fig. 1). ΔSUVmax offered a higher AUC in predicting pathologic response (0.86) than did absolute SUVmax measured at PET1 (0.70; P = 0.016) or at PET2 (0.67; P = 0.0003) (Table 3).

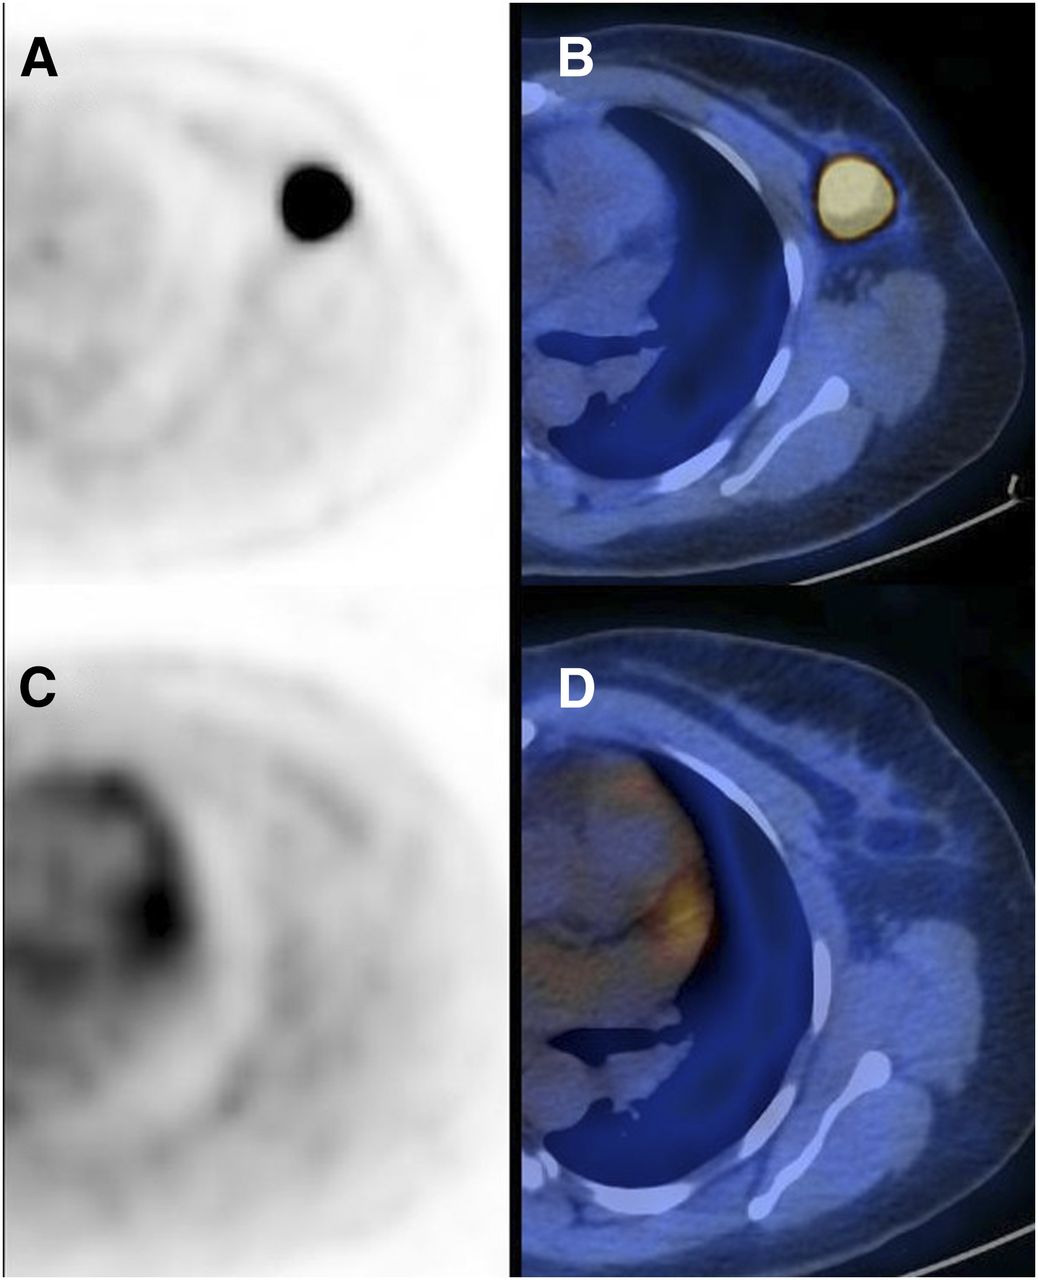
In 44-y-old patient with TNBC of left breast, transaxial PET (A) and PET/CT (B) images of primary tumor at baseline (SUVmax, 27.3) and after 2 cycles of SIM (C and D; SUVmax, 1.4). ΔSUVmax is −95%. No residual tumor was detected at surgery after 4 additional cycles of chemotherapy. Patient had no local or distant recurrence more than 1 y after surgery.
Performance of PET Parameters in Predicting pCR Early in All 78 TNBC Patients
PET prediction was not further improved when axillary node uptake was considered in addition to breast tumor analysis (Table 3).
In multivariate analysis, adjusted for AJCC stage, ΔSUVmax remained associated with pCR (odds ratio, 2.33 for a 10% decrease in 18F-FDG uptake; 95% confidence interval,1.51–3.60; P = 0.0001).
Prediction of pCR According to Chemotherapy Regimen
Preparation procedures and PET instrumentation factors were similar in the EC-D and SIM groups (Table 4). Some variability in the time between 18F-FDG injection and imaging was observed but was not significantly different between groups (Table 4). As expected, the time between PET1 and PET2 and between PET1 and surgery was shorter in the SIM group than in the EC-D group (6 vs. 8 wk and 17 vs. 28 wk, respectively).
Comparison of Preparation Procedures, Some Patient Characteristics, and Instrumental Factors Between EC-D and SIM Groups
The decrease in tumor SUVmax was less pronounced in the EC-D group than in the SIM group (−35% vs. −68%, P = 0.009) (Figs. 2 and 3). Table 5 shows that the optimal ΔSUVmax cutoff for predicting non-pCR would be dependent on the type of chemotherapy regimen. For example, the optimal cutoff to predict residual disease while maintaining a specificity higher than 90% (<10% of pCR in metabolic nonresponders) was observed with a ΔSUVmax cutoff close to −65% in the SIM group and close to −50% in the EC-D group (Table 5).
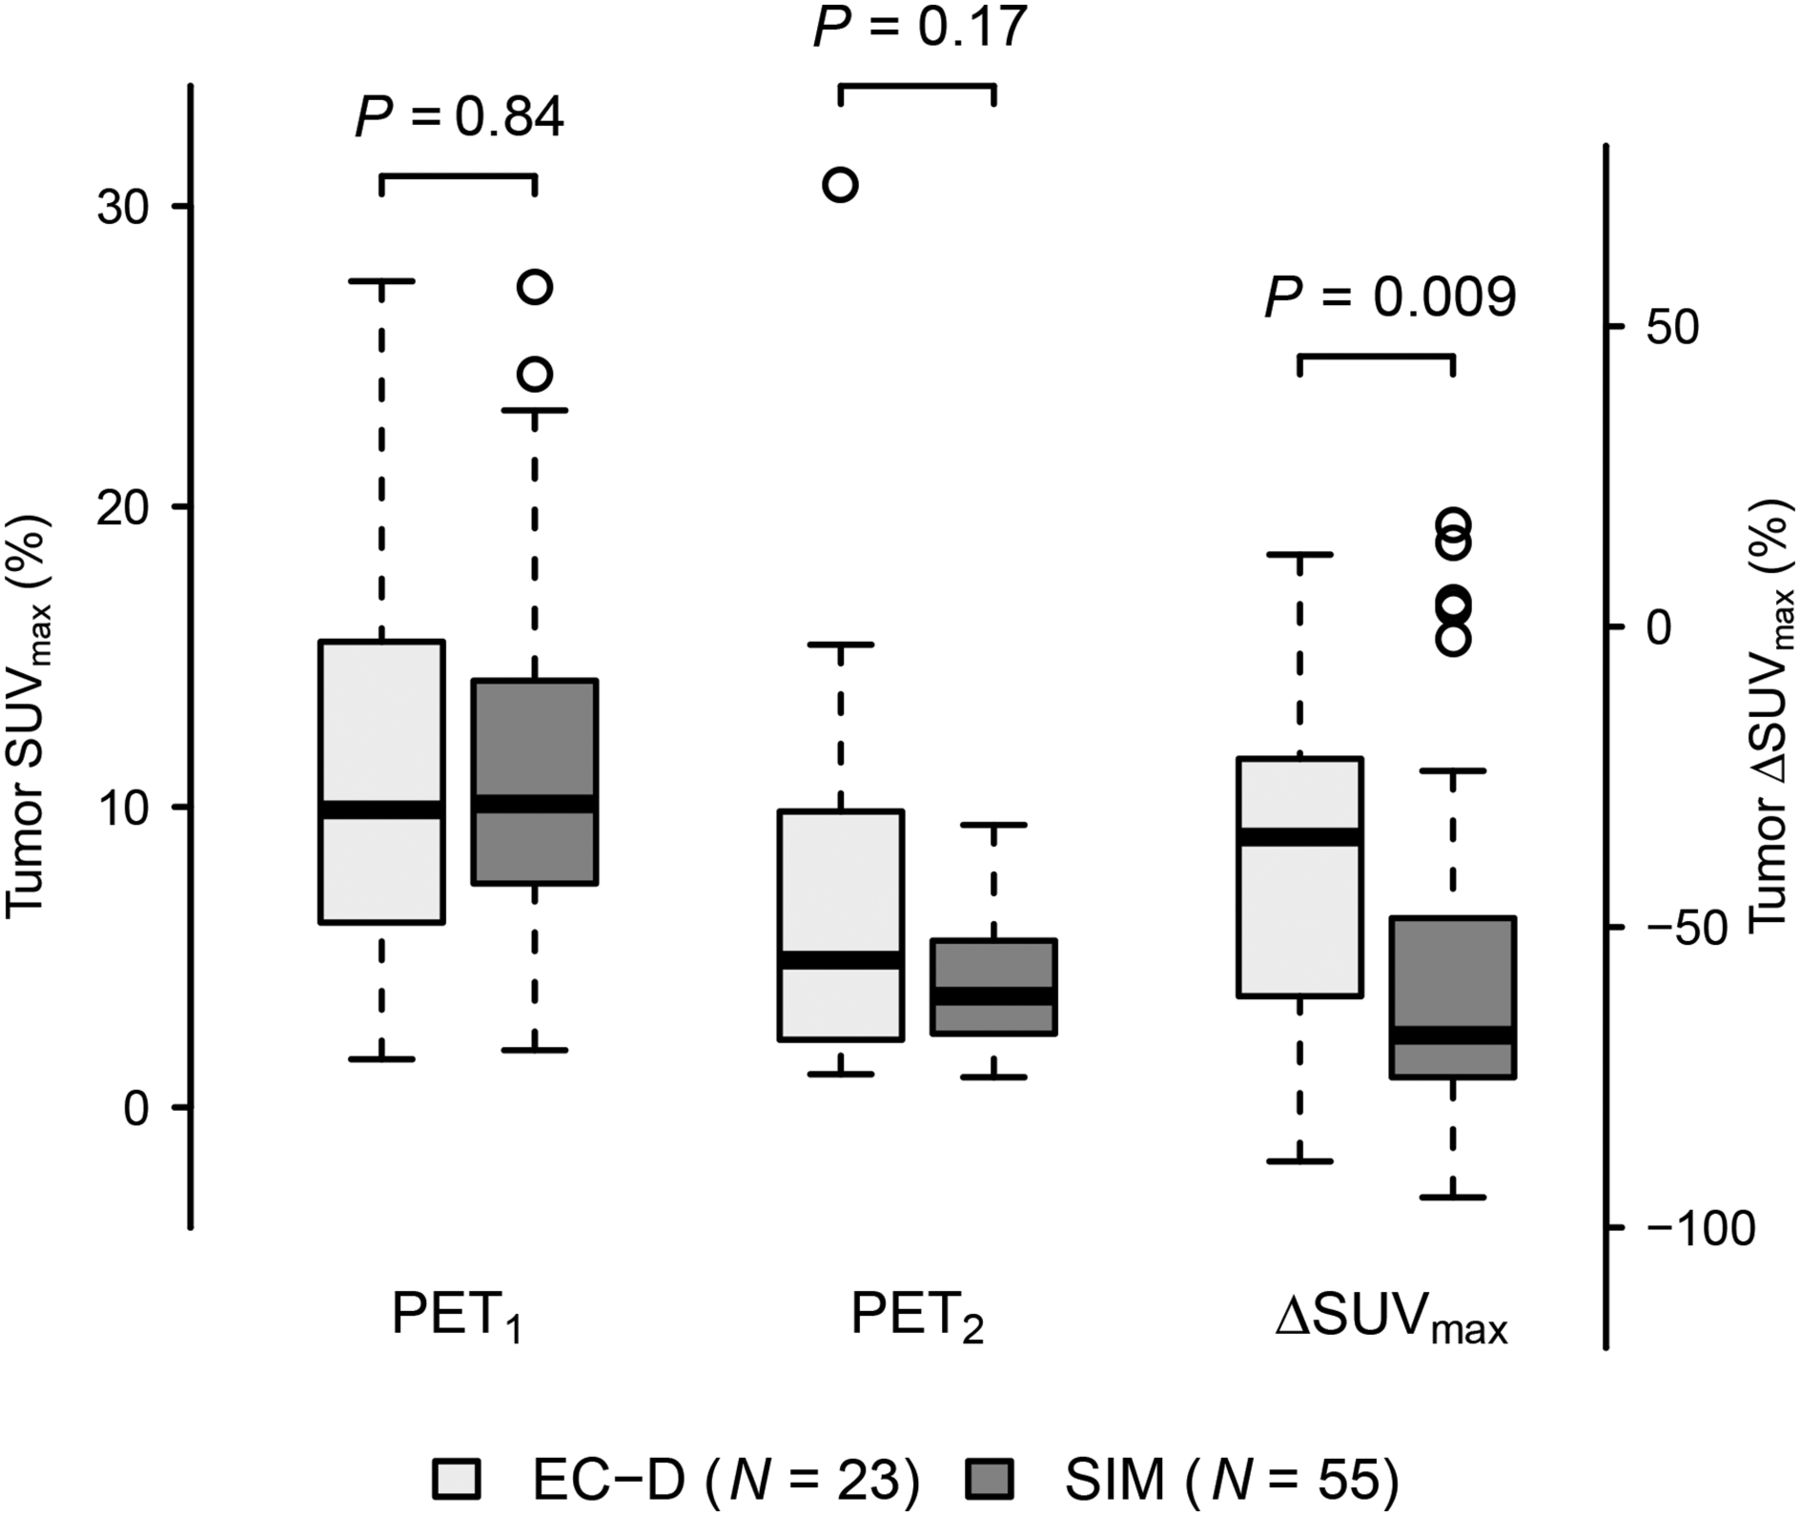
SUVmax of primary tumor at PET1 and PET2 and ΔSUVmax in EC-D and SIM groups.

ΔSUVmax according to pathologic response after neoadjuvant chemotherapy (pCR vs. non-pCR) in whole population and in EC-D and SIM groups.
Performance of Various ΔSUVmax Cut-Offs in Predicting Non-pCR in EC-D and SIM Groups
Relation Between EFS and Clinical, Biologic, Histopathologic, and PET Parameters
Median follow-up was 34 mo (range, 3–85 mo) in the whole population, 61 mo in the EC-D group, and 26 mo in the SIM group. Twenty-two patients relapsed (15 with distant metastases), and 10 of them died.
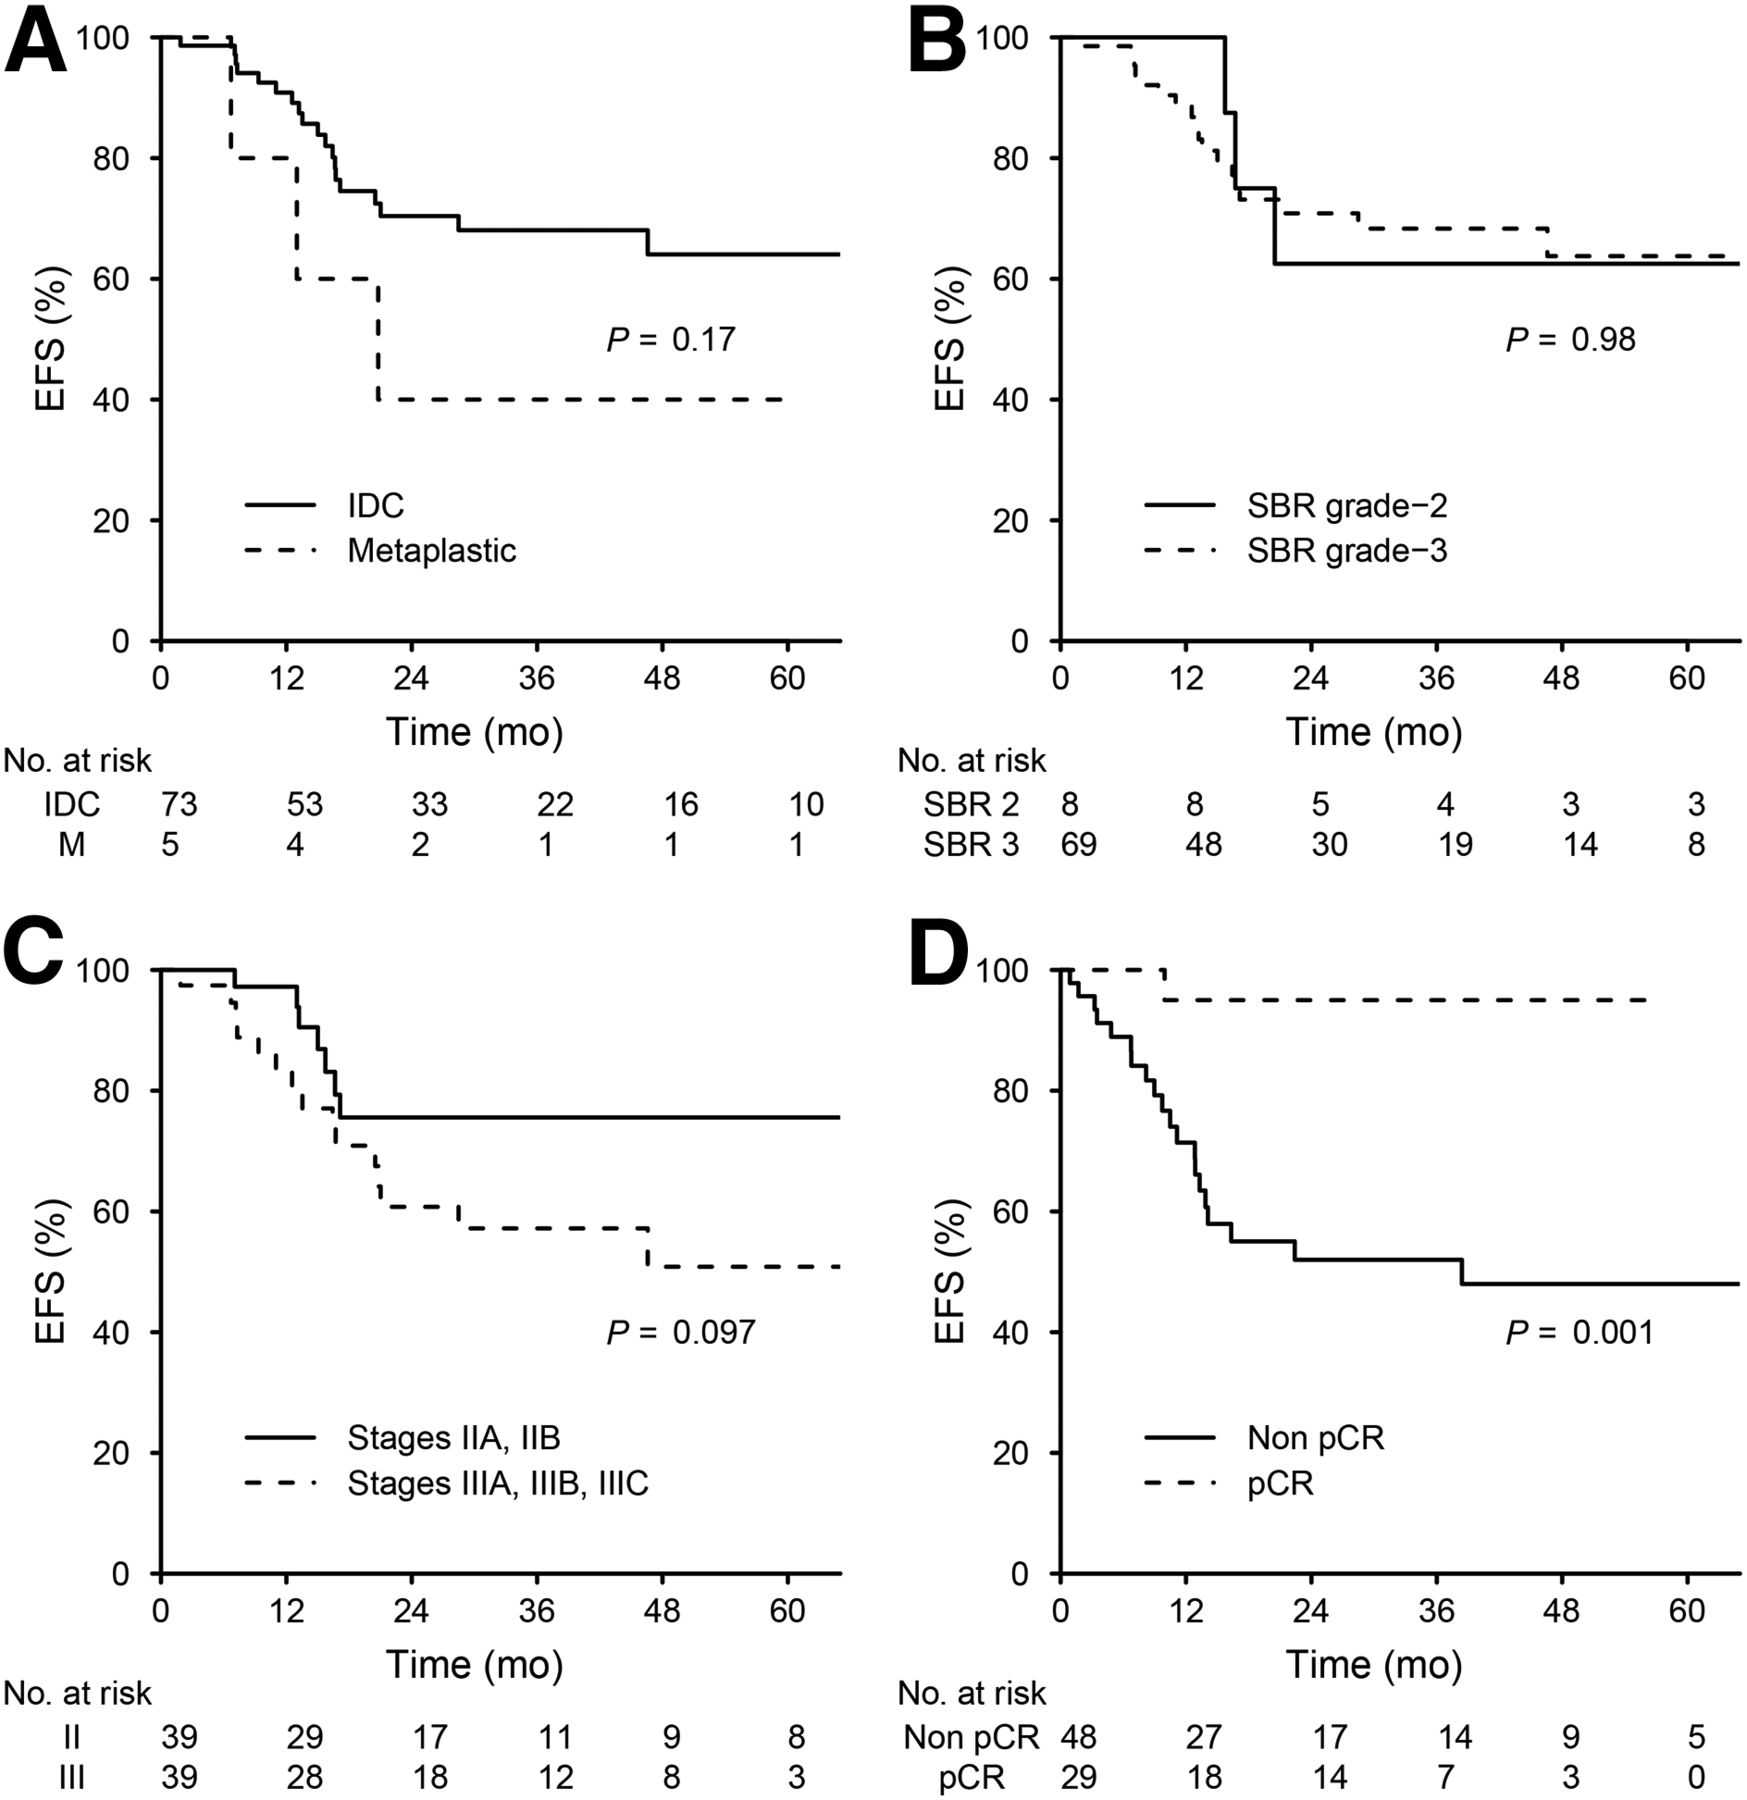
In the whole population, pCR was significantly associated with EFS (log-rank, P = 0.001) (Fig. 4). ΔSUVmax was also associated with EFS (hazard ratio for a 10% decrease, 0.86; 95% confidence interval, 0.78–0.94; P = 0.001). EFS was not associated with tumor SBR grade (log-rank, P = 0.98), histologic subtype (log-rank, P = 0.17), or AJCC stage (log-rank, P = 0.097) (Fig. 4).

Kaplan–Meier curves for EFS in 78 patients according to tumor histology (A), SBR grade (B), AJCC stage (C), and pathology findings after neoadjuvant chemotherapy (D).
In multivariate analysis, ΔSUVmax was not significantly associated with EFS after the date of surgery when adjusted for pathologic response (P = 0.29). However, ΔSUVmax was associated with EFS from the date of diagnosis when adjusted for AJCC stage (P = 0.004).
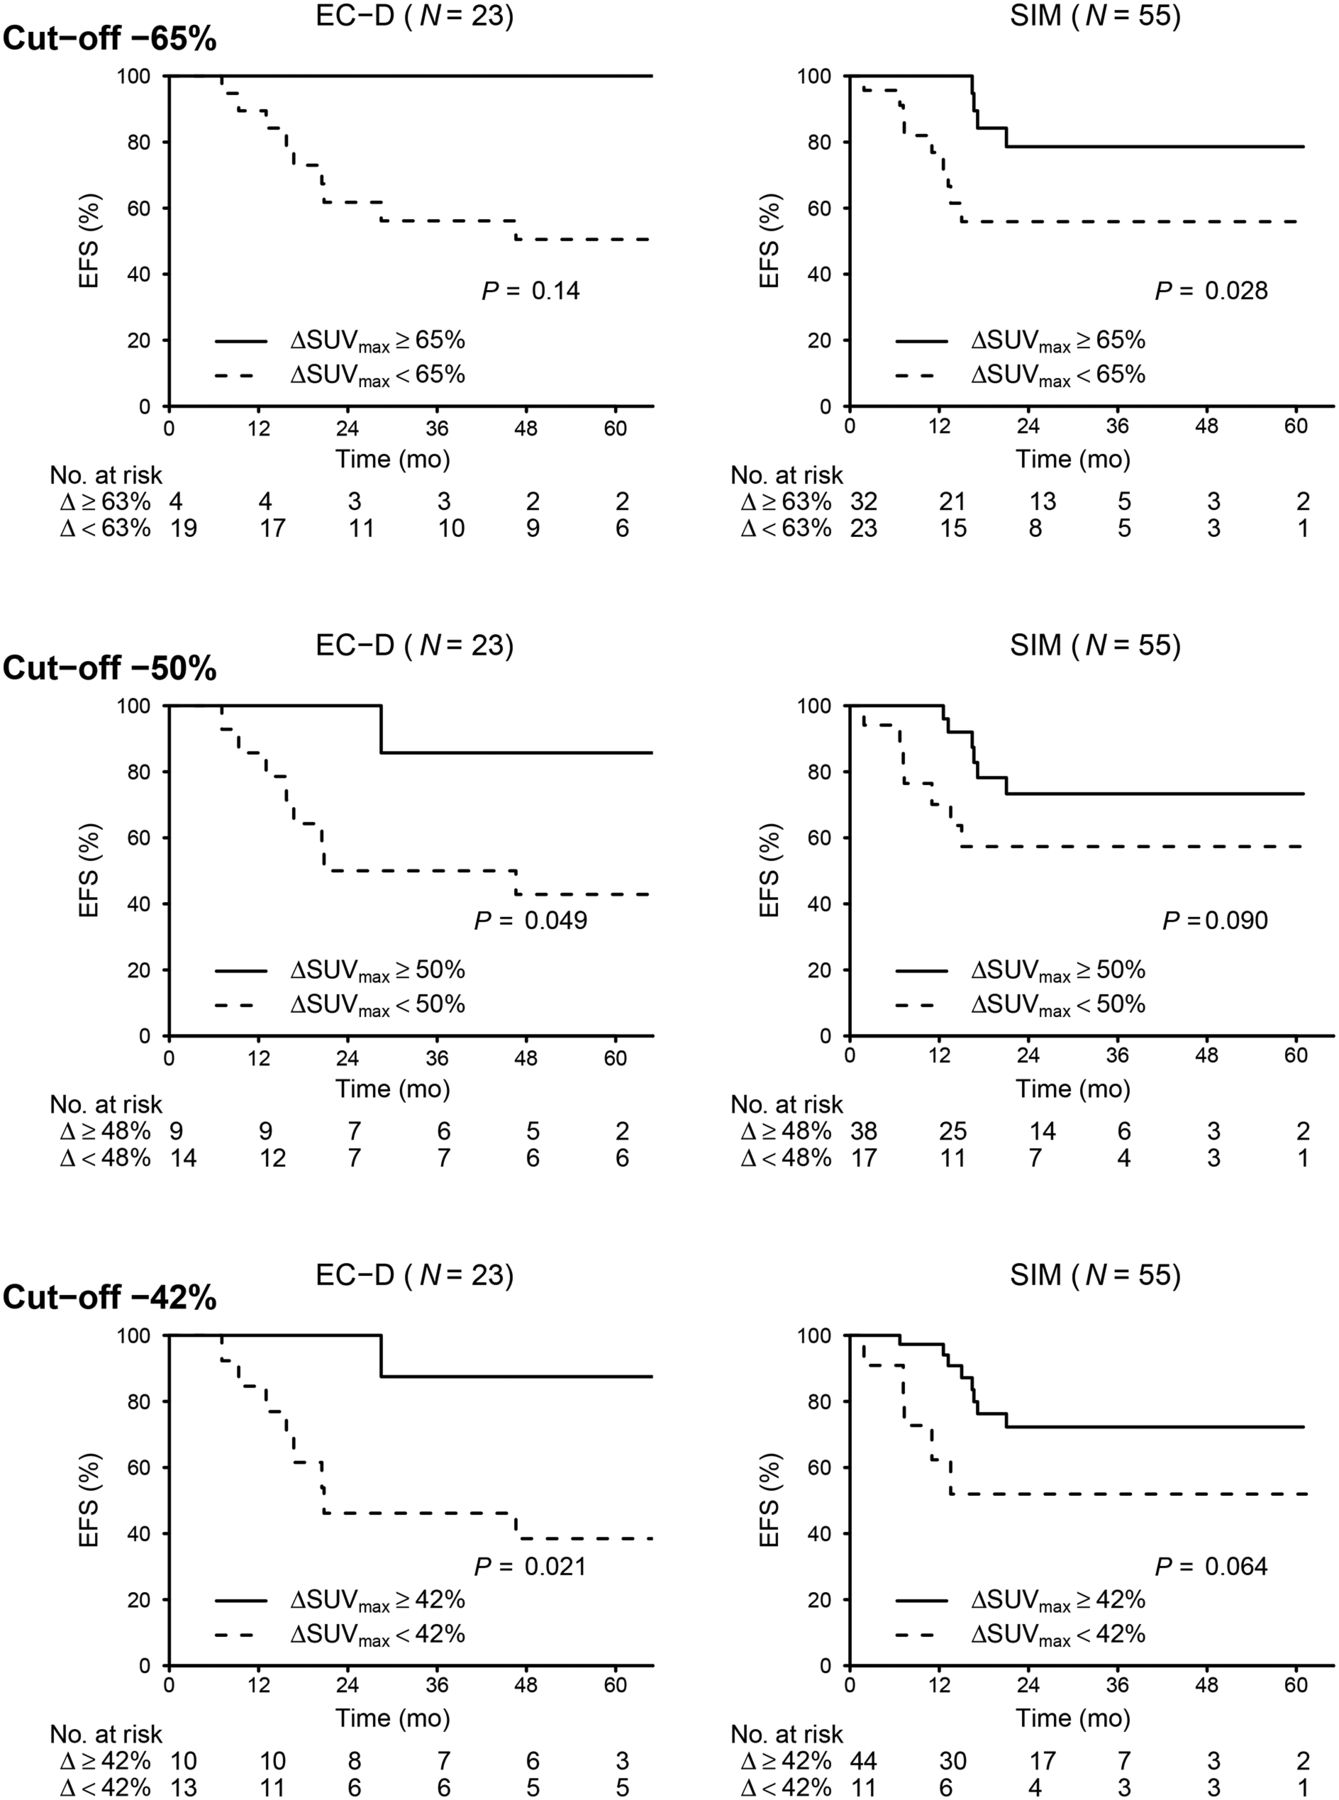
ΔSUVmax was predictive of EFS regardless of the chemotherapy type (Fig. 5). As observed in the prediction of pCR, the cutoff to predict EFS was also higher in the SIM group. A cutoff ΔSUVmax of −65% was able to predict EFS in this group (log rank, P = 0.028) but not in the EC-D group (log rank, P = 0.14) (Fig. 5). In the 23 patients treated with EC-D, a cutoff ΔSUVmax of −50% was close to significance in predicting EFS (log rank, P = 0.049). The value −42% was strongly associated with EFS (P = 0.021), confirming our previous finding (15) with a longer follow-up.

Kaplan–Meier curves for EFS according to metabolic response after 2 courses of neoadjuvant chemotherapy. Analysis was performed with 3 different ΔSUVmax cutoffs.
DISCUSSION
In 78 TNBC patients, we observed a strong association between pCR and EFS (P = 0.001). These results are in line with a recent metaanalysis (2). If pathologic response could be predicted earlier, treatment might then be adapted to increase the pCR rate and potentially improve patient outcomes (11), as recently demonstrated for HER2-positive breast cancer patients (18).
Discordant results have been observed in TNBC patients (14–17,19,21). Two teams found that PET information was helpful in predicting pCR early (14,16), whereas in one other report PET was not predictive (17). Unlike their preliminary findings (15), Humbert et al. recently reported that PET has high accuracy in predicting pCR (22). In a multicenter study (mixing TNBC and hormone-positive/HER2-negative breast cancer), PET was also predictive (23).
The results of our study are important because they show that the decrease in 18F-FDG uptake is dependent on the chemotherapy regimen. The change in breast tumor metabolism as assessed by 18F-FDG imaging after 2 cycles was less pronounced with EC-D than with SIM (−35% vs. −68%, P = 0.009). Thus, the optimal ΔSUVmax cutoff for predicting non-pCR appears to depend on specific regimens (Table 5). Novel therapy strategies are limited in TNBC patients, and treatment should be modified only when there is a low probability of achieving pCR with initial chemotherapy. When considering specificity superior to 90% (pCR rate < 10% in nonresponders) and good sensitivity to predict residual disease, optimal ΔSUVmax cutoffs were close to −65% in the SIM group and close to −50% in the EC-D group (Table 5). The best prediction was obtained with ΔSUVmax measured in the primary tumor. Combining changes in the tumor and axillary nodes had no added value.
Interestingly, metabolic response was also predictive of patient outcome regardless of the type of chemotherapy (Fig. 5).
Our single-institution study had some limitations. Although interim PET was always performed after the second cycle, the median time between baseline PET and interim PET was lower in the SIM group (6 vs. 8 wk). However, despite a shorter time since the beginning of treatment, the fact that ΔSUVmax was larger in the SIM group than in the EC-D group (−68% vs. −35%, P = 0.009) suggests that the 18F-FDG decrease was dependent on the chemotherapy regimen. The chemotherapy regimen was chosen without randomization. Indeed, in 2009 our institution shifted toward use of SIM in TNBC patients (20). The groups did not have the same number of patients (23 patients in the EC-D group and 55 in the SIM group). SBR grade 3 tumors were more frequent in patients treated with SIM (P = 0.039). Median follow-up was also shorter in the SIM group.
CONCLUSION
Our study confirmed that the change in 18F-FDG tumor uptake after 2 cycles of neoadjuvant chemotherapy in TNBC patients allowed early detection of pCR and early prediction of outcome. However, the decrease in tumor SUVmax was dependent on the neoadjuvant chemotherapy regimen, with the level of decrease being more important in dose-dense, dose-intense chemotherapy than in a standard-dose schedule. The optimal SUVmax cutoff for early prediction of pCR and patient survival therefore varies with the type of chemotherapy.
DISCLOSURE
The costs of publication of this article were defrayed in part by the payment of page charges. Therefore, and solely to indicate this fact, this article is hereby marked “advertisement” in accordance with 18 USC section 1734. This study was in part supported by an academic grant from the French National Cancer Institute (“Translational Research in Oncology,” INCa-DGOS-5697). No other potential conflict of interest relevant to this article was reported.
Footnotes
Published online Dec. 23, 2015.
- © 2016 by the Society of Nuclear Medicine and Molecular Imaging, Inc.
REFERENCES
- Received for publication July 16, 2015.
- Accepted for publication November 23, 2015.


Jump to section
Related Articles
Cited By...
- The Current and Future Roles of Precision Oncology in Advanced Breast Cancer
- 68Ga-Labeled Fibroblast Activation Protein Inhibitor PET/CT for the Early and Late Prediction of Pathologic Response to Neoadjuvant Chemotherapy in Breast Cancer Patients: A Prospective Study
- Association of Pathologic Complete Response with Long-Term Survival Outcomes in Triple-Negative Breast Cancer: A Meta-Analysis
- Now Is the Time to Use 18F-FDG PET/CT to Optimize Neoadjuvant Treatment in Triple-Negative Breast Cancer!
- Bevacizumab Induces Acute Hypoxia and Cancer Progression in Patients with Refractory Breast Cancer: Multimodal Functional Imaging and Multiplex Cytokine Analysis
- Complete Metabolic Response on Interim 18F-Fluorodeoxyglucose Positron Emission Tomography/Computed Tomography to Predict Long-Term Survival in Patients with Breast Cancer Undergoing Neoadjuvant Chemotherapy