


Abstract
Classification of subjects on the basis of amyloid PET scans is increasingly being used in research studies and clinical practice. Although qualitative, visual assessment is currently the gold standard approach, automated classification techniques are inherently more reproducible and efficient. The objective of this work was to develop a statistical approach for the automated classification of subjects with different levels of cognitive impairment into a group with low amyloid levels (AβL) and a group with high amyloid levels (AβH) through the use of amyloid PET data from the Alzheimer Disease Neuroimaging Initiative study. Methods: In our framework, an iterative, voxelwise, regularized discriminant analysis is combined with a receiver operating characteristic approach that optimizes the selection of a region of interest (ROI) and a cutoff value for the automated classification of subjects into the AβL and AβH groups. The robustness, spatial stability, and generalization of the resulting target ROIs were evaluated by use of the standardized uptake value ratio for 18F-florbetapir PET images from subjects who served as healthy controls, subjects who had mild cognitive impairment, and subjects who had Alzheimer disease and were participating in the Alzheimer Disease Neuroimaging Initiative study. Results: We determined that several iterations of the discriminant analysis improved the classification of subjects into the AβL and AβH groups. We found that an ROI consisting of the posterior cingulate cortex/precuneus and the medial frontal cortex yielded optimal group separation and showed good stability across different reference regions and cognitive cohorts. A key step in this process was the automated determination of the cutoff value for group separation, which was dependent on the reference region used for the standardized uptake value ratio calculation and which was shown to have a relatively narrow range across subject groups. Conclusion: We developed a data-driven approach for the determination of an optimal target ROI and an associated cutoff value for the separation of subjects into the AβL and AβH groups. Future work should include the application of this process to other datasets to facilitate the determination of the translatability of the optimal ROI obtained in this study to other populations. Ideally, the accuracy of our target ROI and cutoff value could be further validated with PET-autopsy data from large-scale studies. It is anticipated that this approach will be extremely useful for the enrichment of study populations in clinical trials involving putative disease-modifying therapeutic agents for Alzheimer disease.
The advent of PET radiotracers with high specificity for β-amyloid plaques represents a paradigm shift in Alzheimer disease (AD) research. The use of amyloid PET has markedly improved the understanding of the relationship between β-amyloid pathology and cognition (1–3), brain structure (4,5), cerebral glucose metabolism (6–8), and brain connectivity (9–11). In addition, amyloid PET is increasingly being used for the enrichment of study populations with “amyloid-positive” subjects in clinical trials of putative agents for reducing amyloid levels (12–14). Finally, the approval of several 18F-labeled tracers by regulatory authorities has facilitated the use of amyloid PET as part of the clinical diagnostic work-up for patients with cognitive impairment.
In conventional amyloid PET studies, the standardized uptake value ratio (SUVR) is used to assess a subject’s amyloid status. The cerebellum has been widely used as the reference region for amyloid PET studies. Clark et al. (15) found that the whole cerebellum provided the strongest correlation between in vivo 18F-florbetapir SUVR and postmortem, quantitative immunohistochemistry measures. However, the cerebellum may not satisfy the conditions for a reference region in certain cases, including familial forms of AD and cerebral amyloid angiopathy, in which cerebellar amyloid is present; other reference regions (e.g., pons, centrum semiovale, and cerebral white matter) are preferred in such cases (16–19).
In addition to selection of the most suitable reference region for the analysis of amyloid PET data, determination of the appropriate target region (i.e., the numerator in an SUVR-based analysis) and corresponding cutoff value for the SUVR are also matters of current debate. The choice of a suitable target region of interest (ROI) is crucial for quantitative analysis of PET imaging data. Several amyloid PET target ROIs, varying from the whole cortex (20) to more specific cortical regions (e.g., frontal, superior parietal, lateral temporal, lateral occipital, medial temporal, anterior cingulate, and posterior cingulate cortex), have been proposed (21–25). Although these target regions have largely been selected on the basis of high levels of tracer binding, they are not necessarily optimal for the classification of subjects into a group with low amyloid levels (AβL) and a group with high amyloid levels (AβH) (we prefer this terminology over “amyloid-negative” and “amyloid-positive” because the latter terms depend on neuropathologic confirmation). Further, the classification of subjects into the AβL and AβH groups depends on the specification of an SUVR cutoff value that separates subjects into 2 populations according to the amount of tracer binding in the predefined target ROI. A common approach has been determination of the optimal cutoff value from a control population (e.g., cognitively normal subjects) (7,25–27). The main drawback of this approach is that the cutoff value is typically dependent on the SUVR distribution in the control group.
The objective of this work was to use a data-driven approach to determine the target region and associated SUVR threshold for achieving maximal separation between AβL and AβH groups. To assess the robustness and generalization of the resulting target region, we performed extensive testing using different subject populations and different reference regions.
MATERIALS AND METHODS
Subjects and Image Acquisition
Data used in the preparation of this article were obtained from the Alzheimer Disease Neuroimaging Initiative (ADNI) database (http://adni.loni.usc.edu). The ADNI was launched in 2003 by the National Institute on Aging, the National Institute of Biomedical Imaging and Bioengineering, the Food and Drug Administration, private pharmaceutical companies, and nonprofit organizations as a $60 million, 5-y public–private partnership. The primary goal of the ADNI has been to test whether serial MR imaging, PET, other biologic markers, and clinical and neuropsychological assessments can be combined to measure the progression of mild cognitive impairment (MCI) and AD. The determination of sensitive and specific markers of early AD progression is intended to aid researchers and clinicians in developing new treatments and monitoring their effectiveness as well as to lessen the time and cost of clinical trials.
ADNI is the result of efforts of many coinvestigators from a broad range of academic institutions and private corporations, and subjects have been recruited from more than 50 sites across the United States and Canada. The initial goal of ADNI was to recruit 800 subjects, but ADNI has been followed by ADNI-GO and ADNI-2. To date, these 3 protocols have recruited over 1,500 adults, ages 55–90, to participate in the research, consisting of cognitively normal older individuals, people with early or late MCI, and people with early AD. The follow-up duration of each group is specified in the protocols for ADNI-1, ADNI-2, and ADNI-GO. Subjects originally recruited for ADNI-1 and ADNI-GO had the option to be followed in ADNI-2. For up-to-date information, see www.adni-info.org.
The subjects in the present study were participants in the ADNI study and for whom 18F-florbetapir PET, 3-dimensional T1-weighted anatomic MR imaging, and apolipoprotein E (APOE) ε4 genotyping data were available (155 healthy control [HC] subjects, 151 subjects with early MCI [EMCI], 125 subjects with late MCI [LMCI], and 23 subjects with AD). Cognitively normal subjects had Mini-Mental State Examination (MMSE) scores between 24 and 30 inclusively; had a Clinical Dementia Rating of 0; and did not have depression, MCI, or dementia. Subjects classified as having EMCI had MMSE scores between 24 and 30 inclusively, a Clinical Dementia Rating of 0.5, a reported subjective memory concern, an absence of dementia, an objective memory loss measured by education-adjusted scores on delayed recall of a paragraph from the Wechsler Memory Scale Logical Memory II, essentially preserved activities of daily living, and no impairment in other cognitive domains. Subjects classified as having LMCI had the same inclusion criteria, except for the objective memory loss measured by education-adjusted scores on delayed recall of a paragraph from the Wechsler Memory Scale Logical Memory II. Subjects classified as having AD had MMSE scores ranging from 20 to 26 inclusively, had a Clinical Dementia Rating of 0.5 or higher, and met the criteria of the National Institute of Neurological and Communicative Disorders and Stroke and the Alzheimer’s Disease and Related Disorders Association for probable AD.
Subject characteristics are shown in Table 1. We grouped the subjects into 2 cohorts to examine the stability of the proposed optimal target ROI across subjects with different levels of cognitive impairment. Cohort 1 included subjects with EMCI and LMCI, and cohort 2 consisted of HC subjects and subjects with AD. A detailed description of the ADNI MR imaging and PET image acquisition protocols is available at http://adni.loni.usc.edu/methods. ADNI studies are conducted in accordance with Good Clinical Practice guidelines, the Declaration of Helsinki, and U.S. 21 CFR §50 (Protection of Human Subjects) and §56 (Institutional Review Boards). This study was approved by the institutional review boards of all participating institutions. Informed written consent was obtained from all participants at each site.
Subject Characteristics
Image Processing
All MR and PET images were processed with the PIANO software package (Biospective Inc.). T1-weighted MR imaging volumes underwent image nonuniformity correction with the N3 algorithm (28), brain masking, linear spatial normalization with a 9-parameter affine transformation, and nonlinear spatial normalization (29) to map individual images from native coordinate space to Montreal Neurological Institute reference space through the use of a customized, anatomic MR imaging template derived from subjects in the ADNI study. The resulting image volumes were segmented into gray matter, white matter, and cerebrospinal fluid (CSF) with an artificial neural network classifier (30) and partial-volume estimation (31). The gray matter density map for each subject was transformed to the same final spatial resolution (i.e., resampled to the same voxel size and spatially smoothed) as the 18F-FDG PET data to account for confounding effects of atrophy in the statistical model. The cerebral midcortical surface (i.e., the midpoint between the pia and the white matter) for each hemisphere was extracted to allow for surface projection of PET data with a modified version of the CLASP algorithm (32).
The 18F-florbetapir PET images underwent several preprocessing steps, including frame-to-frame linear motion correction, smoothing with scanner-specific blurring kernels, and averaging of dynamic frames into a static image. The scanner-specific blurring kernels that were used to obtain isotropic spatial smoothing of 8 mm full width at half maximum across all PET data were based on the work of Joshi et al. (33) to reduce the between-scanner differences in the ADNI multicenter study. The resulting smoothed PET volumes were linearly registered to the subject’s T1-weighted MR imaging volumes and, subsequently, spatially normalized to reference space by use of the nonlinear transformations derived from the anatomic MR imaging registration. Voxelwise SUVR maps were generated from 18F-florbetapir PET by use of several reference regions, including full cerebellum, cerebellar gray matter, cerebellar white matter, pons, and cerebral white matter. The cortical SUVR measures were projected onto the cortical surface, and the data from each subject were mapped to a customized surface template by nonrigid 2-dimensional surface registration for visualization purposes (34).
Subject Characteristic Analysis
A statistical analysis of the characteristics of subjects within each cohort was performed. The clinical classification (HC, EMCI, LMCI, and AD) and the APOE ε4 genotype (noncarrier and carrier) were treated as independent, binary categorical variables. Cognitive performance measures, including the MMSE score and the Alzheimer Disease Assessment Scale–Cognitive Subscale score, as well as CSF Aβ1–42 levels, were treated as continuous variables. Associations among categoric variables (e.g., sex, clinical classification, and APOE ε4 genotype) were determined by use of contingency tables, whereas an ANOVA was used for continuous variables (e.g., age, 18F-florbetapir SUVR across the whole cerebral cortex [SUVRWC], MMSE, Alzheimer Disease Assessment Scale–Cognitive Subscale, and CSF Aβ1–42). The statistical significance for all tests was set at an α level of 0.05. All values are reported as mean ± SD.
Optimal Target ROI Definition
The mean 18F-florbetapir SUVRWC was calculated for each subject. An initial regularized discriminant analysis (RDA) (35) was performed to determine the optimal threshold for separating subjects into 2 distinct classes on the basis of individual SUVRWC measurements. The RDA assumes an underlying Gaussian distribution and defines discriminative functions on the basis of the sample means and covariance matrices. The RDA includes a regularization parameter that controls the degree of contraction of each individual class covariance matrix estimate (quadratic discriminant analysis) toward the pooled (over all classes) covariance matrix (linear discriminant analysis). As a result, the RDA is a general discriminant analysis technique that includes the linear discriminant analysis and the quadratic discriminant analysis as particular cases. Individual 18F-florbetapir SUVRWC measurements were ranked, and cutoff values that separated the measurements into 2 different classes were defined. The RDA defined the contraction parameter that yielded the maximal accuracy at each cutoff value. The optimal cutoff value was then determined through a receiver operating characteristic (ROC) analysis. On the basis of this cutoff value for the SUVRWC, subjects were designated as being in the AβL group or the AβH group.
This preliminary classification of subjects served to initialize an automated, iterative, voxelwise RDA to optimize the selection of a set of ROIs and a cutoff value for the automated reclassification of subjects into the AβL and AβH groups; a flow diagram is shown in Figure 1. Specifically, at the first iteration, an RDA was performed at every cortical voxel to produce maps of accuracy, specificity, and sensitivity (relative to the subject’s current classification in the AβL group or the AβH group). Thresholds were applied to these maps by use of a nonparametric permutation approach for the control of multiple comparisons (36). The conjunction (i.e., intersection) of the resulting thresholded maps served to define a single, composite ROI that maximized accuracy, specificity, and sensitivity. The average 18F-florbetapir SUVR was then computed over this composite ROI (SUVRROI) for each subject. Another round of RDA was performed on the basis of the SUVRROI data, rather than the voxelwise values, and an optimal cutoff value for the SUVRROI was determined through an ROC analysis. On the basis of this new cutoff value, the subjects were reclassified into the AβL and AβH groups. With this approach, the subjects were reclassified as being in the AβL group or the AβH group on the basis of an RDA analysis from a data-driven, composite ROI and an associated optimal cutoff value. The entire process was repeated until the subject classifications remained stable.

Flow diagram of automated, iterative process for classification of subjects according to β-amyloid level.
RESULTS
Subject Characteristics
The analysis of the characteristics of cohort 1 subjects revealed no statistically significant association between clinical classification (EMCI vs. LMCI) and APOE ε4 genotype (P = 0.08). Similarly, there was no significant association between sex and clinical classification (P = 0.82). In contrast, there was a statistically significant age difference between subjects with EMCI and subjects with LMCI (P = 0.0017). There was also a statistically significant difference in the initial SUVRWC measurements (with the full cerebellum as a reference region) (P = 0.002) between subjects with EMCI (1.21 ± 0.17) and subjects with LMCI (1.28 ± 0.18). Statistical analysis of the cognitive measures and CSF biomarkers shown in Table 1 revealed strong, statistically significant differences (P < 0.0001) between subjects with EMCI and subjects with LMCI.
The analysis of the data from cohort 2 subjects revealed a statistically significant association (P < 0.0001) between clinical classification (HC vs. AD) and APOE ε4 genotype but no significant association (P = 0.24) with sex. As in cohort 1, the initial SUVRWC measurements were significantly higher (P < 0.001) in the AD group (1.36 ± 0.20) than in the HC group (1.17 ± 0.15). There were strong, statistically significant differences in the cognitive performance measures and CSF Aβ1–42 (P < 0.0001) between the HC group and the AD group.
Optimal Target ROI
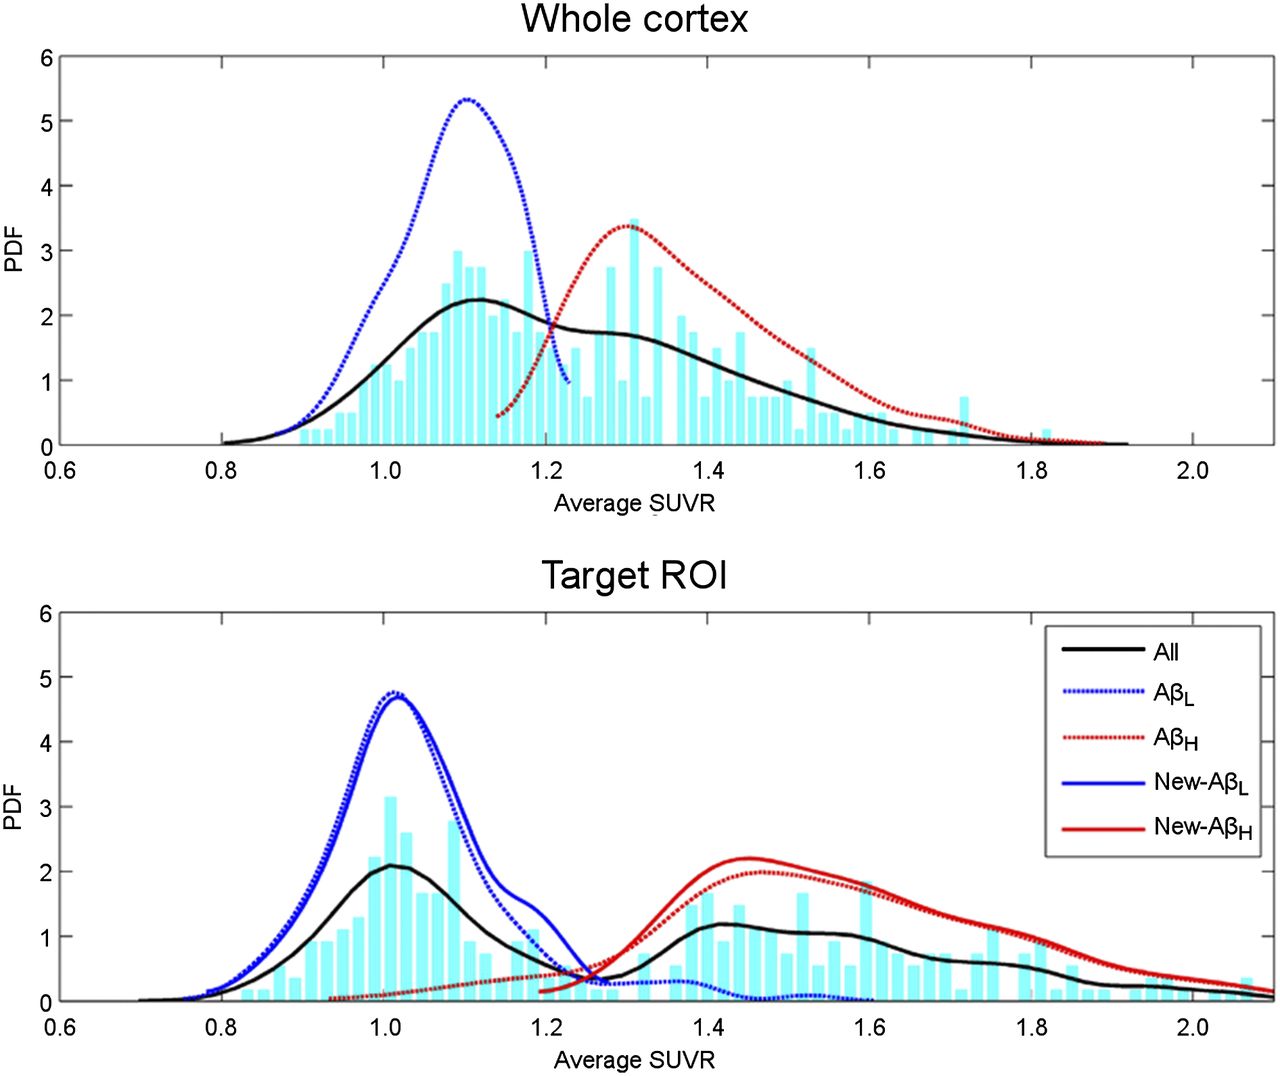
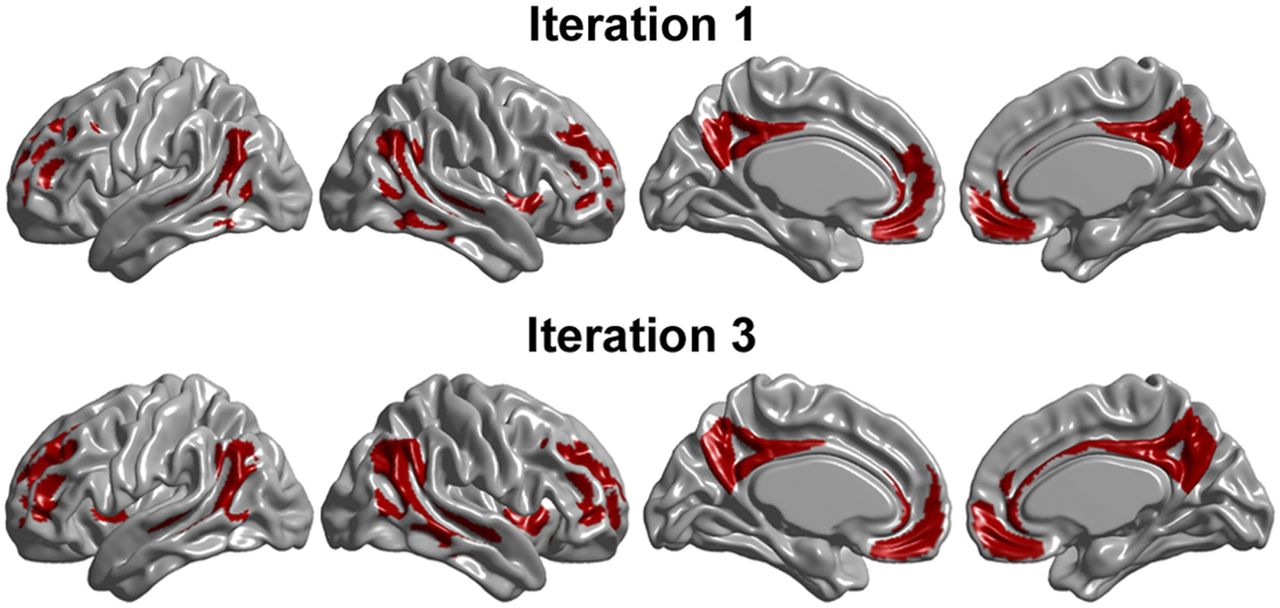
The initial RDA and ROC analysis of the SUVRWC (with the full cerebellum as a reference region) for cohort 1 yielded a cutoff value of 1.20. The top row in Figure 2 shows the distribution and estimated probability density function of the SUVRWC. This analysis separated cohort 1 into 2 groups, consisting of 131 subjects in the AβL group, with an SUVRWC of less than or equal to 1.20, and 145 subjects in the AβH group, with an SUVRWC of greater than 1.20. This preliminary classification was used to initialize the voxelwise RDA that generated the accuracy, specificity, and sensitivity maps shown in Figure 3. Permutation testing with a multiple-comparison correction approach yielded respective thresholds of 0.80, 0.86, and 0.83, which revealed that the bilateral precuneus and medial frontal cortex regions had statistically significant, high values for accuracy, specificity, and sensitivity. The conjunction (i.e., intersection) of the thresholded maps produced a composite target ROI (top row in Fig. 4) corresponding to the first iteration of our automated classification process. The ROC analysis over the SUVRROI corresponding to this composite target region yielded a cutoff value for the SUVRROI of 1.27.

(Top) Distribution and estimated probability density function (PDF) of whole-cortex SUVRWC. RDA combined with ROC analysis initially separated cohort 1 into 2 groups, consisting of 131 AβL and 145 AβH subjects. (Bottom) Distribution and estimated probability density function of target ROI SUVR obtained during 4 iterations of automated discrimination process. All = mean for all subjects; AβL and AβH = initial classification; New-AβL and New-AβH = definitive classification based on optimal target SUVRROI.

Cortical surface representation of non-thresholded maps of accuracy, specificity, and sensitivity after 1 iteration of voxelwise RDA.

Target ROIs resulting from initial and final iterations of voxelwise RDA for cohort 1. Final, optimal target ROI included bilateral regions of precuneus and medial frontal cortex. Cutoff value of 1.24 for average optimal target ROI separated cohort 1 into 2 groups, consisting of 135 AβL and 141 AβH subjects.
Three additional iterations were performed to obtain the definitive composite target ROI (bottom row in Fig. 4) that maximized the separation of cohort 1 subjects into the AβL and AβH groups. The resulting distribution and estimated probability density function of the optimal target SUVRROI are also shown in Figure 2. The sample size distribution of the 2 groups and the optimal cutoff values obtained in each iteration are shown in Table 2. To illustrate the dynamic allocation of subjects into the 2 groups during the iterative process, Table 2 also shows the accuracy, specificity, and sensitivity of the resulting classification with respect to the initial labeling, on the basis of the SUVRWC, and with respect to the preceding iteration. During the first iteration, 149 subjects were allocated into the AβH group, including 97.2% (i.e., sensitivity of 0.972) of the 145 AβH group subjects from the initial classification. By the fourth iteration, only 141 subjects were allocated into the AβH group, including 93.8% of the original 145 subjects in that particular group. Interestingly, none of the 128 subjects initially classified into the AβL group changed groups through subsequent iterations. The definitive classification of 135 subjects into the AβL group and 141 subjects into the AβH group on the basis of a cutoff value of 1.24 produced accuracy, specificity, and sensitivity values of 0.985, 0.970, and 1.000, respectively.
Sample Size Distribution, Optimal Cutoff Values, and Discrimination Parameters Obtained During Application of Automatic Iterative Process to Cohort 1
Given the lack of an autopsy gold standard, we correlated the SUVRROI in the optimal composite target ROI with the CSF Aβ1–42 in the subset of subjects for whom this measure was available. The SUVRROI in the optimal composite target ROI was strongly correlated (P < 0.0001) with the CSF Aβ1–42 across subjects in cohort 1 (Spearman correlation coefficient [r], −0.7361). The average CSF Aβ1–42 was significantly smaller (P < 0.0001) in the AβH group (133.54 ± 23.19) than in the AβL group (207.98 ± 41.32) (Table 3).
Clinical Outcomes and CSF Biomarkers in AβL and AβH Groups
Analogous to Figure 4, Supplemental Figure 1 (supplemental materials are available at http://jnm.snmjournals.org) shows the composite ROI for the optimal separation of cohort 1 subjects who had MCI into the AβL and AβH groups with cerebellar gray matter, cerebellar white matter, pons, and cerebral white matter as reference regions. The bilateral precuneus and medial frontal cortex defined a composite target ROI that remained stable across the 5 different reference regions used in the present study (Fig. 4 and Supplemental Fig. 1).
Figure 5 shows the composite target ROI resulting from the application of the iterative classification process to cohort 2 with the full cerebellum as a reference region. The optimal composite target ROI included the bilateral precuneus, medial frontal cortex, and regions in the temporal-parietal cortex. In this case, only 3 iterations were required to segregate this population into 108 subjects in the AβL group and 70 subjects in the AβH group, with a cutoff value of 1.29 and with accuracy, specificity, and sensitivity values of 0.983, 0.981, and 0.985, respectively.

Target ROIs resulting from initial and final iterations of voxelwise RDA for cohort 2. Final, optimal target ROI included bilateral regions of precuneus, medial frontal cortex, and temporal–parietal cortex.
Similar to cohort 1 subjects, the SUVRROI for cohort 2 subjects showed a statistically significant (P < 0.0001) correlation with the CSF Aβ1–42 (r, −0.7507). The average CSF Aβ1–42 was significantly smaller (P < 0.0001) in the AβH group (140.01 ± 37.05) than in the AβL group (215.31 ± 41.58) (Table 3).
Comparison with Anatomic Target ROI
The performance of our data-driven composite target ROI and associated, automated cutoff was compared with subject classification on the basis of the 18F-florbetapir SUVR (with the full cerebellum as a reference region) obtained from an anatomically predefined composite ROI. Specifically, this ROI included anatomically defined regions of the precuneus, posterior cingulate, and medial frontal cortex (cutoff value, 1.10); this ROI has been one of the most commonly used target ROIs for discriminating subjects with low and high levels of β-amyloid (15,25,37). The cutoff value of 1.10 for the SUVR obtained from the anatomically predefined composite ROI split cohort 1 into an AβL group with 111 subjects and an AβH group with 165 subjects. A discriminant analysis based on this classification demonstrated an accuracy of 0.942, a specificity of 0.981, and a sensitivity of 0.915; these values indicate a clear decrease in discriminative power relative to the accuracy of 0.985 achieved with our data-driven composite target ROI and cutoff of 1.24. A contingency table analysis of both classifications showed an agreement of 91.3%, explained by the identical classifications of 111 subjects into the AβL group and 141 subjects into the AβH group. Similarly, the cutoff value of 1.10 for the SUVR obtained from the anatomically predefined composite ROI split cohort 2 into an AβL group with 100 subjects and an AβH group with 78 subjects, with accuracy, specificity, and sensitivity values of 0.966, 0.970, and 0.961, respectively. This classification showed a 94.3% agreement with our automated, data-driven classification.
Stable Target ROIs
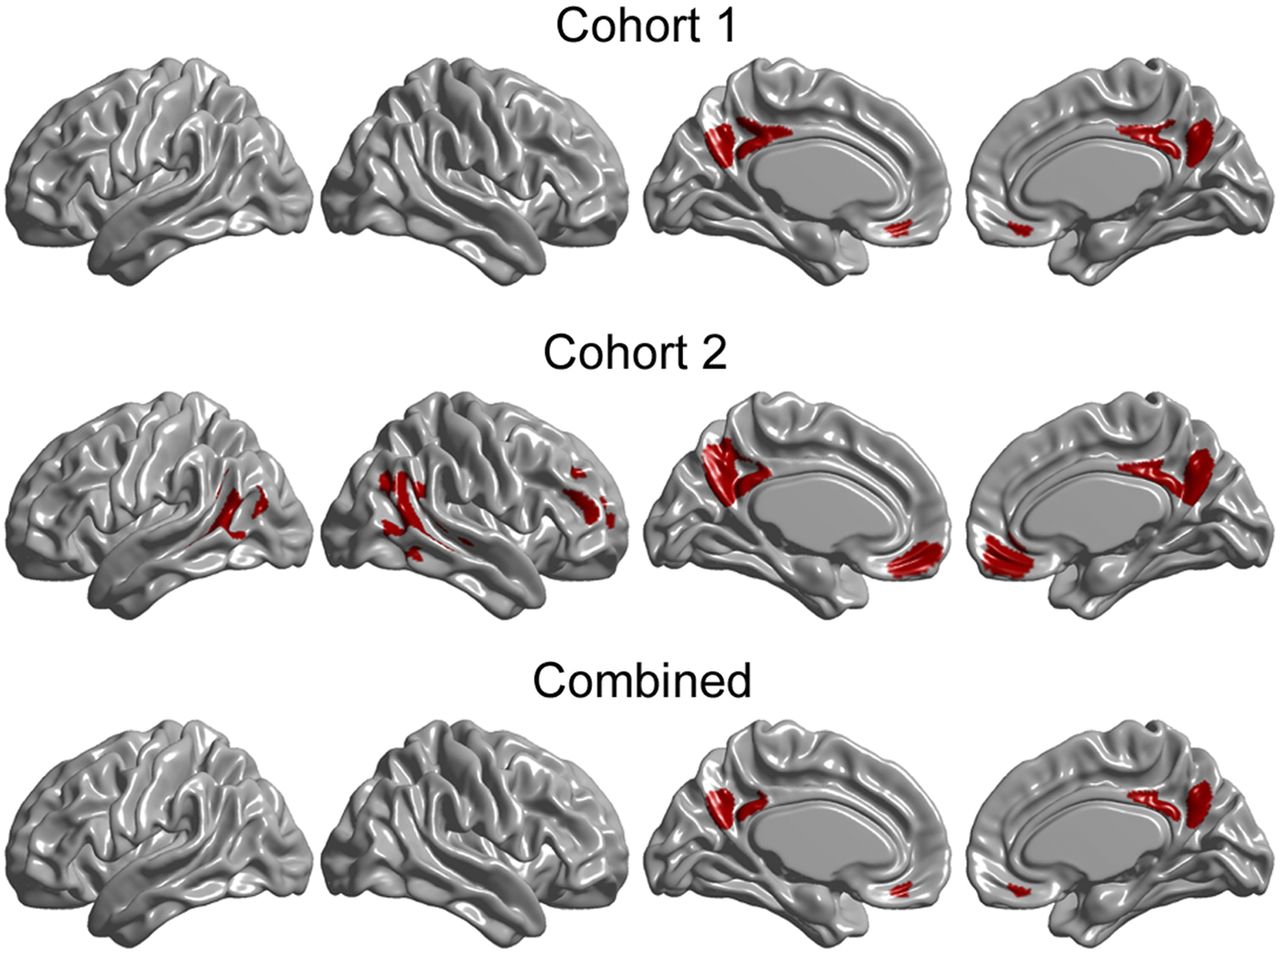
The intersection of the composite ROIs corresponding to the 5 different reference regions produced an optimal, stable composite ROI for cohort 1; this stable target ROI is shown in the top row of Figure 6. The high discriminative power (average accuracy, 0.987) of this ROI for cohort 1 (Supplemental Table 1) confirmed that this target ROI was indeed stable across the 5 different reference regions. Optimal composite ROIs were generated for cohort 2 (as for cohort 1) with cerebellar gray matter, cerebellar white matter, pons, and cerebral white matter as reference regions (Supplemental Fig. 2). Correspondingly, the intersection of the composite ROIs for these 5 reference regions produced a stable target ROI for cohort 2; this stable target ROI is shown in the middle row of Figure 6. The discriminative parameters and corresponding cutoff values of this ROI for cohort 2 are also shown in Supplemental Table 1.

(Top and Middle) Target ROIs resulting from intersection of target ROIs from different reference regions. (Bottom) Stable target ROI common to both cohorts.
To determine whether a “generalized” target ROI could be applied to both cohort 1 and cohort 2 with good performance characteristics, we intersected the target ROIs corresponding to the 2 cohorts; the resulting composite ROI is shown in the bottom row of Figure 6. The data in Supplemental Table 1 demonstrate that the composite ROI yielded results similar to those achieved with the ROIs from the individual cohorts. This finding suggests that the medial frontal cortex and the posterior cingulate or precuneus primarily drive the classification and that the lateral cortical regions in the stable target ROI for cohort 2 do not have a substantial influence on the group separation.
DISCUSSION
In this work, we introduced a new statistical framework for determining an optimal target region that best segregates subjects according to their level of 18F-florbetapir amyloid PET tracer binding. This approach involves the iterative generation of voxelwise maps of accuracy, specificity, and sensitivity, which are combined with a multiple-comparison criterion approach to produce the desired optimal target region. A subsequent ROC analysis over the target region SUVR measure yields the corresponding optimal cutoff value. The performance of this approach was evaluated with 2 different cohorts of subjects from the ADNI study, as well as SUVR measures computed from multiple different reference regions.
Our approach produced a generalized composite target ROI (“Combined” in Fig. 6) that included regions of the posterior cingulate cortex/precuneus and the medial frontal cortex and that showed good stability across the 2 different cohorts and the 5 different reference regions. Our results are in agreement with those reported by Camus et al. (20), who showed that the SUVRs in the posterior cingulate cortex, precuneus, and medial frontal cortex were statistically significantly higher in patients with AD than in subjects with MCI and HC subjects. Correspondingly, the SUVRs associated with the areas comprising our optimal target ROI have been reported to be highly correlated with the β-amyloid burden as measured by both immunohistochemistry and neuritic plaque density (15).
The initial step in our iterative process was to apply an RDA to individual SUVRWC measurements. The global cortex 18F-florbetapir SUVR was used by Camus et al. (20) to differentiate patients with MCI or mild AD from HC subjects, reaching a sensitivity of 0.932 and a specificity of 0.905 relative to pre-established visual assessments of PET scans. Similarly, whole-brain neocortical SUVR measurements of 18F-florbetaben were used to differentiate patients with AD from HC subjects, with a sensitivity of 0.97 and a specificity of 0.84 (24). In the present work, we demonstrated that the accuracy, sensitivity, and specificity achieved with initial global cortex SUVR measurements could be improved by iterating the discriminative process and refining the optimal target ROI. As part of our work, we have found that the global cortical SUVR can be replaced by other measures (e.g., visual assessment) for the initial classification and the method will still produce similar results.
A key step in our statistical framework was determining the cutoff value for the classification of subjects on the basis of the optimal target ROI SUVR measurements. Typically, cutoff values are selected on the basis of a comparison of the SUVR distribution of a “cognitively normal” population with that of a population having the abnormality under study (4,20,25,27,37,38). The main drawback of this approach is that there is no guarantee that cognitively normal subjects will be free of β-amyloid accumulation, which can be confirmed only through visual assessment by an experienced rater or through postmortem neuropathology. A cutoff value of 1.10 has been proposed on the basis of a 24-mo autopsy study, in which all subjects without β-amyloid plaques were confirmed (by silver stain plaque density scores) to have SUVRs of less than 1.10 (37). The same cutoff value was used to differentiate between scans obtained from a population of cognitively normal young participants and showing normal results and scans showing abnormal results as visually assessed by experienced raters (25). Similarly, a cutoff value of 1.12 was used in a routine clinical environment to differentiate patients with MCI or mild AD from HC subjects (20). A recent meta-analysis showed that for the SUVR separating “β-amyloid–positive” and “β-amyloid–negative” subjects, the cutoff values varied from 1.1 to 1.6, with a mean of approximately 1.3 (39). However, the results of the present study showed that the cutoff value for the SUVR depends not only on the distribution of the SUVR measurements across the populations, but also on the selected reference region. In most studies included in the aforementioned meta-analysis (39), the full cerebellum was used as a reference region. To the best of our knowledge, the present study is the first to determine an optimal target ROI and a corresponding cutoff value for the SUVR derived from an exploration of several reference regions. A distinctive aspect of our approach is that we used an ROC analysis for an automated, unbiased determination of the optimal cutoff value and allowed for the reclassification of subjects during the iterative process to achieve maximal group separation.
CONCLUSION
We have developed a data-driven approach to determine an optimal target ROI and an associated cutoff value for the separation of subjects into AβL and AβH groups. The accurate classification of subjects into AβL and AβH groups is vital to understanding the relationship between the β-amyloid burden and various other measures, including cognitive performance, cerebral blood flow, glucose metabolism, brain atrophy, and brain connectivity. Further, the relationship between the presence of β amyloid in “cognitively normal” subjects and the future development of cognitive impairment and dementia is actively being investigated as part of long-term, longitudinal, natural history studies. Future work should include the application of this process to other datasets to allow determination of the translatability of the optimal ROI obtained in the present study to other populations. Although a strong correlation between our classification and CSF Aβ1–42 was shown, validating the accuracy of our target ROI and cutoff value against PET-autopsy data from large-scale studies would, of course, be ideal. Ultimately, it is anticipated that this approach will be exceptionally useful for the enrichment of study populations in natural history research studies and in clinical trials involving putative disease-modifying therapeutic agents for AD.
DISCLOSURE
The costs of publication of this article were defrayed in part by the payment of page charges. Therefore, and solely to indicate this fact, this article is hereby marked “advertisement” in accordance with 18 USC section 1734. This work was supported in part by the National Research Council Canada–Industrial Research Assistance Program (NRC-IRAP). Data collection and sharing for this project were funded by the Alzheimer Disease Neuroimaging Initiative (ADNI) (National Institutes of Health grant U01 AG024904) and DOD ADNI (Department of Defense award W81XWH-12-2-0012). ADNI is funded by the National Institute on Aging, by the National Institute of Biomedical Imaging and Bioengineering, and through generous contributions from the following: Alzheimer’s Association; Alzheimer’s Drug Discovery Foundation; BioClinica, Inc.; Biogen Idec Inc.; Bristol-Myers Squibb Co.; Eisai Inc.; Elan Pharmaceuticals, Inc.; Eli Lilly and Co.; F. Hoffmann–La Roche Ltd. and its affiliated company, Genentech, Inc.; GE Healthcare; Innogenetics, N.V.; IXICO Ltd.; Janssen Alzheimer Immunotherapy Research & Development, LLC; Johnson & Johnson Pharmaceutical Research & Development LLC; Medpace, Inc.; Merck & Co., Inc.; Meso Scale Diagnostics, LLC; NeuroRx Research; Novartis Pharmaceuticals Corp.; Pfizer Inc.; Piramal Imaging; Servier; Synarc Inc.; and Takeda Pharmaceutical Co. The Canadian Institutes of Health Research provides funds to support ADNI clinical sites in Canada. Private sector contributions are facilitated by the Foundation for the National Institutes of Health (www.fnih.org). The grantee organization is the Northern California Institute for Research and Education, and the research is coordinated by the Alzheimer’s Disease Cooperative Study at the University of California, San Diego. ADNI data are disseminated by the Laboratory for Neuroimaging at the University of Southern California. Felix Carbonell, Alex P. Zijdenbos, and Arnaud Charil are employees of Biospective Inc. Alex P. Zijdenbos and Barry J. Bedell are shareholders of Biospective Inc. No other potential conflict of interest relevant to this article was reported.
Acknowledgments
Data used in the preparation of this article were obtained from the Alzheimer’s Disease Neuroimaging Initiative (ADNI) database (adni.loni.usc.edu). As such, the investigators within the ADNI contributed to the design and implementation of the ADNI or provided data but did not participate in the analysis or writing of this report. A complete listing of ADNI investigators can be found at http://adni.loni.usc.edu/wp-content/uploads/how_to_apply/ADNI_Acknowledgment_List.pdf
Footnotes
Published online Jul. 1, 2015.
- © 2015 by the Society of Nuclear Medicine and Molecular Imaging, Inc.
REFERENCES
- Received for publication April 15, 2015.
- Accepted for publication June 16, 2015.


Jump to section
Related Articles
Cited By...
- Tau-related reduction of glucose metabolism in mild cognitive impairment occurs independently of APOE {varepsilon}4 genotype and is gradually modulated by {beta}-amyloid
- Spatial association between distributed {beta}-amyloid and tau varies with cognition
- A Fully Automatic Technique for Precise Localization and Quantification of Amyloid-{beta} PET Scans
- Impact of Reference and Target Region Selection on Amyloid PET SUV Ratios in the Phase 1b PRIME Study of Aducanumab