


Abstract
SUV ratios (SUVRs) are commonly used to quantify tracer uptake in amyloid-β PET. Here, we explore the impact of target and reference region-of-interest (ROI) selection on SUVR effect sizes using interventional data from the ongoing phase 1b PRIME study (NCT01677572) of aducanumab (BIIB037) in patients with prodromal or mild Alzheimer disease. Methods: The florbetapir PET SUVR was calculated at baseline (screening) and at weeks 26 and 54 for patients randomized to receive placebo and each of 4 aducanumab doses (1, 3, 6, and 10 mg/kg) using the whole cerebellum, cerebellar gray matter, cerebellar white matter, pons, and subcortical white matter as reference regions. In addition to the prespecified composite cortex target ROI, individual cerebral cortical ROIs were assessed as targets. Results: Of the reference regions used, subcortical white matter, cerebellar white matter, and the pons, alone or in combination, generated the largest effect sizes. The use of the anterior cingulate cortex as a target ROI resulted in larger effect sizes than the use of the composite cortex. SUVR calculations were not affected by correction for brain volume changes over time. Conclusion: Dose- and time-dependent reductions in the amyloid PET SUVR were consistently observed with aducanumab only in cortical regions prone to amyloid plaque deposition, regardless of the reference region used. These data support the hypothesis that florbetapir SUVR responses associated with aducanumab treatment are a result of specific dose- and time-dependent reductions in the amyloid burden in patients with Alzheimer disease.
Radioligands, such as 18F-labeled florbetapir (Amyvid; Eli Lilly), selectively bind to amyloid-β (Aβ), allowing direct PET imaging of Aβ plaques in patients with Alzheimer disease (AD) (1). Quantification of Aβ PET radioligand retention can be used to detect changes in the brain Aβ plaque burden over time in response to anti-Aβ treatment (2–5). SUV ratios (SUVRs) are commonly used as a semiquantitative measure of Aβ burden, calculated by normalizing Aβ PET radiotracer retention values from a target brain region of interest (ROI) to a reference region that is not expected to accumulate amyloid (6,7). Several factors, including the selection of target and reference ROIs (8–10) and partial-volume effects stemming from the limited spatial resolution of PET imaging (9,11), may affect SUVR quantification. Longitudinal Aβ PET studies may be confounded by temporal variations in tracer uptake due to disease-related changes in vascular integrity or by progressive brain atrophy (9). Consequently, there is a need to understand the impact of methodologic variables and confounding factors on SUVR quantification.
The selection of target and reference regions directly affects the sensitivity of SUVR quantification. Reference region selection is particularly critical in SUVR quantification, as all target ROIs are normalized to this region; thus, modest changes in Aβ can be masked by variations in reference ROI measurements. The choice of target ROI for assessing Aβ PET tracer retention in patients with AD is typically based on the brain regions that are prone to the deposition of Aβ plaques. These regions include (but are not limited to) the frontal, temporal, parietal, and cingulate cortices. A composite cortical target ROI consisting of multiple cortical regions is often used in the analysis of cross-sectional and longitudinal amyloid PET data.
The relative sparing of the cerebellum from Aβ plaque deposition in AD and the validation of a whole cerebellum–based threshold for Aβ plaque positivity (12,13) have resulted in the whole cerebellum being widely used as a reference region for florbetapir PET SUVR calculation (1,14,15). However, natural history studies have demonstrated that, compared with cerebellar reference regions, white matter reference regions may improve the signal-to-noise ratio in longitudinal cortical Aβ measurements (16–20). Furthermore, a composite reference region consisting of the cerebellum and various white matter regions has shown better performance than either the whole cerebellum or white matter alone (17,21).
Understanding how reference and target ROI selection influences the sensitivity of SUVR quantification may aid in the interpretation of drug-dependent changes in Aβ detected using this method in interventional clinical studies. In this study, we assessed the effects of reference and target region selection on longitudinal SUVR quantification using interventional clinical trial data from PRIME (NCT01677572), an ongoing randomized, placebo-controlled, phase 1b study of the anti-Aβ antibody aducanumab (BIIB037) in patients with prodromal or mild AD. An interim analysis of data from PRIME demonstrated statistically significant, dose- and time-dependent Aβ plaque reduction at 6 mo and 1 y (4) and provided a unique opportunity to investigate the effects of reference and target region selection on treatment-dependent Aβ changes. In the interim analysis of data from PRIME, an average of 6 cortical regions (composite cortex) was used as the target ROI and the whole cerebellum was used as the prespecified reference region (4). In this post hoc analysis, we investigated the effects of various reference and target ROIs on SUVR changes observed with aducanumab.
MATERIALS AND METHODS
Study Population
PRIME (NCT01677572) is an ongoing randomized, placebo-controlled, phase 1b study of the anti-Aβ antibody aducanumab (BIIB037) in patients with prodromal or mild AD. The PRIME study was conducted in accordance with the Declaration of Helsinki, the study protocol had ethics committee approval at each participating site, and all patients provided written informed consent. The study design and interim data have been published elsewhere (4). In brief, the analysis of interim data from the placebo-controlled period included all patients randomized to a fixed-dose regimen. In a staggered, parallel-group design, patients with a clinical diagnosis of prodromal or mild AD and with visually positive amyloid PET scan results (22) were dosed every 4 wk with intravenous infusions of either placebo or aducanumab at a dose of 1, 3, 6, or 10 mg/kg during the 1-y, placebo-controlled period (4).
Amyloid PET Data Acquisition and Analysis
Aβ plaque load, as measured by florbetapir PET imaging, was assessed at screening and at weeks 26 and 54. For each scan, a dose of 370 MBq of florbetapir was injected intravenously; PET scanning was started 50 min later and continued for 20 min. Point spread function differences between scanners were harmonized by smoothing PET images to approximately 8 mm (full width at half maximum), and the same scanner, acquisition protocol, and reconstruction method were used for each set of longitudinal PET measurements. Florbetapir PET data and associated anatomic MRI scans were processed using the fully automated PIANO software package (Biospective Inc.). In brief, 3-dimensional T1-weighted MRI volumes underwent image nonuniformity correction using the N3 algorithm (23); brain masking; linear spatial normalization with a 9-parameter affine transformation; and nonlinear spatial transformation to map images from native coordinate space to Montreal Neurologic Institute reference space with a customized, anatomic MRI template derived from baseline scans from 146 study patients. The resulting image volumes were segmented into gray matter, white matter, and cerebrospinal fluid using an artificial neural network classifier (24) and partial-volume estimation (25). Whole brain volumes were derived from the segmented images.
The florbetapir PET images underwent several preprocessing steps, including interframe rigid-body (6° of freedom) motion correction, image smoothing, and averaging of dynamic frames into a static image. The resulting images were rigidly registered to the patient’s T1-weighted MRI and then normalized to reference space using the linear and nonlinear transformations derived from the anatomic MRI registration. Each patient’s baseline anatomic MRI scan was used for the registration of all subsequent florbetapir PET images during the study. To rule out the potential effects of brain atrophy associated with this strategy, we performed a second analysis to compare SUVRs derived from baseline registration to SUVRs derived from registration to temporally matched anatomic MRI scans.
Finally, atlas-based labeling of target and reference ROIs was performed in the template space, and SUVR maps were generated. The average volume of each reference region across subjects was as follows: cerebellar gray matter, 96.8 cm3; cerebellar white matter, 22.6 cm3; cerebellum, 119.4 cm3; cerebellum plus pons, 130.1 cm3; cerebellum plus subcortical white matter, 145.1 cm3; cerebellum plus pons and subcortical white matter, 155.8 cm3; cerebellar white matter plus pons, 33.2 cm3; pons, 10.6 cm3; subcortical white matter, 24.8 cm3; and pons plus subcortical white matter, 36.3 cm3.
SUVRs were calculated at baseline (screening) and at weeks 26 and 54 using the following reference regions, individually and in various combinations: whole cerebellum, cerebellar gray matter, cerebellar white matter, pons, and subcortical white matter. The subcortical white matter ROI consisted of the cortical white matter superior to the level of the top of the lateral ventricles but not extending into individual gyri. In addition to the composite cerebral cortical ROI, individual cortical areas were assessed as target ROIs. Predefined, atlas-based, statistical and default-mode ROIs were also included in the analysis. The statistical ROI maximally separated patients with low and high Aβ burdens, and the default-mode ROI encompassed lateral temporal, parietal, and posterior cingulate cortical regions (26).
Effect sizes were calculated from observed amyloid PET data using the adjusted mean change from the baseline and the SD from an analysis of covariance (ANCOVA) model for change from the baseline, with the factors treatment, laboratory apolipoprotein E (ApoE) ε4 status (carrier and noncarrier), and baseline SUVR. No imputation was performed for missing data. For each time point, adjusted means for each treatment, pairwise adjusted differences from the placebo, 95% confidence intervals for the pairwise differences, and associated nominal P values for comparisons with the placebo were calculated. No adjustments were made for multiple comparisons or multiple interim analyses.
RESULTS
Baseline Patient Characteristics
A total of 166 patients were enrolled, and 165 were treated between October 2012 and January 2014 at 33 sites in the United States. Of these, 125 patients completed treatment and 40 discontinued treatment. Patient characteristics were previously described (4). In brief, baseline patient characteristics were generally well balanced across treatment groups and included the following: age (overall mean: 72.6 y), sex (50% women), ApoE ε4 carrier status (65% carriers), clinical stage (41% prodromal; 59% mild), Mini-Mental State Examination score (mean ± SD: 24.2 ± 3.5), Clinical Dementia Rating Global score (0.5, 77%; 1, 23%), Clinical Dementia Rating Sum of Boxes score (mean ± SD: 3.2 ± 1.7), AD medication use (65% used cholinesterase inhibitors and/or memantine), and PET SUVR composite score determined with the composite cortex as the target ROI (mean: 1.44) (4).
Reference Region Selection
With the composite cortex as the target ROI, the effects of using various reference regions on the SUVR adjusted mean change from the baseline and the SE were investigated across treatment groups at weeks 26 and 54 (Fig. 1). The dose-dependent effects of aducanumab were consistent across all tested reference regions. The greatest SUVR adjusted mean change from the baseline was observed in the group that received aducanumab at 10 mg/kg when cerebellar gray matter was used as the reference region (SUVR adjusted mean change from the baseline ± SE: −0.22 ± 0.03 at week 26; −0.29 ± 0.03 at week 54). For this same group, the smallest SUVR adjusted mean change from the baseline was seen when subcortical white matter was used as the reference region (SUVR adjusted mean change from the baseline ± SE: −0.09 ± 0.01 at week 26; −0.12 ± 0.01 at week 54). The use of the whole cerebellum as the reference region resulted in the second greatest changes from the baseline in the adjusted mean SUVR ± SE (−0.21 ± 0.02 at week 26; −0.27 ± 0.03 at week 54). The time-dependent effects of aducanumab were consistent across all tested reference regions, as demonstrated by a greater adjusted mean change in the SUVR at week 54 than at week 26 (Fig. 1).

Amyloid PET SUVR adjusted mean change from baseline and SE by reference region and aducanumab dose at week 26 (A) and week 54 (B) (composite cortex target ROI). SUVR adjusted mean changes and nominal P values vs. placebo were based on an ANCOVA model fitted with change from baseline as a dependent variable and with treatment group, baseline value, and laboratory ApoE status (carrier and noncarrier) as independent variables. Data are presented in descending order of SUVR changes from baseline in the aducanumab (10 mg/kg) treatment group. C = cerebellum; CGM = cerebellar gray matter; CWM = cerebellar white matter; P = pons; SWM = subcortical white matter. P values for comparisons against placebo were <0.05 (*), <0.01 (**), and <0.001 (***).
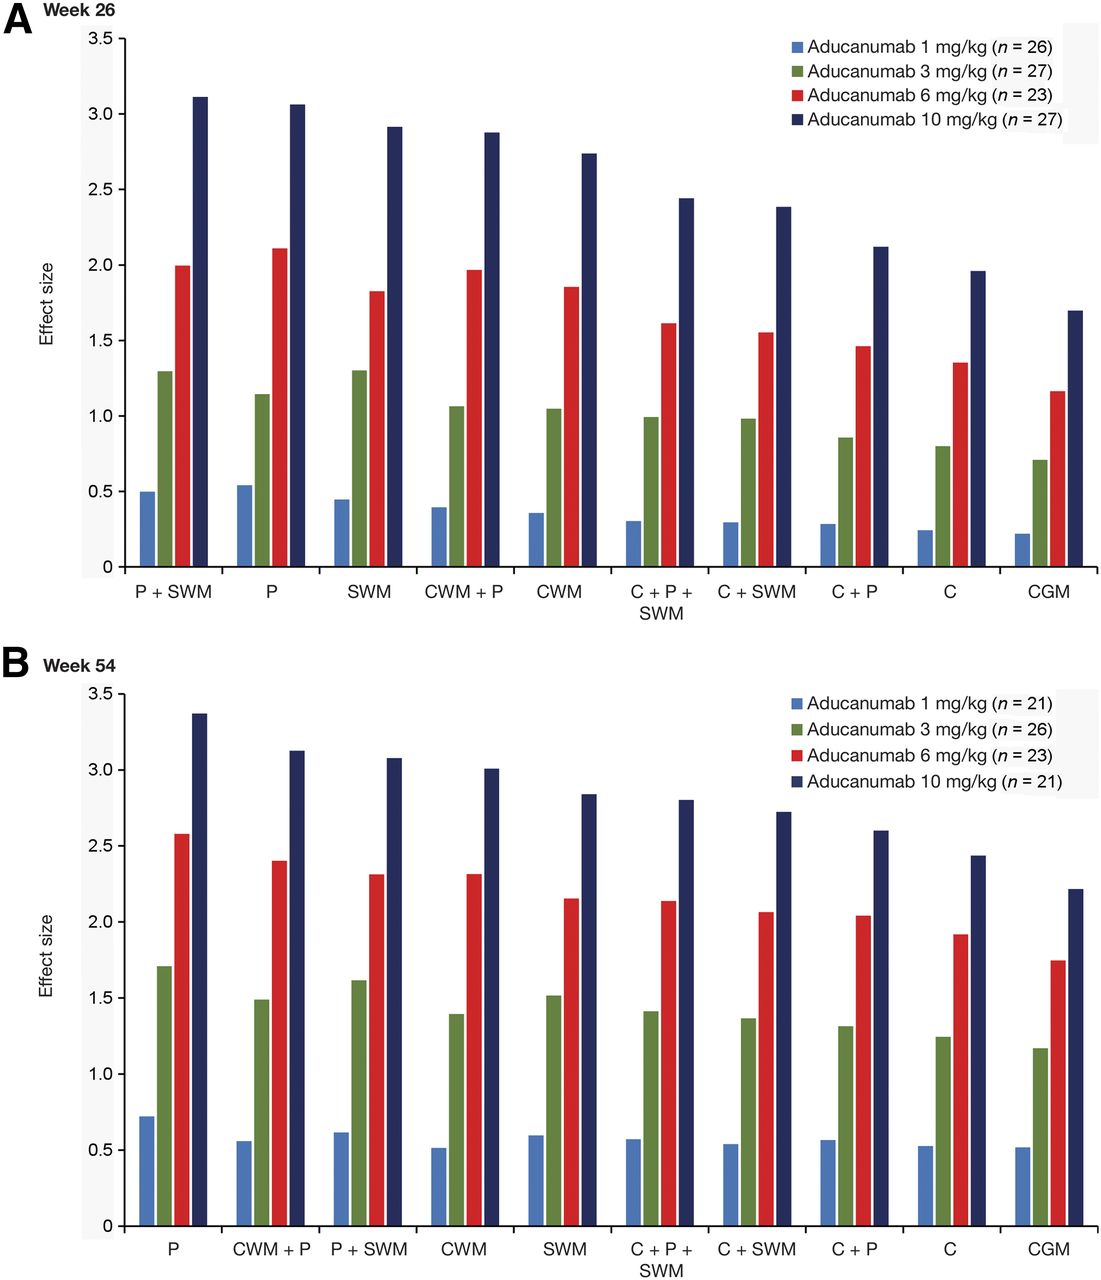
Because the magnitudes of the baseline SUVR and SUVR changes from the baseline were dependent on the reference region, the impact of reference region selection was best assessed by effect sizes (Cohen’s d (27)) (Fig. 2). Results are shown for the composite cortex target ROI. In the group that received aducanumab at 10 mg/kg at week 26, the largest effect size was seen when a combination of the pons and subcortical white matter was used as the reference region (3.11). The use of the pons (3.06), subcortical white matter (2.91), or cerebellar white matter (2.74) as the reference region resulted in larger effect sizes than the use of the whole cerebellum (1.96) or cerebellar gray matter (1.70). Similarly, in this same group at week 54, the use of the pons (3.37), cerebellar white matter (3.00), or subcortical white matter (2.84) resulted in larger effect sizes than the use of the whole cerebellum (2.43) or cerebellar gray matter (2.21). The effects of reference region selection on effect sizes were similar for all tested doses of aducanumab.

Amyloid PET SUVR effect size by reference region and aducanumab dose at week 26 (A) and week 54 (B) (composite cortex target ROI). Effect sizes were based on SUVR adjusted mean change and SD from an ANCOVA model fitted with change from baseline as a dependent variable and with treatment group, baseline value, and laboratory ApoE status (carrier and noncarrier) as independent variables. Data are presented in descending order of effect size in the aducanumab (10 mg/kg) treatment group. C = cerebellum; CGM = cerebellar gray matter; CWM = cerebellar white matter; P = pons; SWM = subcortical white matter.
Target Region Selection
Because effect sizes were consistently high when the pons and subcortical white matter were used as reference regions, these regions were used to evaluate the magnitude of SUVR change as a function of the target region (Fig. 3). The dose-dependent effects of aducanumab were consistent across all tested target regions. The greatest SUVR adjusted mean change from the baseline was observed in the group that received aducanumab at 10 mg/kg when the anterior cingulate cortex was used as the target region (SUVR adjusted mean change from the baseline ± SE: −0.154 ± 0.009 at week 26; −0.207 ± 0.013 at week 54). In this same group, the smallest SUVR adjusted mean change from the baseline was seen when the medial temporal cortex was used as the target region (SUVR adjusted mean change from the baseline ± SE: −0.062 ± 0.006 at week 26; −0.078 ± 0.007 at week 54). The time-dependent effects of aducanumab were consistent across all target regions, as demonstrated by greater adjusted mean SUVR changes at week 54 than at week 26. The effects of target region selection on the SUVR adjusted mean change from the baseline were similar for all tested doses of aducanumab.
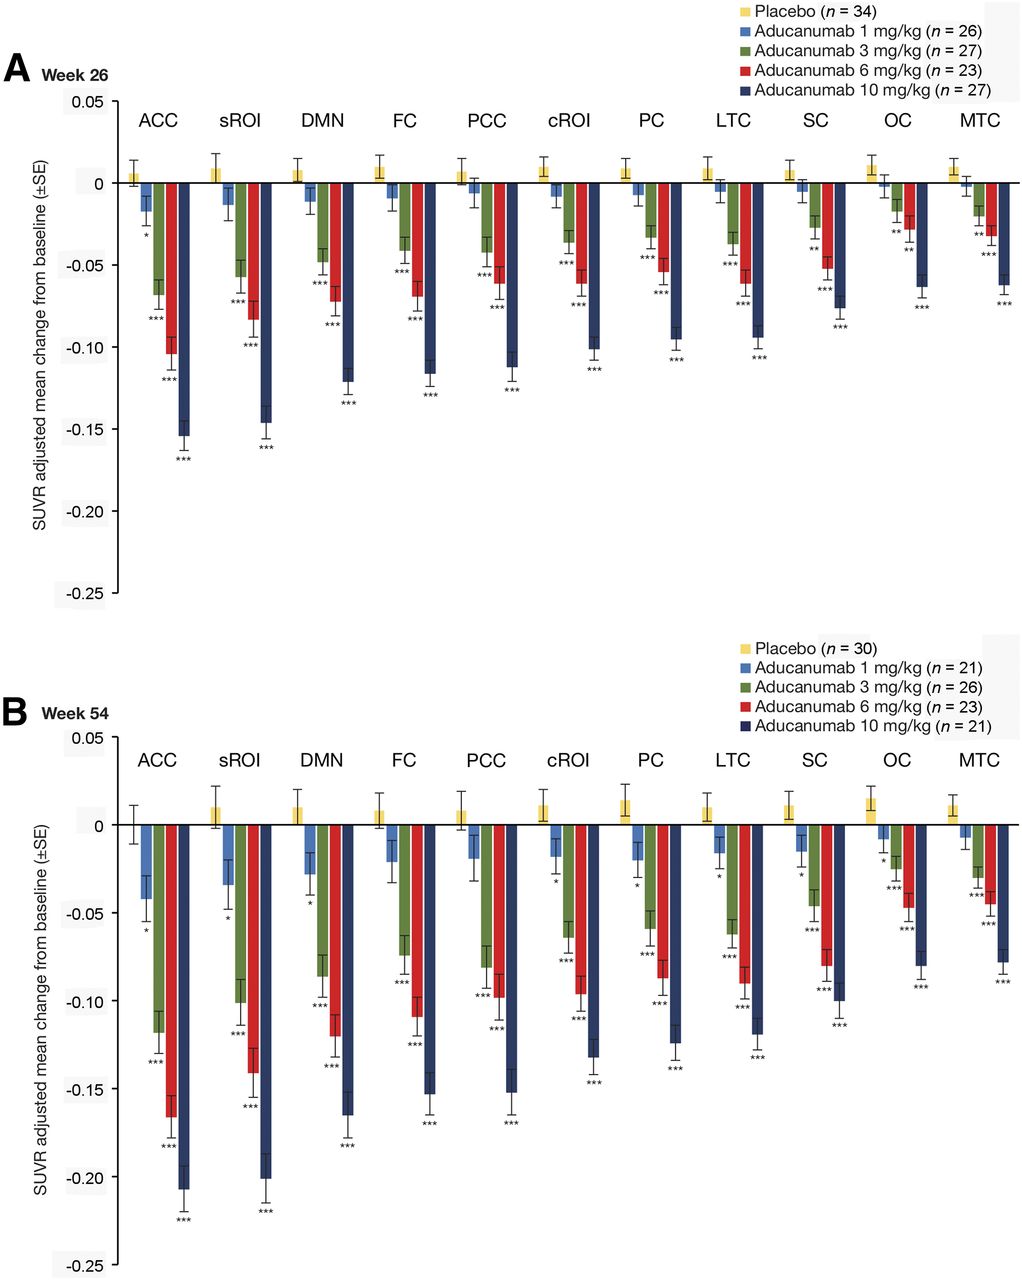
Amyloid PET SUVR adjusted mean change from baseline and SE by target region and aducanumab dose using pons plus subcortical white matter as reference region at week 26 (A) and week 54 (B). SUVR adjusted means and nominal P values were based on an ANCOVA model fitted with change from baseline as a dependent variable and with treatment group, baseline value, and laboratory ApoE status (carrier and noncarrier) as independent variables. Data are presented in descending order of SUVR change from baseline in the aducanumab (10 mg/kg) treatment group. ACC = anterior cingulate cortex; cROI = composite region of interest; DMN = default-mode network; FC = frontal cortex; LTC = lateral temporal cortex; MTC = medial temporal cortex; OC = occipital cortex; PC = parietal cortex; PCC = posterior cingulate cortex; SC = sensorimotor cortex; sROI = statistical region of interest. P values for comparisons against placebo were <0.05 (*), <0.01 (**), and <0.001 (***).
Figure 4 shows the SUVR adjusted mean change compared with the baseline mean for aducanumab at 10 mg/kg at week 54 by target region when either the pons plus subcortical white matter or the whole cerebellum was used as the reference region. Strong Pearson correlations were observed in both scenarios (r = −0.86 [95% CI = −0.96 to −0.54] when the pons plus subcortical white matter was used as the reference region; r = −0.87 [95% CI = −0.97 to −0.57] when the whole cerebellum was used as the reference region), suggesting that the higher the baseline mean Aβ burden, the greater the mean Aβ removal in response to aducanumab treatment.

SUVR adjusted mean change vs. baseline mean for aducanumab (10 mg/kg) at week 54 by target region using pons plus subcortical white matter and whole cerebellum as reference regions (RR) (n = 21). For pons plus subcortical white matter, r (Pearson) value was −0.86, with 95% CI of −0.96 to −0.54. For whole cerebellum, r (Pearson) value was −0.87, with 95% CI of −0.97 to −0.57.
Influence of Target Region and Reference Region on Effect Size
Because effect sizes were consistently largest in the group that received aducanumab at 10 mg/kg, this group was selected for assessment of the influence of target and reference ROI selection on the effect size and the interaction between the target ROI and reference ROIs (Fig. 5). At week 26, the effect sizes were largest when subcortical white matter plus the pons were used as the reference region for SUVR calculation; at week 54, the use of the pons alone as the reference region resulted in the largest effect sizes. The use of the anterior cingulate cortex as the target ROI resulted in larger effect sizes than all other tested target ROIs at weeks 26 and 54, irrespective of the reference region.
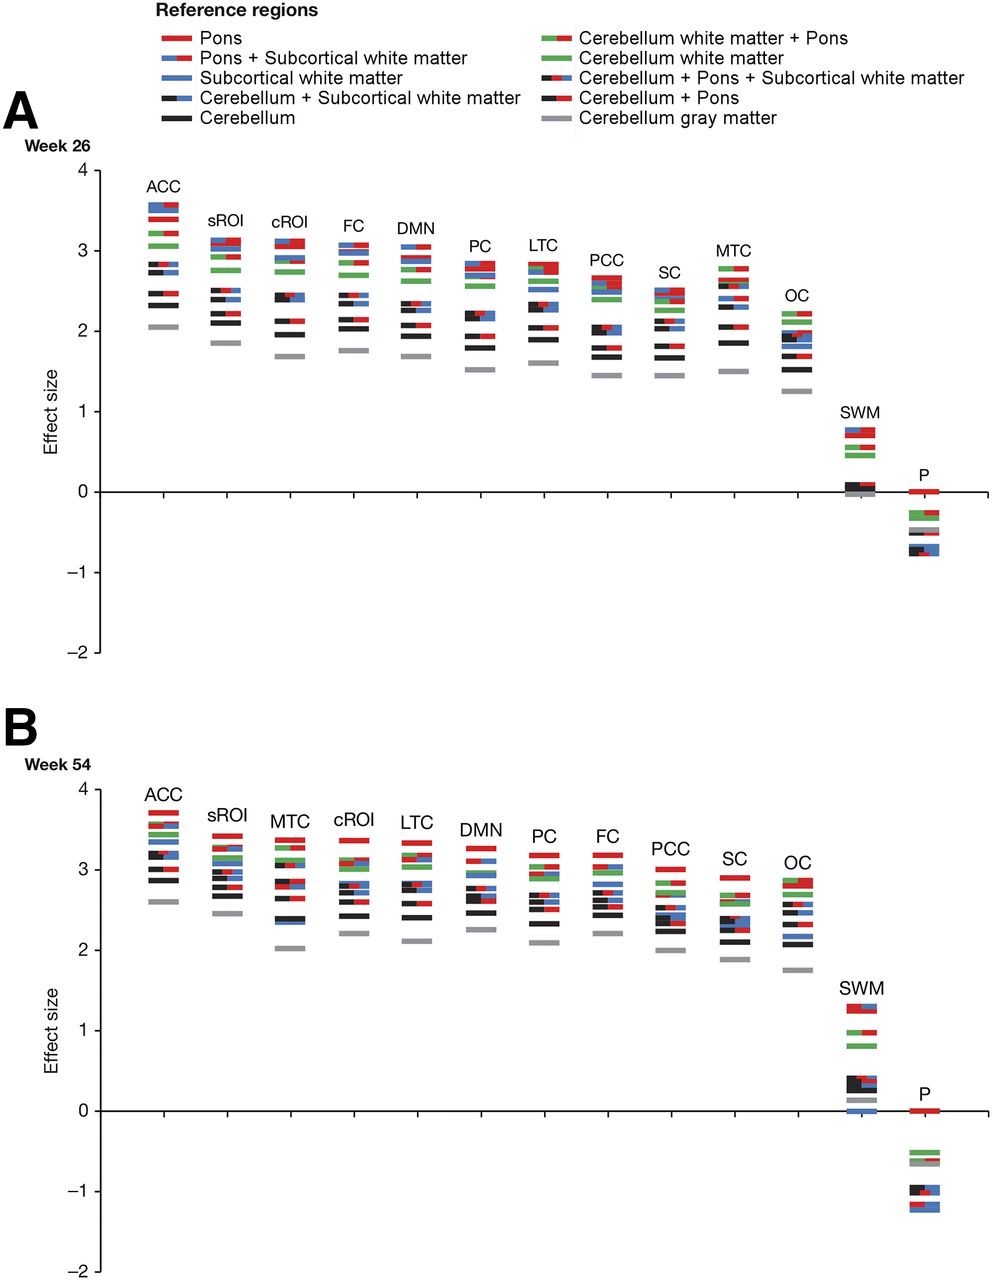
Effect size for each brain target region in the aducanumab (10 mg/kg) group by reference region at week 26 (A) and week 54 (B). Data for target regions are presented in descending order of effect size in pons plus subcortical white matter reference region for week 26 and pons for week 54. ACC = anterior cingulate cortex; cROI = composite region of interest; DMN = default-mode network; FC = frontal cortex; LTC = lateral temporal cortex; MTC = medial temporal cortex; OC = occipital cortex; P = pons; PC = parietal cortex; PCC = posterior cingulate cortex; SC = sensorimotor cortex; sROI = statistical region of interest; SWM = subcortical white matter.
Little interaction was found between selected target regions and reference regions, as the rank orders of effect sizes for the different target regions were broadly comparable for all reference regions and the rank orders of effect sizes for the different reference regions were comparable across all target regions (Fig. 5).
Effect of Brain Atrophy
To rule out the potential effects of brain atrophy associated with the use of baseline anatomic MRI registration, we performed a correlation analysis of SUVR data using baseline and temporally matched anatomic MRI scans and found them to be strongly correlated (r = 0.998). To establish whether brain atrophy during AD progression affected SUVR calculations, we repeated our ANCOVA but added cortical structural change as a covariate and found no reduction in effect sizes (Ping Chiao and John O’Gorman, unpublished data, 2016).
DISCUSSION
In this study, we evaluated the impact of reference and target ROI selection on the longitudinal sensitivity of florbetapir SUVR quantification in patients with prodromal or mild AD in the PRIME study (4). Because recent evidence has suggested that the use of white matter reference regions may be preferable for longitudinal Aβ PET measurements (16–20), we systematically investigated multiple reference and target ROIs for SUVR calculation using a unique dataset from patients with treatment-associated, dose- and time-dependent reductions in Aβ.
Using data from PRIME, we observed that the use of subcortical white matter, cerebellar white matter, and the pons as reference regions, alone or in combination, generated the largest effect sizes when used for SUVR calculation. This finding is consistent with the observations of Landau et al., who reported that the use of the subcortical white matter as a reference region was more precise in detecting Aβ changes than the use of the cerebellum or pons (17). Similarly, Fleisher et al. used a subject-specific white matter reference region to adjust for longitudinal changes in amyloid burden in patients with AD, and this approach resulted in decreased variance in amyloid measurements and increased statistical power for detecting treatment-dependent changes in amyloid burden (20). Other studies have also reported improvements in PET sensitivity when white matter reference regions are used instead of cerebellar reference regions (16,18,19).
Although cerebellar reference regions resulted in the second greatest changes from the baseline in the adjusted mean SUVR, because of their inherently lower uptake of the tracer, they were also associated with the greatest variability and, hence, the smallest effect sizes. Cerebellar gray matter is known to be vulnerable to noise during Aβ PET measurements, potentially because of factors such as its low signal level and sensitivity to truncation/edge effects as a consequence of its proximity to the edge of the scanner field of view (9). In addition, the cerebellum has greater heterogeneity in attenuation and scatter because of the presence of bone and sinuses in lower brain slices; these features increase variability, particularly in regions with low counts, such as cerebellar gray matter. Furthermore, amyloid plaque accumulation may occur in the cerebellum in some patients with AD (28).
The use of the anterior cingulate cortex as a target ROI resulted in the greatest SUVR adjusted mean change from the baseline regardless of reference region selection. Similar results were described when the whole cerebellum was used as a reference region for the same dataset (4). This result may be partly explained by the high baseline Aβ burden of the anterior cingulate cortex, which may lead to proportionally more Aβ plaque removal. It is not known whether the anterior cingulate cortex and other regions with the greatest SUVR adjusted mean change are more responsive to aducanumab treatment. More work is needed to better characterize the in vivo dynamics of putative Aβ plaque removal associated with monoclonal antibody treatments targeting the brain. Alternatively, a comparison of these findings with those of natural history studies of florbetapir in patients experiencing rapid amyloid accumulation would be valuable. However, to our knowledge, such data are not yet available.
Whether these findings are generalizable to other Aβ ligands remains to be tested—although, given the similarity of florbetapir and florbetaben, the latter may be expected to yield equivalent results. More stable results were reported for Pittsburgh compound B when white matter, the pons, or the cerebellum was used as a reference region instead of cerebellar gray matter (21). Similarly, with flutemetamol, the pons may be a more stable reference tissue than cerebellar gray matter. We are not aware of any large study using flutemetamol and white matter as a reference region.
The partial-volume effect is a known confounder of PET imaging quality and SUVR quantification (9,11). In the present study, dose- and time-dependent reductions in SUVR were consistently observed in cortical regions with aducanumab treatment, regardless of the reference and target regions selected. Consistent with this observation, we previously found that when subcortical white matter and the pons were used as target regions (areas not expected to accumulate amyloid), the magnitude of the SUVR changes was smaller than that obtained with cortical regions, the dose-dependent relationship seen in cortical regions was not clearly seen in subcortical white matter and the pons, and SUVR changes did not differ significantly between the placebo and active-treatment groups (4). These data suggested that partial-volume effects related to the differential contrast of white matter and gray matter did not confound SUVR reductions in response to aducanumab. Furthermore, our study protocol stipulated that the same scanner, acquisition protocol, and reconstruction method be used for each set of longitudinal PET measurements; in addition, point spread function differences between scanners were harmonized by smoothing PET images to approximately 8 mm (full width at half maximum).
On average, the thickness of the cortex is about 2–3 mm, and it has been shown that the annual change in cortical thickness in patients with AD is approximately 2.8% (∼0.07 mm/y) (29). In the present study, changes in cortical structure at 1 y had no effect on SUVR responses. In addition, SUVR responses were similar in ApoE ε4 carriers and noncarriers, suggesting that altered florbetapir perfusion rates in response to amyloid-related imaging abnormalities (strongly associated with ApoE ε4 status) did not affect SUVRs (4). Overall, these data supported the hypothesis that SUVR reductions associated with aducanumab treatment are a result of a direct effect on amyloid plaque burden.
The limitations of the present study should be considered in the interpretation of the results. PRIME was a small phase 1b study with a primary objective of assessing safety and tolerability and a secondary objective of assessing the effects of Aβ burden at week 26. The effects on Aβ burden at week 54 were exploratory, and larger-scale datasets should be examined to further explore the impact of reference and target ROIs on the sensitivity of SUVRs for quantifying treatment-dependent Aβ changes.
CONCLUSION
Dose- and time-dependent reductions in amyloid PET SUVRs were consistently observed with aducanumab only in cortical regions prone to amyloid plaque deposition, regardless of the non–amyloid plaque–containing reference region used; these findings substantiate the putative amyloid removal mechanism of aducanumab. Of the reference regions assessed, subcortical white matter, cerebellar white matter, and the pons, alone or in combination, resulted in the highest sensitivity of SUVRs for quantifying longitudinal changes in Aβ in response to treatment. The use of the anterior cingulate cortex as a target ROI resulted in larger effect sizes than the use of the composite cortex.
DISCLOSURE
This study was funded by Biogen. Ping Chiao, Brian Avants, John O’Gorman, and Tianle Chen are employees and shareholders of Biogen. Barry J. Bedell, Alex P. Zijdenbos, and Marilyn Grand’Maison are employees, shareholders, or both of Biospective Inc. Medical writing support by Paul O’Neill was funded by Biogen. No other potential conflict of interest relevant to this article was reported.
Footnotes
Published online May 18, 2018.
- © 2019 by the Society of Nuclear Medicine and Molecular Imaging.
REFERENCES
- Received for publication February 6, 2018.
- Accepted for publication May 7, 2018.


Jump to section
Related Articles
Cited By...
- Clinically Important Benefits and Harms of Monoclonal Antibodies Targeting Amyloid for the Treatment of Alzheimer Disease: A Systematic Review and Meta-Analysis
- The RSNA QIBA Profile for Amyloid PET as an Imaging Biomarker for Cerebral Amyloid Quantification
- Aducanumab Use in Symptomatic Alzheimer Disease Evidence in Focus: A Report of the AAN Guidelines Subcommittee