


Abstract
Myocardial perfusion imaging has limited sensitivity for the detection of high-risk coronary artery disease (CAD). We tested the hypothesis that a normal coronary flow reserve (CFR) would be helpful for excluding the presence of high-risk CAD on angiography. Methods: We studied 290 consecutive patients undergoing 82Rb PET within 180 d of invasive coronary angiography. High-risk CAD on angiography was defined as 2-vessel disease (≥70% stenosis), including the proximal left anterior descending artery; 3-vessel disease; or left main CAD (≥50% stenosis). Patients with prior Q wave myocardial infarction, elevated troponin levels between studies, prior coronary artery bypass grafting, a left ventricular ejection fraction of less than 40%, or severe valvular heart disease were excluded. Results: Fifty-five patients (19%) had high-risk CAD on angiography. As expected, the trade-off between the sensitivity and the specificity of the CFR for identifying high-risk CAD varied substantially depending on the cutoff selected. In multivariable analysis, a binary CFR of less than or equal to 1.93 provided incremental diagnostic information for the identification of high-risk CAD beyond the model with the Duke clinical risk score (>25%), percentage of left ventricular ischemia (>10%), transient ischemic dilation index (>1.07), and change in the left ventricular ejection fraction during stress (<2) (P = 0.0009). In patients with normal or slightly to moderately abnormal results on perfusion scans (<10% of left ventricular mass) during stress (n = 136), a preserved CFR (>1.93) excluded high-risk CAD with a high sensitivity (86%) and a high negative predictive value (97%). Conclusion: A normal CFR has a high negative predictive value for excluding high-risk CAD on angiography. Although an abnormal CFR increases the probability of significant obstructive CAD, it cannot reliably distinguish significant epicardial stenosis from nonobstructive, diffuse atherosclerosis or microvascular dysfunction.
Radionuclide myocardial perfusion imaging is one of the most widely used tests for the evaluation of known or suspected coronary artery disease (CAD). Extensive literature documents its high sensitivity for diagnosing or ruling out the presence of obstructive CAD (1), risk stratification (2), and selection of candidates for revascularization (3). However, in patients with a high likelihood of CAD, Bayesian principles dictate that many normal or slightly abnormal results on myocardial perfusion scans will be false-negative and will underestimate the extent of CAD on angiography. In those patients, a normal coronary flow reserve (CFR) could help exclude high-risk disease on angiography.
Previous studies focused on the role of an abnormal CFR in identifying multivessel CAD on angiography and resulted in conflicting information (4,5), likely because measures of the CFR are confounded not only by the degree of epicardial coronary stenosis (6,7) but also by the presence of diffuse atherosclerosis (8) and the degree of microvascular dysfunction (9). Accordingly, we reasoned that although the relatively low specificity of an abnormal CFR would have modest incremental value for identifying patients with high-risk CAD on angiography, a normal CFR would be helpful for excluding the presence of such high-risk disease.
MATERIALS AND METHODS
Study Population
The study cohort was selected from a pool of 3,629 patients undergoing stress myocardial perfusion PET imaging during the study period. Of these, 802 patients had both stress PET imaging and coronary angiography performed within a 180-d interval. Patients with known CAD (prior history of myocardial infarction or revascularization; n = 379) were excluded, as were those with a left ventricular ejection fraction (LVEF) of less than 40% (n = 86) and those for whom technical issues with the dynamic PET imaging data precluded the quantification of the CFR (n = 47). The remaining 290 patients were included in the study. Some of the patients in the present study were included in our prior prognostic analysis of the CFR (10). For each patient, information about past medical history, coronary disease risk factors, and medication use was collected at the time of the PET study. The Partners Healthcare Institutional Review Board approved the study, and all study procedures were in accordance with institutional guidelines. Because the present study was retrospective, patient informed consent was not required.
82Rb PET/CT Scan
Patients were studied with a whole-body PET/CT scanner (Discovery RX or STE LightSpeed 64; GE Healthcare) after an overnight fast. Patients were instructed to avoid caffeine and methylxanthine-containing substances for 24 h before the scan. Myocardial blood flow (MBF) was measured at rest and at peak hyperemia with 82Rb as a perfusion tracer as described previously (11). In brief, after transmission imaging and beginning with the intravenous bolus administration of 82Rb (1,480–2,220 MBq), list-mode images were acquired for 7 min. Then, intravenous dipyridamole (0.142 mg/kg/min for 4 min; n = 108), adenosine (0.142 mg/kg/min for 4 min; n = 24), dobutamine (10–50 μg/kg/min; n = 17), or regadenoson (0.4-mg bolus over 10 s; n = 141) was administered in accordance with standard protocols. At peak hyperemia, a second dose of 82Rb was injected, and images were recorded in the same manner. Heart rate and blood pressure were monitored throughout the infusion of the stress agent and recovery. The average radiation exposure per study was 4.6 mSv (12,13).
Coronary Angiography
All patients underwent coronary angiography with standard techniques. Cineangiograms of the coronary arteries were obtained in multiple projections. Stenoses on angiography were determined by semiquantitative visual analysis like that used in clinical settings. The percentage of luminal narrowing of the stenosed arterial segment along with the adjacent reference segments was evaluated at the end of diastole. Coronary vessels were grouped according to their most severe stenosis into the following categories: angiographically normal vessels, nonobstructive disease (stenosis of <70%), and obstructive CAD (≥70% stenosis in the native proximal to middle left anterior descending artery, proximal to middle left circumflex artery, or proximal to distal right coronary artery and ≥50% stenosis in the left main coronary artery).
Data Analysis
Definition of High-Risk CAD on Angiography
For the purpose of this analysis, high-risk CAD on angiography was defined as the presence of left main CAD, 3-vessel disease, or 2-vessel disease with proximal left anterior descending artery stenosis. This definition was based on the fact that such patterns of disease on angiography have been associated with an increased risk of adverse cardiac events (14).
Semiquantitative Myocardial Perfusion Analysis
Myocardial perfusion PET studies were interpreted without knowledge of the results of coronary angiography or MBF. A 17-segment, 5-point (0, normal radiotracer uptake; 1, definite but slight reduction; 2, moderate reduction; 3, severe reduction; and 4, absent radiotracer uptake) scoring system was used to compute a summed stress score, a summed rest score, and a summed difference score. These global scores were converted into percentages of abnormal myocardium by dividing each global score by 68 and multiplying the result by 100 to account for defect size and defect severity. This combined score provided better risk stratification than the use of defect size or defect severity alone (2,15). A summed stress score of zero was considered normal. A defect extent of 1%–20% was considered to represent a small to medium perfusion defect. Similarly, scans were categorized as showing no (0%), slight (1%–5%), moderate (6%–10%), or severe (>10%) ischemia or scar. Rest and stress left ventricular volumes, the LVEF, and the transient ischemic dilation (TID) index were calculated with commercially available software. The change in the LVEF (ΔLVEF) was computed as the stress LVEF minus the rest LVEF as described previously
Quantification of MBF and CFR
Commercially available software was used to calculate rest and stress MBF and flow reserve (Corridor4DM; Invia) as described previously (10,11). In brief, list-mode images were unlisted and then reconstructed into 27 frames. Right and left ventricular blood-pool time–activity curves were obtained with factor analysis. Regional and global rest and peak MBF values (in mL/min/g) were calculated by fitting the 82Rb arterial blood and tissue time–activity curves with a 2-compartment tracer kinetic model and a modeled extraction fraction as described previously (10,11). The regional CFR and the global CFR were computed as the ratio of peak MBF to rest MBF.
Statistical Analysis
Continuous variables are presented as mean ± SD or median and interquartile range, as appropriate, and categoric variables are presented as simple proportions. Differences in rest and stress MBF and CFR across groups of disease severity on angiography were assessed with a 1-way ANOVA. The Tukey–Kramer method was used for post hoc tests of the 1-way ANOVA. Univariate receiver operating characteristic (ROC) curves were constructed for the identification of high-risk CAD on angiography for the Duke clinical risk score (16), percentage SSS (%SSS), TID index, ΔLVEF during stress, global CFR, and the number of segments with a CFR of less than 1.5. This value was selected because it is a clinically meaningful cutoff point for identifying patients at the highest risk of cardiac death (10). The best cutoff value for each variable and the sensitivity and specificity for %SSS and CFR were selected from these curves. The incremental diagnostic value of clinical and PET variables was determined with the likelihood ratio test to assess the improved fit of a series of nested multivariable logistic models in which binary categories below and above the cutoff values of various imaging markers and CFR are added to a model with the binary of the Duke clinical risk score. The concordance index (c-index) was calculated for each model. A 2-tailed P value of less than 0.05 was considered statistically significant. Data analysis was performed with JMP 10.0 (SAS Institute Inc.).
RESULTS
Patient Characteristics
The baseline characteristics of the study cohort are summarized in Table 1. The population consisted of patients referred for the evaluation of chest pain, dyspnea, or both and was balanced for sex. Dyslipidemia and hypertension were highly prevalent, and diabetes was present in 41% of patients. The use of medications to control blood pressure and cholesterol was widespread. PET was performed before coronary angiography in 206 (71%) of the 290 patients in the study; the scan results were abnormal for 176 patients.
Patient Characteristics
Twenty-four patients (8%) had angiographically normal coronary arteries, 87 patients (30%) had nonobstructive disease, and 179 patients (62%) had obstructive CAD. Of the patients with obstructive CAD, 124 had 1- or 2-vessel disease and 55 had high-risk CAD on angiography, including 23 patients with left main CAD. As expected, there was a stepwise increase in the Duke clinical risk score with an increasing extent of CAD on angiography.
Relationship Between Extent of CAD on Angiography and PET
Table 2 summarizes the PET findings as a function of the extent of CAD on angiography. With an increasing extent of CAD on angiography, there were stepwise increases in the extent of stress-induced perfusion abnormality and ischemia, the TID index, and the number of segments with a severely reduced CFR (<1.5). Likewise, an increasing extent of CAD was associated with a stepwise reduction in the global peak MBF and CFR as well as the ΔLVEF.
PET Findings by Extent of CAD on Angiography
Incremental Value of CFR for Identification of High-Risk CAD
Multivariable analysis including a Duke clinical risk score of greater than 25% (preimaging model) and binary categories of an %SSS of greater than 10%, a TID index of greater than 1.07, a ΔLVEF of less than 2, and a CFR of less than or equal to 1.93 demonstrated that the extent and severity of inducible ischemia, the TID index, and the global CFR significantly improved the detection of high-risk CAD on angiography beyond the preimaging model (Fig. 1). Using a stepwise ROC curve analysis, we next examined the contribution of each component of the multiparametric PET approach to the identification of high-risk CAD on angiography. Figure 1 demonstrates a modest increase in the area under the ROC curve for the identification of high-risk CAD on angiography with the addition of each component of the multiparametric PET scan, with only the CFR adding statistically significant information beyond the %SSS. Figure 2 demonstrates the trade-off between sensitivity and specificity for different cutoff points of the %SSS and the CFR. Individual cutoff points for each of these parameters are summarized in Table 3. The case examples in Figures 3 and 4 illustrate the strengths and limitations of quantitative CFR for predicting high-risk CAD on angiography.

Multivariate ROC curves demonstrating ability of PET variables to detect high-risk CAD. Model starts with binary category of Duke clinical risk score (CRS) of greater than 25% (red line) and then adds %SSS (SSS) of greater than 10.2% (green line), binary of TID of greater than 1.07 (blue line), ΔLVEF (ΔEF) of less than 2 (orange line), and CFR of less than or equal to 1.93 (blue-green line). Table shows χ2 and area under curve (AUC) for each model as well as P values for comparisons of models.

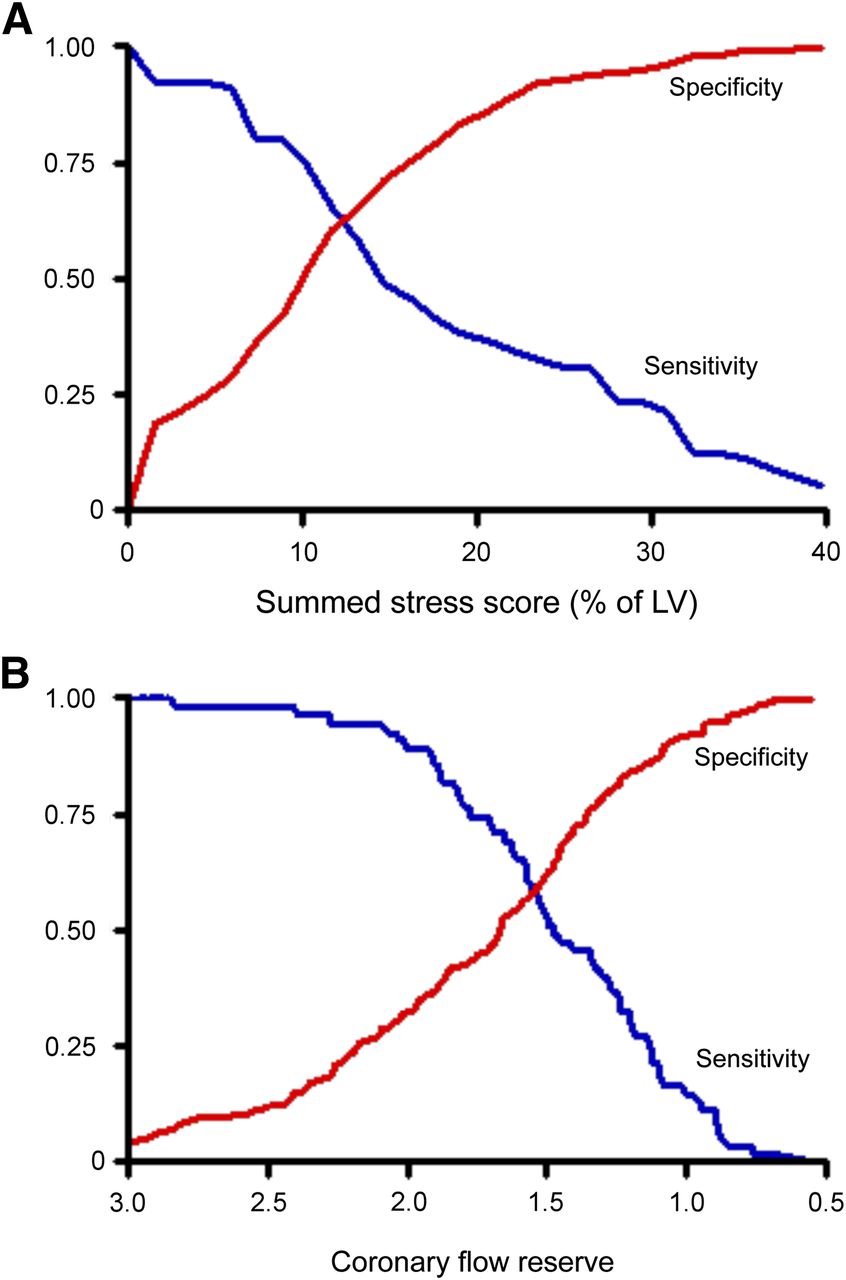
Univariate ROC curves showing sensitivity (blue curve) and specificity (red curve) pairs for identification of patients with high-risk CAD (2-vessel disease, including proximal left anterior descending artery; 3-vessel disease; and left main CAD) by use of %SSS (A) and global CFR (B). This analysis demonstrated that %SSS of 10.2% and global CFR of 1.93 had best trade-off, with sensitivities of 0.75 and 0.89 and specificities of 0.51 and 0.36, respectively, for identification of high-risk CAD. Number of patients with high-risk CAD on angiography (truth reference) was denominator of sensitivity–specificity pair calculations illustrated by ROC curves. Results in A are consistent with notion that, like SPECT, semiquantitative myocardial perfusion imaging with PET often underestimates extent of CAD on angiography; this effect is likely related to the issue of balance flow reduction. In fact, finding that perfusion defect involving at least 10% of left ventricular (LV) mass was associated with sensitivity of approximately 60% for correctly identifying high-risk disease on angiography was nearly identical to that reported by Berman et al. using SPECT (56% sensitivity with same threshold) (20). ROC curves also showed trade-offs in sensitivity–specificity with changing semiquantitative thresholds of ischemia. For example, perfusion defect involving 40% of left ventricle would be expected to be associated with multivessel CAD (specificity and positive predictive value near 100%). However, such a threshold would miss large numbers of patients with smaller defects but high-risk CAD on angiography (low sensitivity). Conversely, the opposite would be true if smaller semiquantitative threshold for ischemia were used. Similar pattern can be observed with CFR in B.
Univariate ROC Curve Analysis for Identification of High-Risk CAD on Angiography

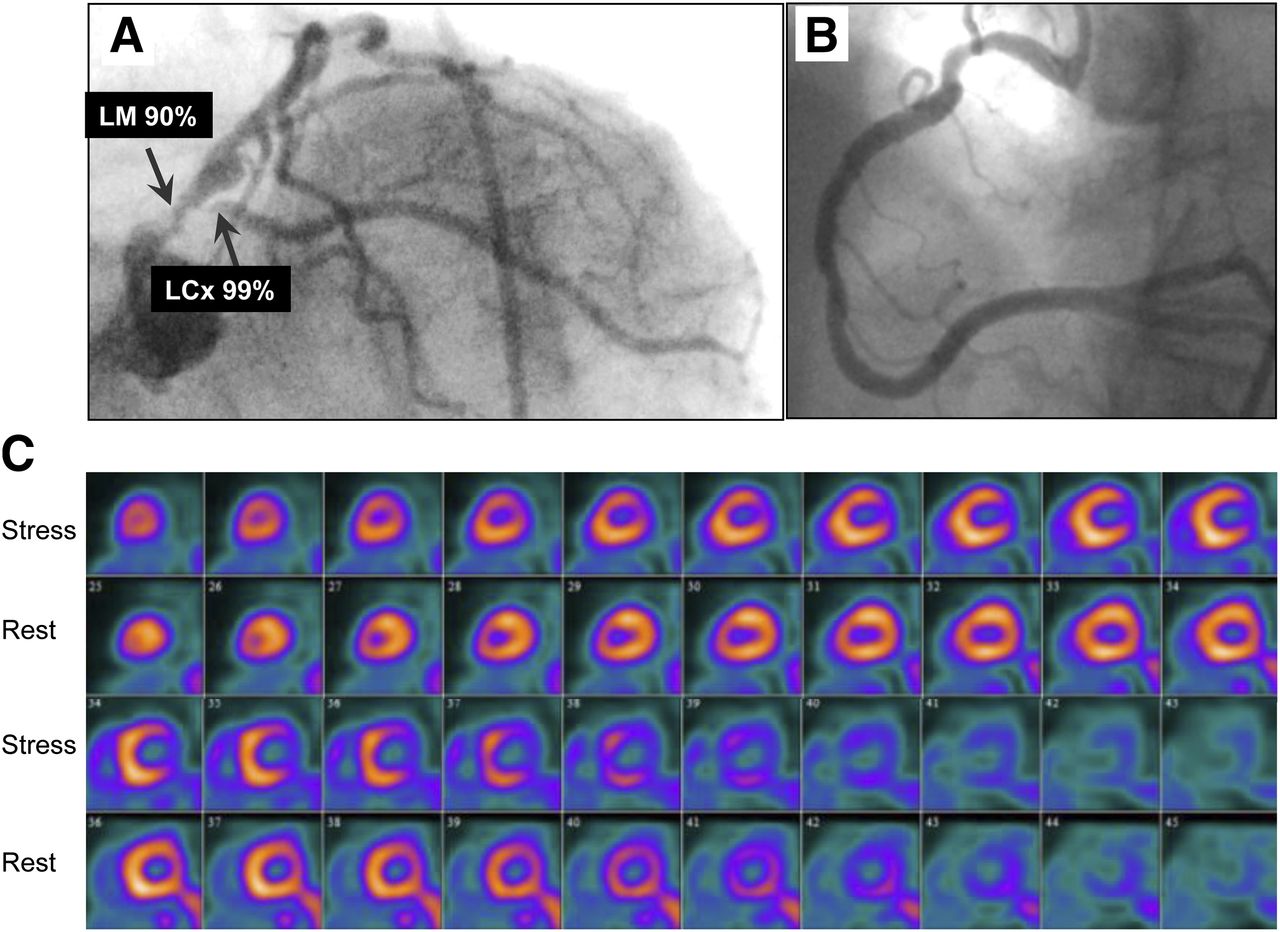
Imaging results for 85-y-old woman who had history of hypertension and obesity and was referred for evaluation of atypical chest pain. (A and B) Selected coronary angiographic views of left (A) and right (B) coronary arteries. Images show extensive and severe CAD involving left main (LM), proximal left anterior descending, and left circumflex coronary (LCx) arteries. (C) Short-axis stress–rest myocardial perfusion images showing TID and medium but severe perfusion defect that involved lateral left ventricular wall but was completely reversible. Patient’s quantitative global CFR was 1.0.

Imaging results for 46-y-old woman who had history of diabetes mellitus, hypertension, high cholesterol, and smoking and was referred for evaluation of atypical chest pain and dyspnea. (A and B) Selected coronary angiographic views of left (A) and right (B) coronary arteries, without significant obstructive CAD. (C) Short-axis stress–rest myocardial perfusion images showing TID without significant regional perfusion abnormalities. Patient’s quantitative global CFR was 1.3.
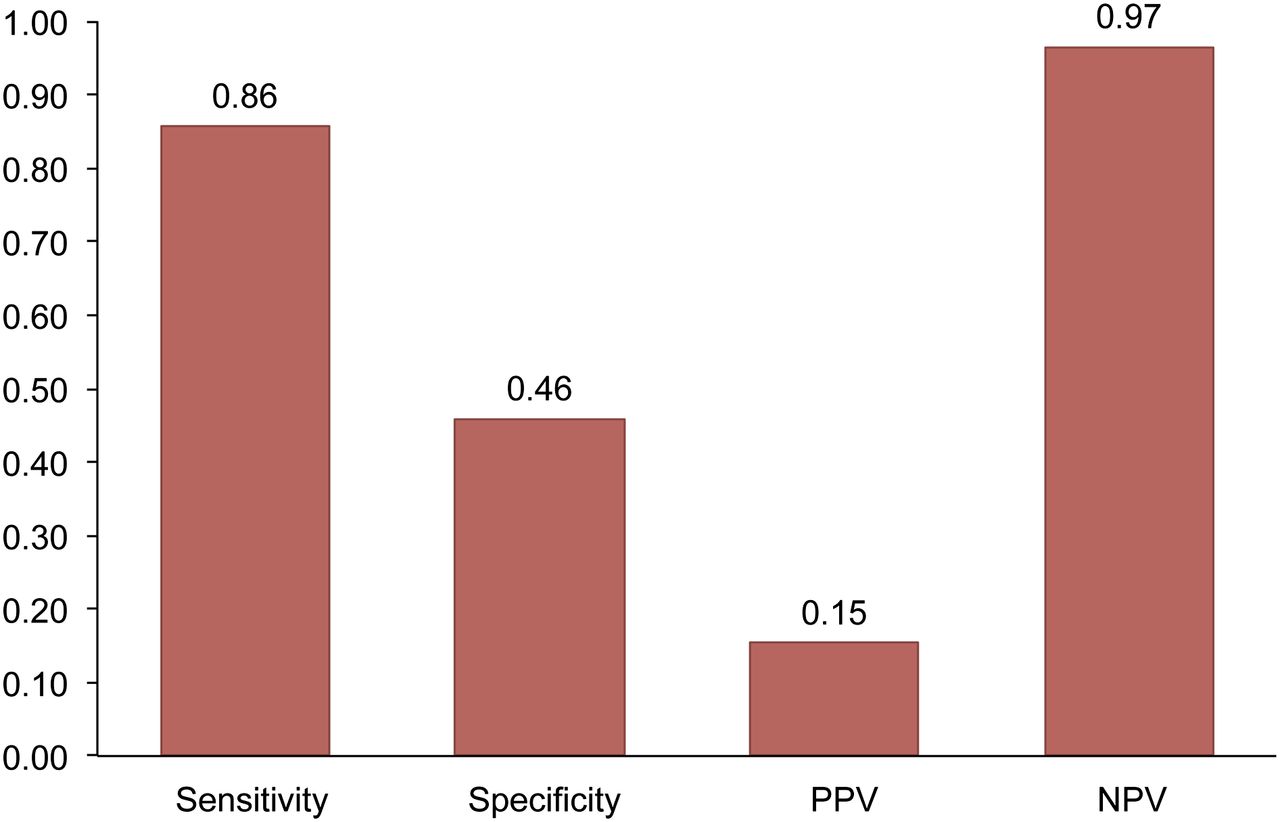
Because patients with severely abnormal results on scans (%SSS of >10%) are likely to be referred for coronary angiography regardless of the CFR, we turned our attention to patients with slightly to moderately abnormal results on scans (%SSS of <10%; n = 136) and assessed whether the addition of the global CFR information could help increase the sensitivity of the myocardial perfusion study for excluding high-risk CAD on angiography. Fourteen of the 55 patients (25%) with high-risk CAD on angiography had either normal results on scans (n = 4) or slightly to moderately abnormal results on scans (n = 10). The presence of a preserved CFR (>1.93) in this patient subgroup was associated with a high sensitivity (86%) and a high negative predictive value (97%) for excluding high-risk CAD on angiography (Figs. 5 and 6).

Sensitivity, specificity, positive predictive value (PPV), and negative predictive value (NPV) of abnormal CFR (≤1.93) for detecting high-risk CAD in patients with normal or small to medium stress myocardial perfusion defects (%SSS of <10.2%) (n = 136).
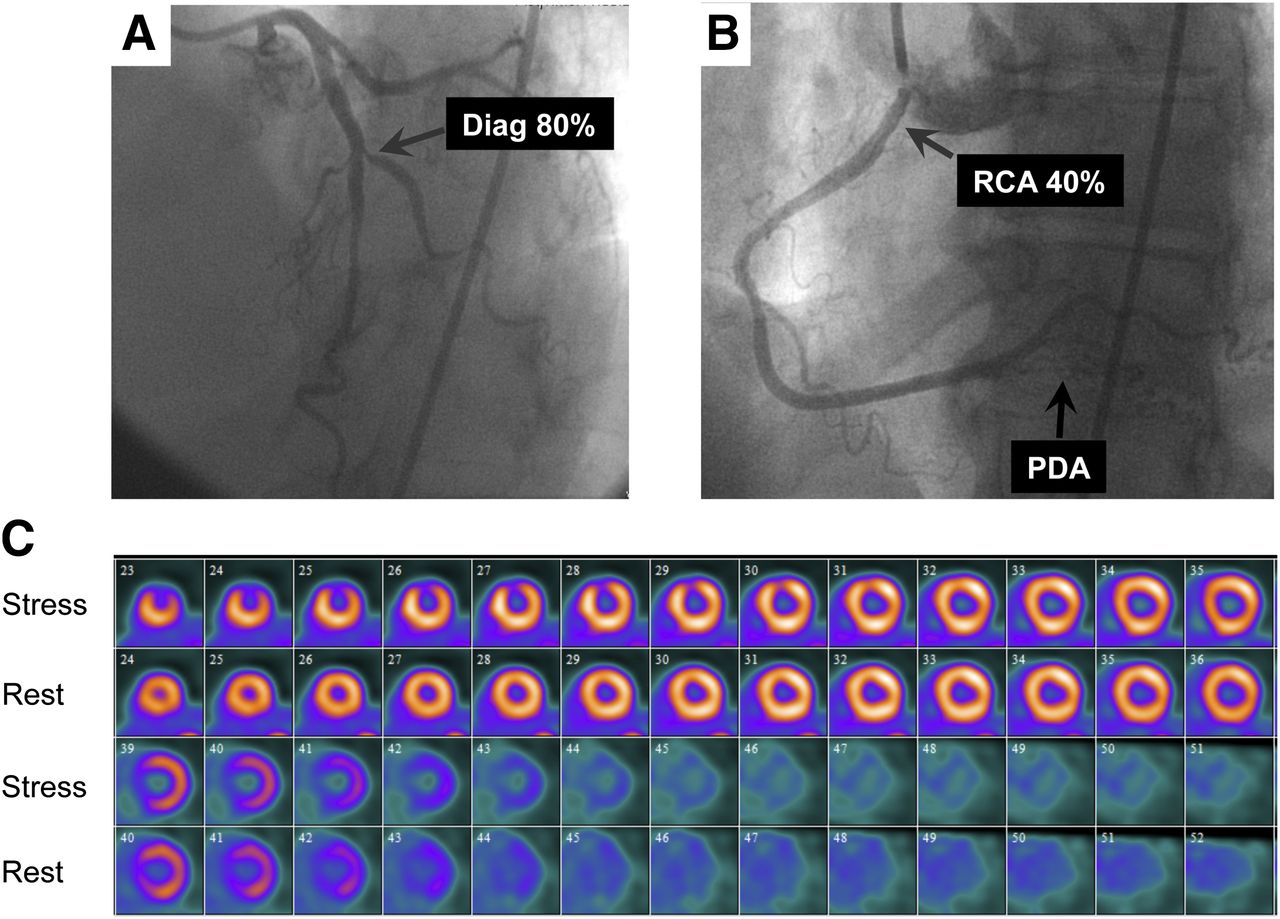
Imaging results for 66-y-old woman who had history of high cholesterol and family history of CAD and was referred for evaluation of atypical chest pain. (A and B) Selected coronary angiographic views of left (A) and right (B) coronary arteries. Images show severe disease in first diagonal (Diag) branch, moderate stenosis in proximal right coronary artery (RCA), and diffuse disease in posterior descending coronary artery (PDA). (C) Short-axis stress–rest myocardial perfusion images showing small but severe perfusion defect that involved middle and apical anterior wall but was completely reversible. Patient’s quantitative global CFR was 2.03.
DISCUSSION
To our knowledge, this is the largest study examining the interaction of the presence of inducible myocardial ischemia, quantitative CFR, and the extent and severity of CAD on angiography, and it yielded several important findings. First, the presence of a normal global CFR in patients with normal or slightly to moderately abnormal results on myocardial perfusion scans was associated with a low likelihood of high-risk CAD on angiography (negative predictive value, 97%). Second, although an increasing extent of CAD on angiography was associated with a larger magnitude of inducible myocardial ischemia and a reduced CFR, a significant proportion of patients with nonobstructive or even angiographically normal coronary arteries also showed a reduced CFR. This finding explains why individual cutoff values for CFR are associated with significant trade-offs between sensitivity and specificity for predicting high-risk CAD on angiography. Third, the addition of the CFR to a model including a clinical risk score and the magnitude of inducible myocardial ischemia contributed modestly to the identification of high-risk CAD on angiography.
Earlier studies in patients with predominantly single-vessel CAD demonstrated a statistically significant but clinically modest inverse relationship between MBF or CFR and the degree of coronary stenosis on angiography (6,7,17–19). These observations served as the basis for the proposed use of noninvasive measures of CFR to overcome the limitations of semiquantitative myocardial perfusion imaging for identifying patients with severe CAD on angiography (20,21). However, the results for relatively small numbers of patients in the emerging literature have been mixed. Ziadi et al. studied 120 patients, including 25 with angiographic evidence of severe CAD involving the left main or all 3 major epicardial coronary arteries (5). They demonstrated that although a reduction in the CFR increased the likelihood of extensive CAD on angiography, the positive predictive value of the CFR was modest—approximately 50% for a CFR of approximately 1.0. In contrast, in a study of 73 patients, including 19 patients with 3-vessel CAD, Fiechter et al. demonstrated that a decreased CFR (<2.0) was associated with a much higher positive predictive value for identifying extensive CAD on angiography (89%) (4).
The present study comprised a significantly larger patient cohort than those 2 earlier reports (4,5), including 55 patients with high-risk CAD on angiography. In line with the results of Ziadi et al. (5), we found that although a stepwise reduction in the CFR was clearly associated with an increased sensitivity for identifying high-risk CAD, this finding was not specific and was associated with a relatively low positive predictive value. The reasons for this apparent discrepancy are not clear but are probably related to significantly different risk factor burdens and underlying clinical risk in these cohorts, leading to different frequencies and degrees of abnormalities in coronary blood flow even in the absence of epicardial coronary artery stenosis. The modest improvement in specificity and positive predictive value for the typical referral population in the present study likely was multifactorial. In addition to fixed epicardial obstructive lesions, abnormalities in CFR may be due to underlying endothelial or smooth muscle cell dysfunction in large epicardial or downstream resistance vessels. Indeed, coronary vascular dysfunction frequently occurs in the absence of any angiographically significant CAD. In fact, 59% of patients with nonobstructive CAD on angiography in the present study had a reduced CFR (≤1.93), and the average CFR for the group was moderately abnormal. These observations suggest that factors other than the degree of luminal narrowing in human atherosclerosis—including diffuse disease (8) and vasodilator dysfunction of resistance vessels (22–30)—confound the tight relationship between dimensions of stenosis and coronary flow in experimental models of coronary artery obstruction (31). Our data suggest that the differentiation of multivessel epicardial coronary stenosis from diffuse, nonobstructive atherosclerosis or microvascular dysfunction causing a global reduction in MBF and CFR in a patient with apparently normal myocardial perfusion or small to moderate regional perfusion defects can be quite challenging, especially because these conditions coexist in many patients. Our findings also cast some doubt on the notion that this distinction can be made reliably with a single severity threshold of CFR. In the presence of a reduced CFR, the addition of coronary CT angiography can be helpful for confirming or excluding the presence of obstructive stenosis as the likely reason for the reduced CFR (32).
Our findings have important implications for decisions regarding referral for cardiac catheterization. The presence of a normal global CFR is associated with a high negative predictive value for excluding high-risk CAD on angiography and, thus, can be helpful, especially in patients with normal or slightly or moderately abnormal results on myocardial perfusion scans. Conversely, our data suggest that the addition of an abnormal CFR to other high-risk findings on stress testing may improve the identification of patients with high-risk CAD on angiography. However, such an improvement in sensitivity is likely to be associated with a loss of specificity, which may lead to an increased rate of unnecessary catheterization. Therefore, the incorporation of CFR data into clinical decision making for catheterization referral must be carefully considered in the context of clinical risk and imaging findings. As discussed earlier, the addition of coronary CT angiography in selected cases may be useful as a screen for identifying patients in whom the cause of a low CFR is obstructive epicardial stenosis as opposed to diffuse atherosclerosis or microvascular dysfunction (32). Nonetheless, there is growing, consistent evidence that abnormalities in CFR—probably a more accurate quantitative measure of ischemia—from obstructive CAD, diffuse atherosclerosis, or microvascular dysfunction are associated with an increased risk of adverse cardiac events (10,33–36).
The present study was a single-center, observational study and had all of the inherent limitations of that study design. First, all of the PET scans in the present study were performed on clinical grounds, and reports of the semiquantitative myocardial perfusion results were available to the referring clinicians. Therefore, it is likely that the PET scan results affected the decisions about referral for coronary angiography, at least in some of the patients. Of note, quantitative CFR was not part of the clinical PET reports and, thus, was not available for decision making. Consequently, the relatively high sensitivity of semiquantitative measures of inducible ischemia for identifying high-risk CAD likely is overestimated and a reflection of referral bias (i.e., patients with larger defects are more likely to be referred for cardiac catheterization). This scenario suggests that the incremental value of CFR over other high-risk imaging findings may be underestimated. Although the present study is the largest to date, our modest sample size precluded precise estimates of the clinical impact of quantitative CFR on decisions about coronary angiography. In addition, patients with normal results on PET scans, as determined by semiquantitative myocardial perfusion analysis, were underrepresented in the present study. Given the high sensitivity of semiquantitative PET for identifying patients with obstructive CAD (37), it is unlikely that many such patients will have occult high-risk CAD on angiography (i.e., left main CAD or 3-vessel disease). However, many of them will have a reduced CFR because of a high burden of atherosclerotic risk factors. This scenario, in turn, could affect (i.e., lower) the specificity and positive predictive value of the quantitative CFR measure for identifying high-risk CAD on angiography, as shown in the present study and in the study of Ziadi et al. (5).
Second, the present study included multiple stress agents, including vasodilators and dobutamine. However, it is well established that dipyridamole, regadenoson, and adenosine all induce maximal hyperemia primarily through endothelium-independent vascular smooth muscle relaxation (38,39). Although dobutamine stress has a different mechanism of action, the resulting hyperemic response is similar in magnitude to that obtained with adenosine (40). More importantly, in the larger prognostic cohorts from which the patients in the present study were derived (10) and in other large cohorts (41), the stressor used was not informative to the multivariable model for predicting cardiac events.
CONCLUSION
Our data suggest that a normal global CFR, even in the presence of slightly or moderately abnormal results on myocardial perfusion scans, has a high negative predictive value for excluding the possibility of high-risk CAD on angiography. Conversely, although an abnormal CFR increases the probability of significant obstructive CAD, this finding is not specific because it cannot reliably distinguish significant epicardial stenosis from nonobstructive, diffuse atherosclerosis or microvascular dysfunction. These findings should be carefully considered in clinical decision making regarding referral for cardiac catheterization.
DISCLOSURE
The costs of publication of this article were defrayed in part by the payment of page charges. Therefore, and solely to indicate this fact, this article is hereby marked “advertisement” in accordance with 18 USC section 1734. This study was funded in part by a Society of Nuclear Medicine Wagner–Torizuka Fellowship Award to Masanao Naya and a training grant from the National Institutes of Health (T32 HL094301-01A1). Sharmila Dorbala received research grant support from Astellas Global Pharma Development and Bracco Diagnostics. Ron Blankstein received research grant support from Astellas Global Pharma Development. Marcelo F. Di Carli received research grant support from Toshiba. Venkatesh L. Murthy owns equity in General Electric. No other potential conflict of interest relevant to this article was reported.
Footnotes
Published online Jan. 9, 2014.
- © 2014 by the Society of Nuclear Medicine and Molecular Imaging, Inc.
REFERENCES
- Received for publication February 8, 2013.
- Accepted for publication August 20, 2013.


Jump to section
Related Articles
Cited By...
- Future of Radionuclide Myocardial Perfusion Imaging: Transitioning from SPECT to PET
- Danish study of Non-Invasive Testing in Coronary Artery Disease 3 (Dan-NICAD 3): study design of a controlled study on optimal diagnostic strategy
- Practical Guide for Interpreting and Reporting Cardiac PET Measurements of Myocardial Blood Flow: An Information Statement from the American Society of Nuclear Cardiology, and the Society of Nuclear Medicine and Molecular Imaging
- What is multimodality cardiovascular imaging and how can it be delivered?
- Cardiac Imaging in the Post-ISCHEMIA Trial Era: A Multisociety Viewpoint
- Appropriate Use Criteria for PET Myocardial Perfusion Imaging
- Impact of the ISCHEMIA Trial on Stress Nuclear Myocardial Perfusion Imaging
- Coronary Microvascular Dysfunction: Clinical Considerations and Noninvasive Diagnosis
- Inline Quantitative Myocardial Perfusion by CMR: Coming Online Soon?
- Demonstrating the Superiority of a Superior Test...Not Always Easy!
- Quantitative Coronary Flow Capacity for Risk Stratification and Clinical Decision Making: Is It Ready for Prime Time?
- Prognostic Implication of Thermodilution Coronary Flow Reserve in Patients Undergoing Fractional Flow Reserve Measurement
- Clinical Quantification of Myocardial Blood Flow Using PET: Joint Position Paper of the SNMMI Cardiovascular Council and the ASNC
- Integrated Noninvasive Physiological Assessment of Coronary Circulatory Function and Impact on Cardiovascular Mortality in Patients With Stable Coronary Artery Disease
- Cardiovascular Magnetic Resonance in Diabetic Patients: The Method of Choice?
- Quantifying Plaque Burden and Morphology Using Coronary Computed Tomography Angiography to Predict Coronary Physiology: Helpful...But Is It Sufficient?
- Combined Quantitative Assessment of Myocardial Perfusion and Coronary Artery Calcium Score by Hybrid 82Rb PET/CT Improves Detection of Coronary Artery Disease
- Approaches to Reducing Radiation Dose from Radionuclide Myocardial Perfusion Imaging
- Relative Flow Reserve Derived From Quantitative Perfusion Imaging May Not Outperform Stress Myocardial Blood Flow for Identification of Hemodynamically Significant Coronary Artery Disease
- Comparison and Prognostic Validation of Multiple Methods of Quantification of Myocardial Blood Flow with 82Rb PET