


Abstract
Caffeine is the neuroactive agent in coffee and tea and is a broadly consumed stimulant. It is a nonselective antagonist of the neuromodulator adenosine and, if applied in commonly consumed doses, evokes its stimulating effects through the blockade of adenosine receptors. 18F-8-cyclopentyl-3-(3-fluoropropyl)-1-propylxanthine (18F-CPFPX) has been established as a highly selective and affine PET ligand for the A1 adenosine receptor (A1AR). The objective of the present study was to visualize and quantify the in vivo occupancy of the human cerebral A1AR by caffeine using 18F-CPFPX and PET. Methods: Fifteen subjects (age range, 24–68 y) underwent a 140-min bolus–plus–constant-infusion PET experiment after at least 36 h of caffeine abstinence. Metabolite-corrected blood data were used to calculate steady-state distribution volumes (VT) during the baseline condition of the scan between 70 and 90 min. Subsequently, subjects received a 10-min infusion of varying concentrations (0.5–4.3 mg/kg of body weight) of caffeine at 90 min. Occupancy VT of the A1AR was thereafter estimated using data acquired between 120 and 140 min. Occupancy levels were calculated using the Lassen plot, from which the inhibitory concentrations of 50% were derived. Plasma levels of caffeine were determined at regular intervals. One subject received an intravenous vehicle as a placebo. Results: Caffeine displaced 5%–44% of 18F-CPFPX binding in a concentration-dependent manner. There was no change of radioligand binding after the administration of placebo. Half-maximal displacement was achieved at a plasma caffeine concentration of 67 μM, which corresponds to 450 mg in a 70-kg subject or approximately 4.5 cups of coffee. Conclusion: Given a biologic half-life of about 5 h, caffeine might therefore occupy up to 50% of the cerebral A1AR when caffeinated beverages are repeatedly consumed during a day. Furthermore, the present study provides evidence that 18F-CPFPX PET is suitable for studying the cerebral actions of caffeine, the most popular neurostimulant worldwide.
Caffeine is the most commonly consumed psychoactive substance worldwide and an active ingredient in innumerable beverages and foods. Its neurobiologic effects comprise mainly stimulatory actions on alertness, attention (1), cognitive performance (2,3), and cerebral perfusion (4). It is known to reduce sleepiness, to prolong sleep latency, and to enhance wake periods after sleep onset (5,6).
The consumption of approximately 3 cups of coffee corresponds to an oral uptake of 5–8 mg of caffeine per kilogram of bodyweight (7), leading to plasma peak levels of 8–10 mg/L (8,9). The plasma–to–cerebrospinal fluid (CSF) ratio was reported to be 1 for caffeine (10) at equilibrium conditions. CSF concentrations of caffeine will therefore amount to approximately 50 μM (molar weight of caffeine, 194.19 g/mol) after intake of the aforementioned dose of caffeine, which is frequently consumed on a daily basis.
The biologic actions of caffeine are generally assigned to its antagonizing effects at cerebral adenosine receptors. There are 4 different subtypes of adenosine receptors, of which the A1 adenosine receptor (A1AR) has the most abundant distribution and highest concentration in the human brain.
Genetic constitutional knockout animals for the different adenosine receptors suggest that the psychostimulant and arousal effects are mainly mediated by the A2A adenosine receptor (11–13). However, these data cannot readily be extrapolated to the human condition because there are substantial interspecies differences with regard to the cerebral distribution and concentration of adenosine receptor subtypes. In the human brain, the A1AR is the most abundant adenosine receptor. It is highly concentrated in human neocortical areas and shows an area- and layer-specific distribution pattern (14) that is strikingly different from its distribution in rodents (15).
The compound 8-cyclopentyl-3-(3-fluoropropyl)-1-propylxanthine (CPFPX) (14,16) shows a high affinity for the A1AR (dissociation constant, 1.26 nM in cloned human receptors) and a high selectivity (A2A adenosine receptor affinity, 940 nM). It has been applied in autoradiographic in vitro binding experiments in its tritiated form (3H-CPFPX) and in PET experiments as a radiofluorinated compound (18F-CPFPX) to determine A1AR densities in human, nonhuman primate, and rodent brain tissue. Another PET ligand that has been successfully implemented and has been extensively characterized in humans is the xanthine derivate 11C-MPDX (17). Because 18F has a longer half-life than 11C, 18F-CPFPX is especially suited for bolus–plus–constant-infusion studies with long scan durations.
Various pharmacokinetic modeling approaches have been validated (14,18), and the feasibility of in vivo displacement of 18F-CPFPX has been shown by an occupancy study with unlabeled CPFPX (19). The proposed models for quantification have a high test–retest reliability and stability (20).
In a recent in vitro study, we measured the concentration of caffeine that displaces 50% of the binding (inhibitory concentration of 50%, or IC50) of 3H-CPFPX to A1ARs in human postmortem brain tissue (21). The respective IC50 values were in the range of 113–170 μM, implying that the aforementioned commonly consumed doses of caffeine led to an A1AR occupancy that was accessible in vivo using 18F-CPFPX and PET. A preliminary PET study with rats served as a proof of principle (22).
The objective of the present study was, therefore, to quantify the in vivo occupancy of A1AR by caffeine in the human brain with a bolus–plus–constant-infusion paradigm using 18F-CPFPX and PET.
MATERIALS AND METHODS
Subjects
All procedures were approved by the Ethics Committee of the Medical Faculty of the University of Duesseldorf, Germany, and the German Federal Office for Radiation Protection. Male volunteers (n = 15; mean age, 27.4 ± 3.5 y; age range, 20–34 y) participated in this study after having given written informed consent. One subject was scanned twice; thus, a total of 16 displacement studies were analyzed. Volunteers were screened for a history of neurologic and psychiatric diseases, head injury, and alcohol or substance abuse. With the exception of one subject on thyroxin and a second one on antihistaminic medication (fexofenadine), all subjects were without any acute or chronic medication. Caffeine intake was not allowed for at least 36 h before the subjects underwent PET. The chronic daily caffeine consumption was assessed as a multiple of cups (0.15 L) of coffee per day (1 L of caffeine-containing soft drinks was estimated to be equal to ∼1.5 cups of coffee (23)).
MRI Acquisition
To exclude structural brain abnormalities and to define regions of interest, individual high-resolution MRI datasets were acquired (Magnetom Vision, 1.5 T; Siemens) using a 3-dimensional T1-weighted magnetization-prepared rapid-acquisition gradient-echo sequence (voxel size, 1 × 1 × 1 mm).
PET Acquisition
PET measurements were performed in 3-dimensional mode on an ECAT EXACT HR+ scanner (Siemens-CTI) equipped with a circular lead shield to reduce scatter radiation from outside the field of view (NeuroInsert; Siemens-CTI). Scanning took place with the subjects supine in quiet ambience. The volunteers’ heads were immobilized in the canthomeatal orientation by a vacuum cushion or by customized head shells of polyurethane foam. A 10-min 68Ge/68Ga transmission scan was acquired to correct for attenuation. Head positions were permanently monitored and, if necessary, manually corrected under guidance of a video system and reference skin marks.
A venous catheter in a forearm vein served for tracer application. Arterialized venous blood samples were drawn from a forearm vein contralateral to the injection side. The arm was warmed by heating pads to achieve sufficient arterialization (oxygen saturation > 80%).
Radiosynthesis and formulation of 18F-CPFPX were performed as previously described (16). The mean specific radioactivity was 75.6 ± 70 GBq/μmol at the start times of the scans.
18F-CPFPX PET was performed according to a bolus infusion schedule as previously described (18). Three slightly different ratios of bolus versus infusion (Kbol [time required for injecting the dose of the bolus at a selected infusion rate]) were used: 45 min (n = 6), 48 min (n = 7), and 61 min (n = 3). The radioligand was diluted with sterile saline solution (0.9%) and filled into a 50-mL syringe. A standard syringe pump was used for tracer application. Dynamic PET acquisition (140 min) in list mode began with the application of the 18F-CPFPX bolus.
Blood samples were collected at 15-s intervals for the first 2 min; then at 3, 4, 5, 6, 8, and 10 min; and finally at 10-min intervals until 60 min and at 15-min intervals until 140 min. An additional blood sample was taken before 18F-CPFPX administration, serving for the assessment of the caffeine plasma level.
List-mode data were framed into a dynamic sequence of 9 × 30, 3 × 60, 3 × 150, and 25 × 300 s. Slices (n = 63; thickness, 2.425 mm; pixel size, 2 × 2 mm) were reconstructed per time frame by filtered backprojection (Shepp filter, cutoff, 2.5 mm) after Fourier rebinning into 2-dimensional sinograms. Datasets were fully corrected for random coincidences, scatter radiation, and attenuation. The resolution of the reconstructed images varied between 4.1 mm (in full width at half maximum) in the center and 7.8 mm at 20 cm from the center. The sensitivity of the scanner for true events was 5.7 cps/Bq/mL (24).
Metabolite Analysis
The activity concentration of the whole blood and plasma (after centrifugation of whole blood for 3 min at 1,000g) was quantified. The fraction of intact radioligand of total plasma activity was determined as previously described (25).
Caffeine Administration
Caffeine (Bedford Laboratories) was dissolved in 50 mL of saline (vehicle) and applied with a standard syringe pump as short intravenous infusions between 90 and 100 min. Caffeine concentrations were determined before the start of scanning and additionally in all blood samples from the time of caffeine administration onward. Plasma levels were assessed by high-performance liquid chromatography (in triplicate). Caffeine doses were initially increased in 1 mg/kg steps from 1 mg/kg to approximately 4 mg/kg. However, because the subjects in the upper dose range complained about mild to moderate dizziness and nausea, we did not pursue a further dose escalation. Instead, we attempted to cover the aforementioned dose range in approximately equally spaced dose steps (minor deviations from perfectly equal spacing are caused by the use of a caffeine ampulla of a predefined dosage).
Image Processing and Quantitative Analyses
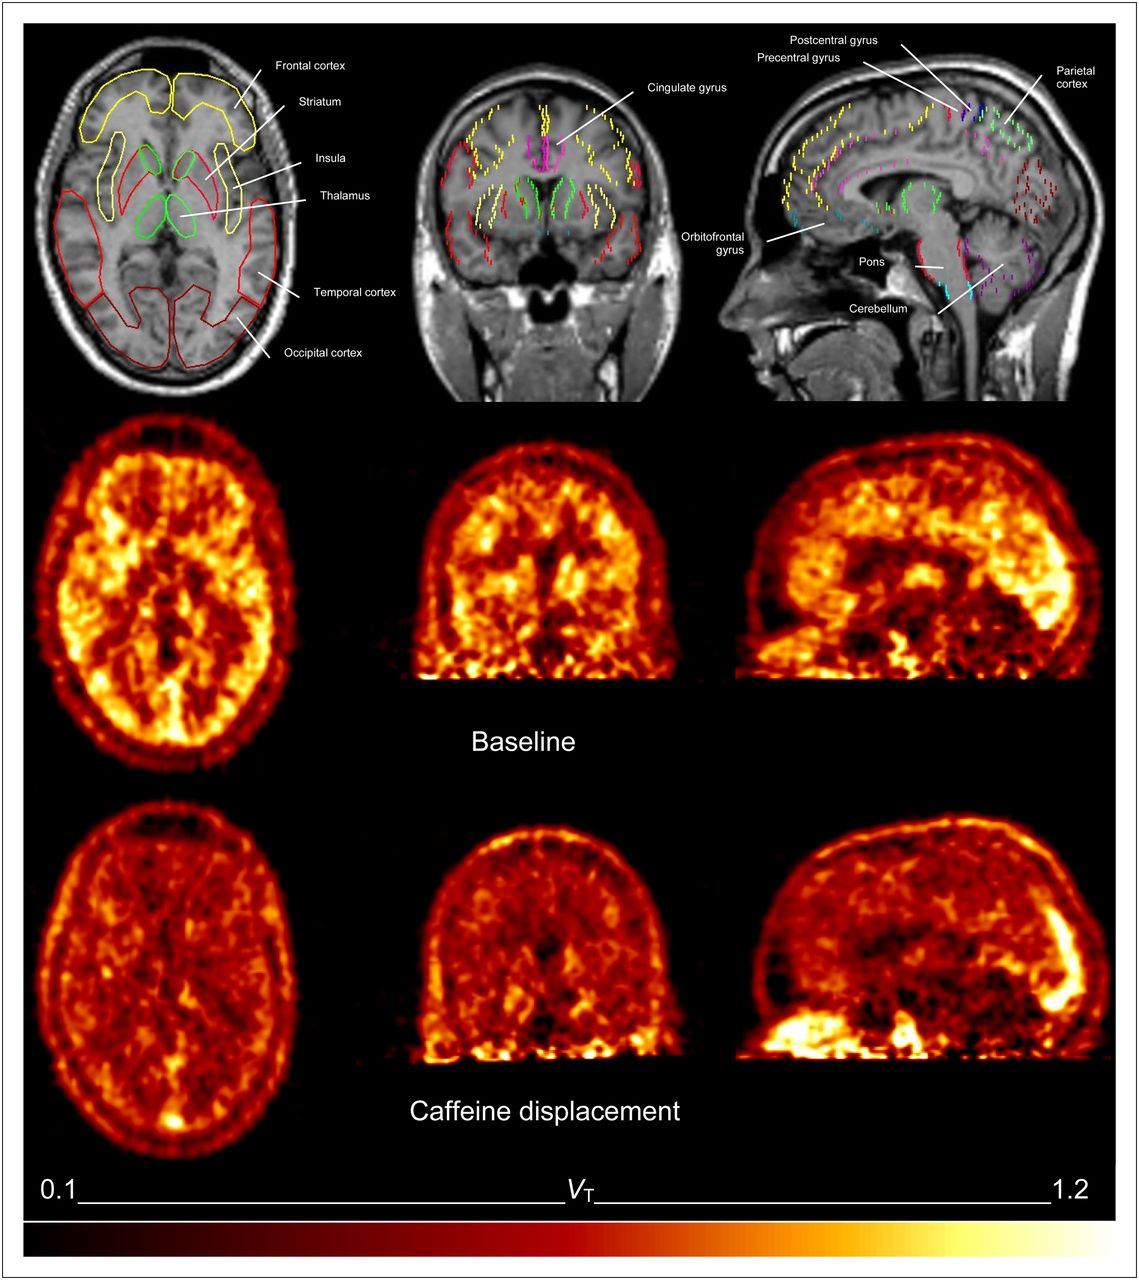
Interactive 3-dimensional image registration software (MPI-Tool, version 3.35; ATV) was used to align individual MRI datasets to the anterior commissure–posterior commissure line. To correct for possible head movements during the acquisition, all frames were realigned to an integrated PET image of the first 10 min using a mutual-information algorithm as implemented in MPI-Tool. The integrated PET frame was then coregistered to the individual MR image, and the resulting parameters were used to coregister the dynamic PET dataset accordingly. Because of the use of customized head shells and rigorous monitoring of patients for possible movements, we encountered only minor movements, which did not exceed the spatial resolution of the scanner. Thus, we made no attempt to realign the individual transmission scans to the emission images. Volumes of interest were defined by freehand drawing of polygonal regions of interest onto individual MR images using the software package PMOD (version 2.5; PMOD Group). Maximum reproducibility was achieved using identical regions of interest for both conditions. All analyses were performed by a single well-trained investigator using high-resolution MRI data. Thus, interrater variability was avoided. These volumes were used to generate time–activity curves. Time–activity curves were calculated for the following side-averaged cerebral volumes of interest: frontal cortex, orbitofrontal cortex, cingulate gyrus, insula, parietal cortex, occipital cortex, pre- and postcentral gyrus, temporal cortex, mesiotemporal cortex, thalamus, striatum, pons, and cerebellar cortex. Time–activity curves were corrected for the contribution of intracerebral blood volume to the regional activity assuming a fractional blood volume of 5%.
Distribution volumes were calculated using an equilibrium analysis. In the notation of a 2-tissue-compartment model, cerebral 18F-CPFPX concentration can be assumed to be distributed in the intracerebral free and nonspecifically bound (nondisplaceable) (CND) compartment and in the specifically bound (displaceable) (CS) compartment, as well as in a plasma compartment (CP). At equilibrium conditions, ligand concentrations in the arterial and venous plasma can be assumed to be equal. The concentration of 18F-CPFPX in venous plasma can therefore be used as a measure of CP, as has been shown previously (18). The blood volume–corrected tissue time–activity curves summarize CND and CS. Under equilibrium conditions, the total distribution volume (VT) is defined as the sum of the nondisplaceable distribution volume (VND) and specific distribution volume (VS), each composed of CND and CS related to CP (VT = time–activity curve [equilibrium conditions]/CP).
Parametric images representing VT were generated by dividing each frame voxelwise by its corresponding plasma concentration of 18F-CPFPX. Frames were then time-averaged for the baseline and displacement conditions.
Occupancy Estimation and Estimation of Caffeine IC50
To estimate the occupancy of A1AR by caffeine, VT at baseline (70–90 min) was compared with VT after caffeine administration (120–140 min). The fraction of occupancy was determined by the Lassen plot (26,27). This approach is based on the assumption that all regions have identical VND estimates. If the reduction in VT by the pharmacologic intervention is plotted versus VT at baseline, the slope of the resulting regression line corresponds to the occupancy and the y-axis intercept to VND. True equilibrium conditions have to be fulfilled during baseline and displacement estimations of VT to gain valid estimates of VT and, consequently, of fractional occupancy and VND.
On the basis of the occupancy estimates from the Lassen plot, the IC50 can be determined by fitting the occupancy data versus the corresponding plasma caffeine concentration using the following formula:
RESULTS
18F-CPFPX Bolus Infusion
Mean injected radioactivity was 346 ± 49 MBq (range, 220–370 MBq). The quantity of injected CPFPX was 17.5 ± 18.7 nmol (range, 1.6–66 nmol). The mean rate of change of the concentration of parent compound between 50 and 90 min was 6.4% ± 8.3%/h. Figure 1 depicts the time course of 18F-CPFPX in plasma and the respective concentration in cerebral tissue in a representative subject. The steady state of 18F-CPFPX in plasma and tissue was achieved 40–50 min after the start of injection. On infusion, caffeine displaced 18F-CPFPX rapidly in all brain regions. It also led to an increase of the plasma concentration of 18F-CPFPX (Fig. 1) by competitive inhibition of CYP1A2 (as previously described in the studies by Meyer et al. (18) and Matusch et al. (28)). The tissue-to-plasma ratio (reflecting VT during equilibrium) attained steady-state conditions after 60–70 min. Average regional VT estimates, based on the tissue-to-plasma ratio between 70 and 90 min, can be found in Table 1. The VT values found in the present study are in agreement with previously reported values (18).
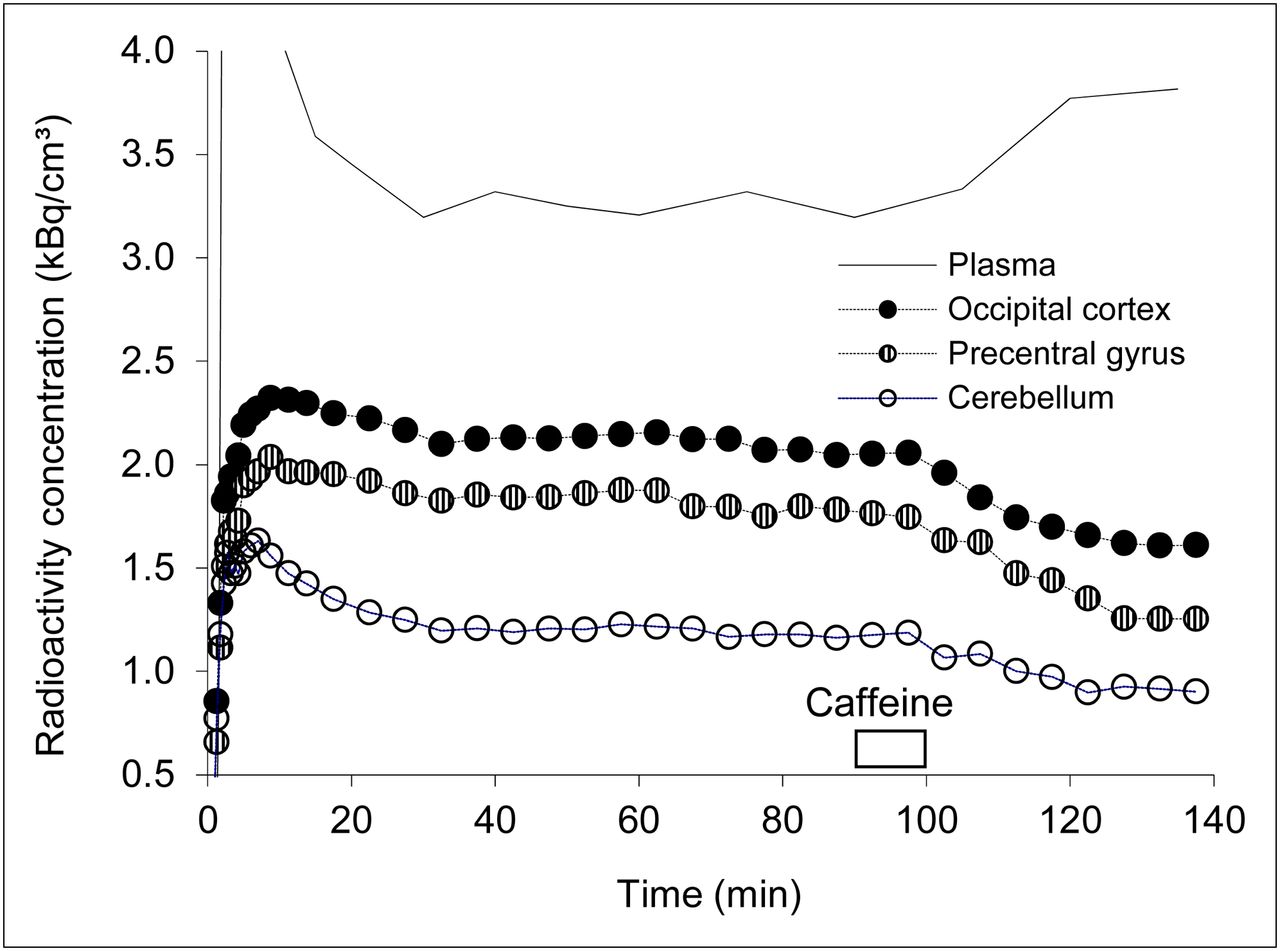
Representative regional time–activity curves and corresponding concentration of unmetabolized 18F-CPFPX in plasma in subject who received highest dose of caffeine and showed highest displacement (caffeine challenge at 90–100 min with a dose of 4.3 mg/kg of body weight).
Regional VT at Baseline
Caffeine Plasma Levels
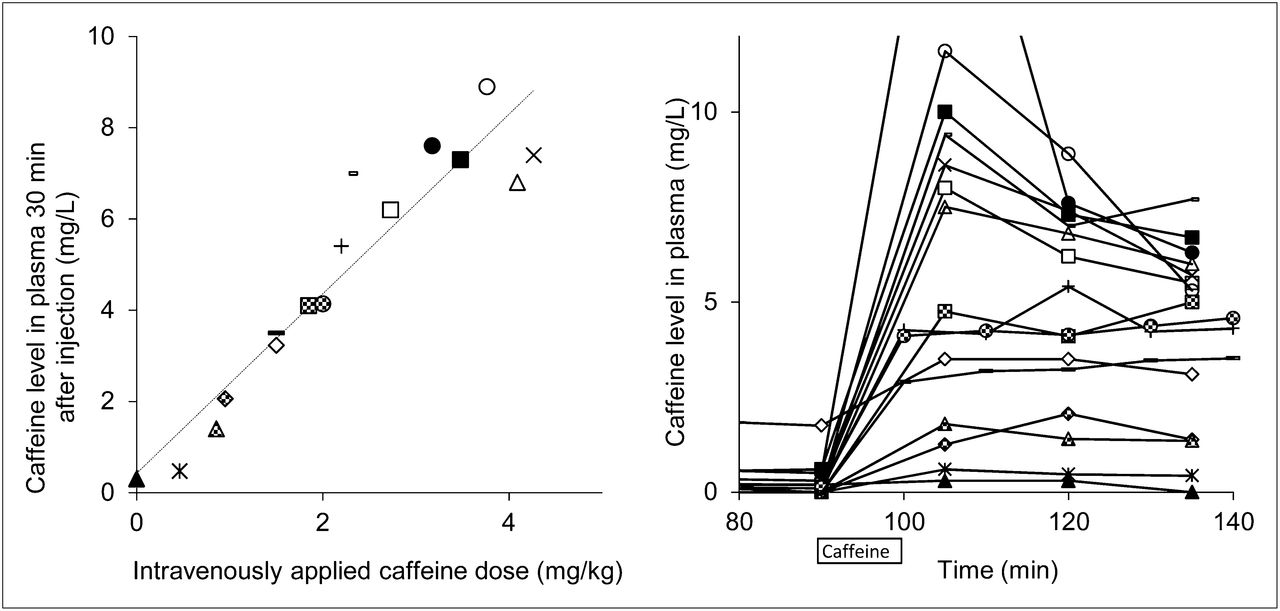
There is a highly significant, linear relationship (r = 0.94, P < 10−8) between intravenously applied caffeine doses (per body weight) and attained caffeine plasma concentrations (Fig. 2, left). The time course of plasma caffeine concentrations is displayed on the right graph in Figure 2. After an initial distribution phase, stable caffeine levels were observed from 120 min onward. This observation is in line with the terminal half-life of caffeine of approximately 5–6 h. Caffeine doses in the range of 0–9 mg/L were achieved at a time point of 120 min, which was used for further estimations of IC50 values.

(Left) Correlation between caffeine doses and caffeine plasma levels determined 30 min after intravenous application of caffeine (dotted regression line). (Right) Time course of individual plasma caffeine levels (time scale corresponds to PET experiments). Identical markers for each subject were used in Figure 2 (left and right) and Figure 5.
Impact of Caffeine on 18F-CPFPX VT and Estimation of Caffeine IC50
Caffeine displaced 18F-CPFPX in a dose-dependent manner. Parametric images of VT of 1 subject before and after caffeine administration are shown in Figure 3. Representative time courses of the apparent VT after various doses of caffeine are plotted in Figure 4. The vehicle did not significantly affect VT. Caffeine led also to a dose-dependent reduction of VT in the cerebellum, the region with the lowest binding in the human brain. Maximum VT displacement in the cerebellum was 33% at the highest caffeine dose.

Representative parametric images of total distribution volume of 1 subject at baseline (average from 60 to 85 min, middle) and after 4.1 mg/kg dose of caffeine (average from 115 to 140 min, bottom). Corresponding anatomic MR images, with overlay of regions of interest, were used for analysis (top).

Dose-dependent displacement of 18F-CPFPX by caffeine in frontal cortex. VT is plotted vs. time for 4 subjects who received different doses of caffeine or vehicle at 90–100 min. For visualization purposes, VT was normalized to mean of 75–90 min.
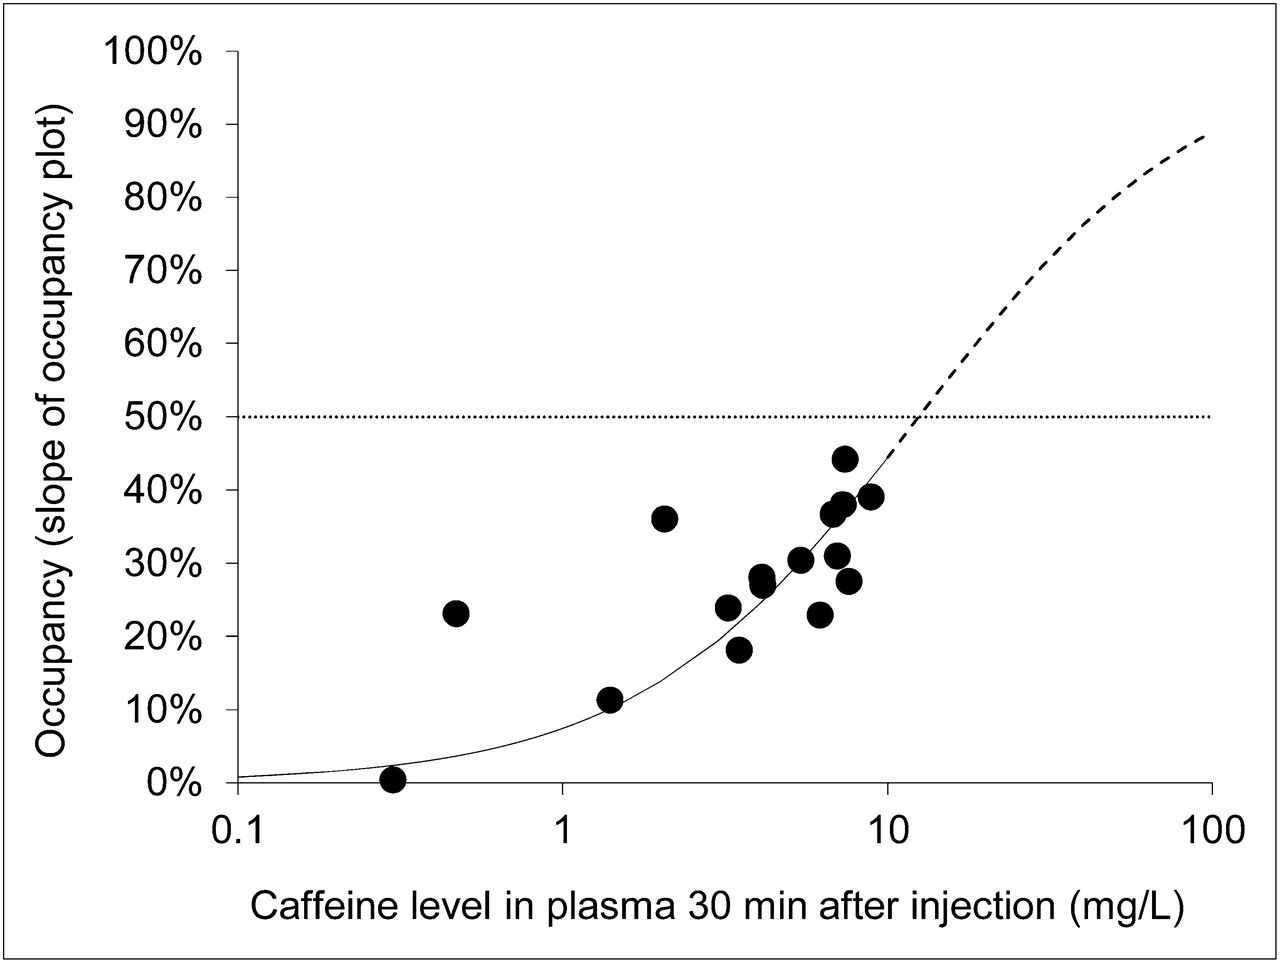
Lassen plots and fits of all subjects are displayed in Figure 5. The maximum occupancy achieved in this study was 44% (4.27 mg/kg). Cerebral A1AR occupancy was clearly dependent on the plasma caffeine level (Fig. 6). According to Equation 1, the IC50 of caffeine amounted to 12.5 mg/L (SE of fit, 1.5 mg/L). VND based on the Lassen plot (x-axis intercept) was 0.11 ± 0.10, which corresponds to one quarter of the average cerebellum VT.
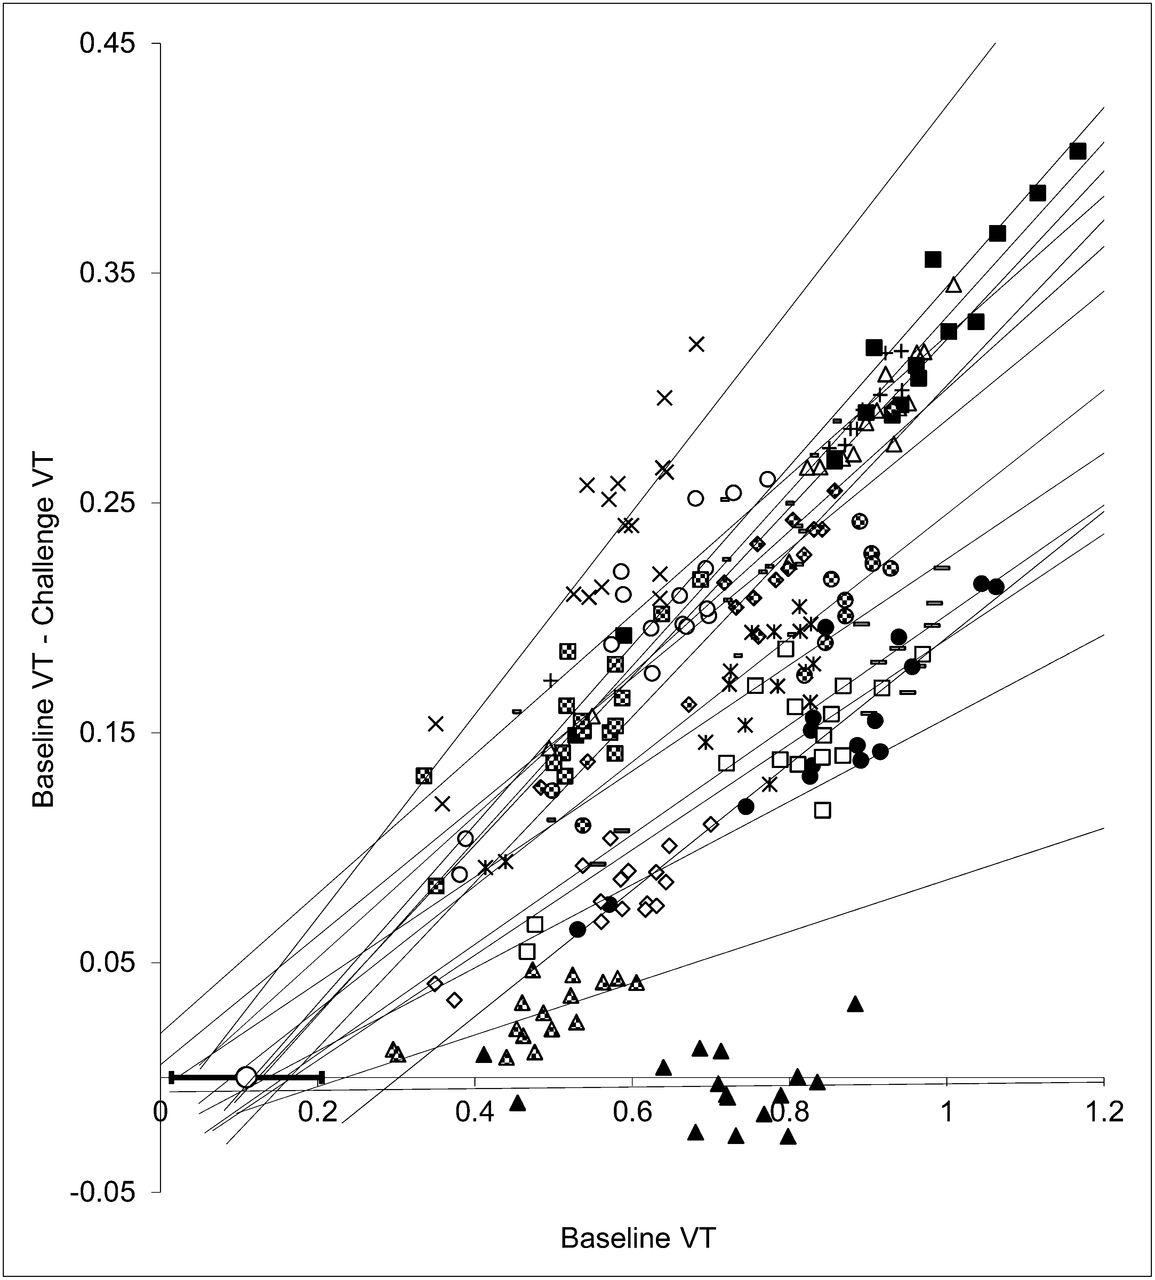
Occupancy (Lassen) plots obtained from 15 doses of caffeine and vehicle (▲). Lines represent regression lines for each subject or dose. The open circle overlaid on x-axis shows average VND (corresponding to x-axis intercepts of regression lines). Error bars indicate SD of all experiments (except vehicle).

Relationship between caffeine plasma concentration and A1AR occupancy (n = 16) estimated for all regions using slope of occupancy (Lassen) plot. Line represents corresponding fit used to determine IC50 (dotted line), with maximal occupancy constrained to 100%. Solid line represents fit according to Equation 1, and dashed line represents extrapolated values of this fit for higher concentrations of caffeine (as described in “Materials and Methods” section).
DISCUSSION
Caffeine is the most commonly and broadly used neurostimulant. Therefore, it is a longstanding desire in neuroscience and addiction research to investigate the effects of caffeine directly in the human brain. We used the PET tracer 18F-CPFPX to visualize and quantify the occupancy of the A1AR, the most abundant caffeine target in the human brain. The present study demonstrates that 18F-CPFPX is highly displaceable by caffeine and allows the determination of the occupancy of A1ARs by caffeine in vivo and in a quantitative manner.
On the basis of the present PET study, the IC50 of caffeine amounts to approximately 13 mg/L, corresponding to about 67 μM caffeine in plasma. This value can be extrapolated to an oral caffeine intake of 450 mg in a 70-kg subject, which corresponds to approximately 4–5 cups of coffee. It is therefore likely that usually consumed amounts of coffee and caffeinated beverages (29) result in brain concentrations of caffeine that block substantial portions of cerebral A1ARs. Because A1ARs are quantitatively the most important neocortical binding sites of caffeine in the human brain, it is likely that the cognition-enhancing effects of caffeine are exerted by this adenosine receptor subtype. With regard to future A1AR PET studies, it is important to keep in mind that acute caffeine consumption will severely bias quantitative A1AR PET measurement. Thus, a sufficiently long caffeine abstinence is mandatory before scanning.
This is the first, to our knowledge, in vivo study on cerebral A1AR occupation by caffeine in humans. Therefore, it is interesting to compare our results with previous in vitro investigations. We recently determined the IC50 of caffeine in human postmortem frontal cortex homogenates. Using 3H-CPFPX, the tritiated analog of 18F-CPFPX, we determined the in vitro IC50 to be in the range of 113–170 μM. To compare these values with the in vivo data, assumptions about the biodistribution of caffeine have to be made because no human data on intercellular caffeine accumulation are available. The ratio of plasma caffeine to CSF caffeine is close to 1 in rats (10). Assuming the cellular conditions in humans and rats are comparable in this respect, the IC50 for plasma will then lead to a CSF concentration of 67 μM, which is about half the in vitro value. This discrepancy might be caused by species differences in the plasma-to-CSF ratio, the in vivo versus the in vitro settings of the experiments, or postmortem changes. Besides these technical reasons, the presence of caffeine metabolites, which are probably also binding to the A1AR, might explain the difference between in vivo and in vitro conditions as well. For instance, theophylline binds to A1ARs with a Ki (binding affinity of the inhibitor) of 8.5 μM (30), and theobromine, another metabolite, has a Ki comparable to that of caffeine (97–197 μM) (31). Finally, incomplete kinetic equilibration after caffeine administration may also contribute to a possible underestimation of the IC50: although stable concentrations of 18F-CPFPX in plasma and the cerebral compartment were attained at baseline (70–90 min), plasma concentrations of 18F-CPFPX rose after caffeine administration. This increase of plasma concentration is most likely caused by competitive inhibition of caffeine and CPFPX at their common hepatic enzyme CYP1A2 (18,28). The changed equilibrium of 18F-CPFPX in plasma and tissue may accordingly not have been fully attained between 120 and 140 min (Fig. 1, precentral gyrus). Because the cerebral kinetics of 18F-CPFPX may be delayed relative to plasma kinetics, VT could be overestimated during displacement, resulting in an underestimation of IC50. However, available data up to 140 min suggest that the underestimation is less than 5%.
The present estimate of VND from the Lassen plots is relatively low (VND, 0.11 ± 0.10), corresponding to about one quarter of the cerebellar VT. In an earlier 18F-CPFPX displacement study using unlabeled CPFPX, VND was about two thirds of the VT of the cerebellum (19). Again, incomplete equilibration might be accountable for this difference. In a previous study, we have carefully evaluated changes of specific binding in the reference region with regard to their effects on noninvasive outcome parameters such as the binding potential (20). We also investigated the constraints for using the cerebellum as a reference region, which allows omitting blood sampling and reduces the additional noise introduced by blood analyses.
In the field of neuroimaging (especially the blood oxygen level–dependent [BOLD] contrast imaging–functional MRI), caffeine is known to lower the resting state or baseline BOLD signal (32). It is likely that the observed caffeine effects on the BOLD contrast are a combination of the increased neuronal activation (33) through a disinhibitory mechanism at the A1AR and a reduction of the cerebral blood flow (34) by inhibition of vascular A2A adenosine receptors. The present method of A1AR occupancy measurements with 18F-CPFPX, by providing individual data of A1AR densities and acute caffeine effects in a regional and quantitative manner, could help to solve current inconsistencies in findings related to caffeine and functional MRI (32).
An important finding of the present study is that in most regular consumers of caffeine, about half of the cerebral A1ARs may be occupied by caffeine . It is likely that this phasic blockade of a substantial amount of cerebral A1ARs will result in adaptive changes and lead to chronic alterations of receptor expression and availability. There is substantial epidemiologic evidence that caffeine is protective against neurodegenerative diseases such as Parkinson or Alzheimer disease. Several investigations (e.g., the Cardiovascular Risk Factors, Aging and Dementia study) show that moderate coffee consumption of 3–5 cups per day at mid life is linked to a smaller risk of dementia in late life (35). The present study provides evidence that typical caffeine doses result in a high phasic receptor occupancy, which will most likely induce chronic cerebral, especially neocortical, A1AR changes. These findings support the view that the A1AR deserves broader attention in the context of neurodegenerative disorders. Further studies will be needed to investigate the precise interplay of age, adenosine receptors, and neurodegenerative pathophysiology.
CONCLUSION
This study demonstrates that caffeine occupancy studies of the cerebral A1AR can be performed with 18F-CPFPX bolus–plus–constant-infusion PET protocols. Our data provide evidence that repeated intake of caffeinated beverages results in a 50% occupancy of the cerebral A1AR during longer periods of the day. 18F-CPFPX PET represents a valuable technique for studying the neurostimulant and chronic neuroplastic effects of caffeine in humans.
DISCLOSURE STATEMENT
The costs of publication of this article were defrayed in part by the payment of page charges. Therefore, and solely to indicate this fact, this article is hereby marked “advertisement” in accordance with 18 USC section 1734.
Acknowledgments
We thank Dirk Bier, Marcus H. Holschbach, Jürgen Burhenne, and Walter E. Haefeli for the determination of plasma caffeine levels. We gratefully acknowledge Marlene Vögeling, Lutz Tellmann, Elisabeth Theelen, Suzanne Schaden, Hans Herzog, and Markus Lang for excellent technical assistance and Johannes Ermert, Silke Grafmüller, Bettina Palm, and Erika Wabbals for the synthesis of 18F-CPFPX. This work was supported by the Federal Ministry of Education and Research, Germany (FKZ01GP1002B). No other potential conflict of interest relevant to this article was reported.
Footnotes
↵* Contributed equally to this work.
Published online Sep. 10, 2012.
- © 2012 by the Society of Nuclear Medicine and Molecular Imaging, Inc.
REFERENCES
- Received for publication February 27, 2012.
- Accepted for publication May 31, 2012.


Jump to section
Related Articles
Cited By...
- Effect of Acute Hypoxia Exposure on the Availability of A1 Adenosine Receptors and Perfusion in the Human Brain
- Relative Strengths of Three Linearizations of Receptor Availability: Saturation, Inhibition, and Occupancy Plots
- Caffeine-induced Plasticity of Grey Matter Volume in Healthy Brains: A placebo-controlled multimodal within-subject study
- Caffeine-dependent changes of sleep-wake regulation: evidence for adaptation after repeated intake
- Cognitive impairments by alcohol and sleep deprivation indicate trait characteristics and a potential role for adenosine A1 receptors
- Caffeine, the circadian clock, and sleep
- Use of 11C-MPDX and PET to Study Adenosine A1 Receptor Occupancy by Nonradioactive Agonists and Antagonists