


Abstract
Adenosine A1 receptors (A1Rs) in human and rodent brains can be visualized with the radioligand 8-dicyclopropylmethyl-1-11C-methyl-3-propylxanthine (11C-MPDX) and PET. Here we investigated whether A1R occupancy by nonradioactive agonists and antagonists can be assessed with this technique. Methods: Small-animal PET scans with arterial blood sampling were obtained for 4 groups of isoflurane-anesthetized Wistar rats: controls (n = 7); pretreated with a centrally active A1R agonist, N6-cyclopentyladenosine (CPA; 0.25 mg/kg intraperitoneally; dissociation constant, 0.48 nM; n = 7); pretreated with a moderate dose of caffeine (antagonist for A1Rs and adenosine A2A receptors; 4 mg/kg intraperitoneally; dissociation constant, 11 μM; n = 6); and pretreated with a high dose of caffeine (40 mg/kg intraperitoneally; n = 6). Results: The administration of CPA resulted in a strong reduction (>50%) in the heart rate, and caffeine administration resulted in a small increase (10%–15%). A caffeine dose of 4 mg/kg (n = 6) resulted in 65.9% A1R occupancy, and a dose of 40 mg/kg (n = 6) resulted in 98.5% occupancy (calculated from a modified Lassen plot). However, the administration of CPA resulted in an increase in 11C-MPDX binding in the brain. Conclusion: Small-animal PET with 11C-MPDX can be used to assess antagonist but not agonist binding at A1Rs. Changes in tracer uptake after the administration of CPA resembled previously reported changes induced by treatment of rats with ethanol and an adenosine kinase inhibitor (ABT702). Thus, the administration of an exogenous agonist or increasing the level of an endogenous agonist have similar effects. Agonists and antagonists may bind to different sites on the A1R protein having allosteric interactions.
Adenosine A1 receptors (A1Rs) are G protein–coupled binding sites for the endogenous neuromodulator adenosine that inhibit the formation of the second messenger, cyclic adenosine monophosphate. They are implicated in the regulation of neuronal activity, neuroprotection, and neuroinflammation (1). Some A1R agonists may be beneficial in the treatment of atrial arrhythmias, type 2 diabetes, and angina (2).
Cerebral A1Rs can be visualized with PET and radiolabeled xanthine antagonists, such as 8-dicyclopropylmethyl-1-11C-methyl-3-propylxanthine (11C-MPDX) (3,4) and 8-cyclopentyl-3-[3-18F-fluoropropyl]-1-propylxanthine (18F-CPFPX) (5,6). In a previous study, we reported that 11C-MPDX and small-animal PET can be used to quantify regional A1R densities in the rodent brain (7). PET offers unique opportunities for measuring the fraction of receptor populations occupied by nonradioactive drugs in the living brain and relating levels of occupancy to the magnitude of the therapeutic effect or to unwanted side effects. Receptor occupancy is estimated by assessing the competition of a nonradioactive drug and the radioligand for the same binding sites.
To explore the interaction of therapeutic drugs with A1Rs, we treated rats with 2 test drugs before 11C-MPDX small-animal PET scans: N6-cyclopentyladenosine (CPA) and caffeine. CPA is a potent adenosine receptor agonist (dissociation constant, 0.48 nM) with considerable selectivity for the A1 subtype (8,9). Caffeine is a non–subtype-selective adenosine antagonist with moderate affinity (50% inhibitory concentration, 11–85 μM) and is widely consumed as a recreational drug (10,11). Occupancy of cerebral A1Rs by caffeine or the potent (dissociation constant, 0.42 nM) and highly subtype-selective A1R antagonist 8-cyclopentyl-1,3-dipropylxanthine (DPCPX) (12,13) has been visualized with the tracer 18F-CPFPX (14,15) or 11C-MPDX (7) and PET. However, PET studies of the occupancy of cerebral A1Rs by agonists have never been reported. The findings of the present study, together with those of previous studies, indicate that dose-dependent occupancy of the A1R population by antagonists can be assessed with PET. However, the administration of a high dose of the agonist CPA, which strongly decreases heart rate, body temperature, and locomotor activity in rodents (16), does not result in any measurable decline in binding of the PET tracer 11C-MPDX in the rodent brain.
MATERIALS AND METHODS
(Radio)chemicals
CPA and caffeine were purchased from Sigma. The radioligand 11C-MPDX was prepared as described previously (7).
Experimental Animals
All animal experiments were performed by licensed investigators in compliance with the Law on Animal Experiments of The Netherlands. The protocol was approved by the Committee on Animal Ethics of the University of Groningen. Male outbred Wistar–Unilever (specific-pathogen-free) rats (body weight [mean ± SD], 304 ± 54 g) were obtained from Charles River, maintained with a 12-h light–12-h dark regimen, and fed standard laboratory chow ad libitum. Four groups of animals were studied: controls (pretreated with saline intraperitoneally; n = 7); pretreated with CPA (0.25 mg/kg intraperitoneally; dissolved in 0.3 mL of saline containing <50 μL of dimethyl sulfoxide; n = 7) (16); pretreated with a moderate dose of caffeine (4 mg/kg intraperitoneally; dissolved in saline; n = 6); and pretreated with a high dose of caffeine (40 mg/kg intraperitoneally; dissolved in saline; n = 6). All treatments were given 5–10 min before injection of the tracer. Body weights and injected doses are shown in Table 1.
Animal Data
PET Scanning
Two rats were scanned simultaneously with a Focus 220 microPET (small-animal PET) camera (Siemens Medical Solutions). Animals were anesthetized with a mixture of isoflurane and air (ratio during induction, 5%; later reduced to ≤2%). Cannulas were placed in a femoral artery and vein for blood sampling and tracer injection, respectively. A transmission scan was obtained with an external source of radioactive cobalt to correct the subsequently acquired 11C-MPDX emission images for attenuation and scatter. Rats were under anesthesia for 30–40 min before tracer injection (time required for cannulation and transmission scan). The tracer (11C-MPDX; 21.5 ± 9.7 MBq in a volume of 1 mL) was injected through the venous cannula, as a slow (1-min) bolus, with a Harvard-style pump. The camera was started as soon as the tracer entered the body of the first rat in the scanner; the second animal of the pair was injected 16 min later. Scanning was then continued for another 60 min. The animal that was injected second had also been anesthetized at a later time. Thus, the duration of anesthesia was similar in all study groups.
A list-mode protocol was used (76 min; brain in the field of view). A series of blood samples (18 samples; volume, 0.10–0.15 mL) were drawn, initially in rapid succession (5 s) and later at longer intervals (up to 30 min). Plasma was acquired from these samples by centrifugation (Eppendorf centrifuge; 5 min at 13,000 rpm). Radioactivity counts in 25 μL of plasma and 25 μL of whole blood were determined and used as an arterial input function. During the entire scanning procedure, the heart rate, stroke volume, and blood oxygen level of the animals were monitored with pulse oximeters (PulseSense; Nonin).
Analysis of PET Data
List-mode data were reframed into a dynamic sequence of 8 × 30 s, 3 × 60 s, 2 × 120 s, 2 × 180 s, 3 × 300 s, 1 × 480 s, 3 × 600 s, and 1 × 960 s frames. The data were reconstructed per time frame with an iterative reconstruction algorithm (attenuation-weighted 2-dimensional ordered-subset expectation maximization; provided by Siemens; 4 iterations; 16 subsets; zoom factor, 2). The final datasets consisted of 95 slices (slice thickness, 0.8 mm) and an in-plane image matrix of 128 × 128 pixels (size, 1.1 mm). Datasets were fully corrected for random coincidences, scatter, and attenuation. Images were smoothed with a gaussian filter (1.35 mm in both directions).
Time–activity curves and volumes (cubic centimeters) for the areas of interest were calculated with Siemens Inveon Research Work Place 4.0 (IRW 4.0). A region of interest was drawn around the (entire) olfactory bulbs, frontal cortex, striatum, amygdala, parietal cortex, temporal cortex, occipital cortex, medulla, cerebellum, pons, and hippocampus in a template MR imaging scan that was coregistered with the PET scan of interest by image fusion (17). Standardized uptake values (SUVs) measured by PET were calculated with measured body weights and injected doses as follows: tissue activity concentration (MBq/mL)/[injected dose (MBq)/body weight (g)]. The cerebral volume of distribution (VT) of the tracer was estimated either from a Logan plot (linear regression started 10 min after tracer injection) or from a 2-tissue-compartment model (2TCM) fit. For Logan graphic analysis, the blood volume was fixed at 3.6% (18). The partition coefficient (K1/k2) and the binding potential (k3/k4) of 11C-MPDX were estimated from the model fit.
Because there is no region with negligible A1R expression in the rodent brain, levels of receptor occupancy were calculated by comparing regional VTs in control and drug-treated rats with a modified (i.e., axis-transformed) Lassen plot (19).
Biodistribution Studies
After the PET scan, the anesthetized animals were sacrificed. Blood was collected, and plasma was obtained from the blood sample by centrifugation (5 min at 1,000g). Several areas of the brain were dissected, and peripheral organs were excised. These tissue samples were weighed, and tissue radioactivity was measured by use of a γ counter with the application of decay correction. Tracer uptake was expressed as the dimensionless SUV.
Statistical Tests
Differences between groups were analyzed with a 1-way ANOVA. A probability of less than 0.05 was considered statistically significant.
RESULTS
Physiologic Responses to Drug Treatment
About 5 min after administration of the A1R agonist CPA, a strong decline (>50%) in the heart rate was noted. This decline persisted for the entire duration of the small-animal PET scan (60 min), although a slight return toward the baseline rate occurred near the end of the scan. The decline in the heart rate was accompanied by an increase in the cardiac stroke volume. Blood oxygenation levels were not significantly altered. The administration of caffeine resulted in a small increase (10%–15%) in the heart rate after 5 min; this increase persisted for the entire duration of the scan. There was no significant change in blood oxygenation levels.
Animal PET Images
The PET images acquired in the present study were similar to those reported previously (7). When animals were pretreated with the A1R agonist CPA, a global increase in tracer uptake relative to that observed in the control group was noted. After pretreatment of rats with caffeine (particularly at the high dose), cerebral uptake of the tracer was strongly reduced, and regional differences in tracer uptake were no longer apparent.
Kinetics of Radioactivity in Brain and Plasma
The cerebral kinetics of radioactivity in the present study were also similar to those reported previously (7). In rats pretreated with CPA, an increase in the uptake of radioactivity relative to that in the control group was noted (Fig. 1). In animals pretreated with caffeine, rapid washout of the tracer was observed, and the brain uptake of 11C-MPDX was strongly reduced (Fig. 1).

Kinetics of 11C-MPDX–derived radioactivity in rat brain. Error bars indicate SEMs. • = control animals; ○ = CPA-treated animals; ♢ = animals treated with caffeine at 4 mg/kg; ♦ = animals treated with caffeine at 40 mg/kg.
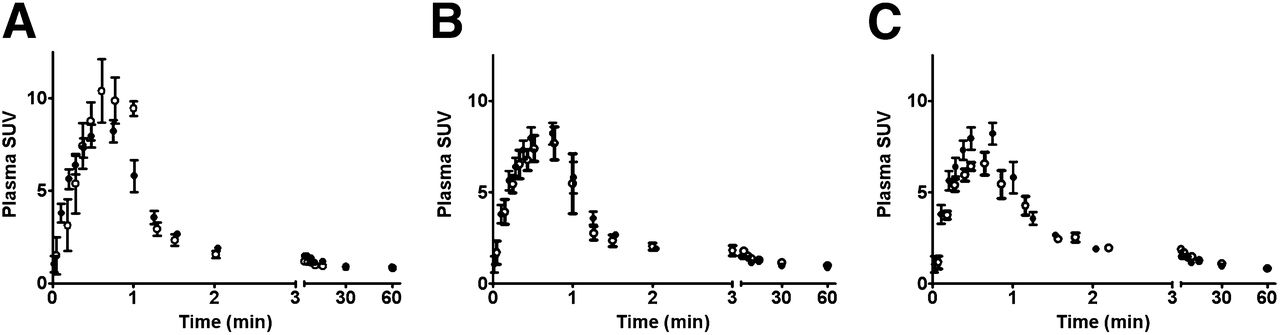
The clearance of radioactivity from plasma appeared to be affected little by drug treatment. Although the shape of the plasma curve was different after treatment of animals with CPA, with a stronger initial increase in plasma radioactivity and then a greater decline (Fig. 2), areas under the curve were similar in the 4 treatment groups. Expressed as a percentage of the value for the control group, they were 92% ± 9% (CPA), 112% ± 20% (caffeine at 4 mg/kg), 104% ± 19% (caffeine at 40 mg/kg), and 100% ± 16% (saline-treated control). None of these differences was statistically significant.

Kinetics of 11C-MPDX–derived radioactivity in rat plasma. Error bars indicate SEMs. • = control animals; ○ = animals treated with CPA (A), caffeine at 4 mg/kg (B), and caffeine at 40 mg/kg (C).
Biodistribution Data
The biodistribution data acquired after the PET scan (Table 2) corresponded closely to the PET SUV data in the last scan frame. Treatment of rats with CPA did not result in any decrease but rather resulted in an increase in cerebral radioactivity. This increase was statistically significant in the amygdala, cerebellum, frontal cortex, hippocampus, medulla, parietal cortex, temporal cortex, occipital cortex, striatum, and the brain tissue left over after dissection. The increase noted in the entorhinal cortex and pons was not statistically significant because of a relatively large individual variance in the study groups. Outside the brain, tracer uptake was increased only in the liver (Table 2).
Biodistribution Data for 11C-MPDX 80 Minutes After Injection
Pretreatment of animals with caffeine (4 mg/kg) reduced tracer uptake in the cingulate gyrus, entorhinal cortex, frontal cortex, hippocampus, medulla, and striatum. Among the peripheral organs, a significant reduction in tracer uptake was observed only in the spleen. Levels of radioactivity in the urine were increased (Table 2).
Pretreatment of rats with a high dose of caffeine (40 mg/kg) resulted in a highly significant reduction in tracer uptake in virtually all studied brain areas, with the exception of the pons and medulla (Table 2). Outside the brain, significant reductions in tracer uptake were noted in the spleen and duodenum, whereas uptake in the trachea was increased (Table 2).
Graphic Analysis of PET Data
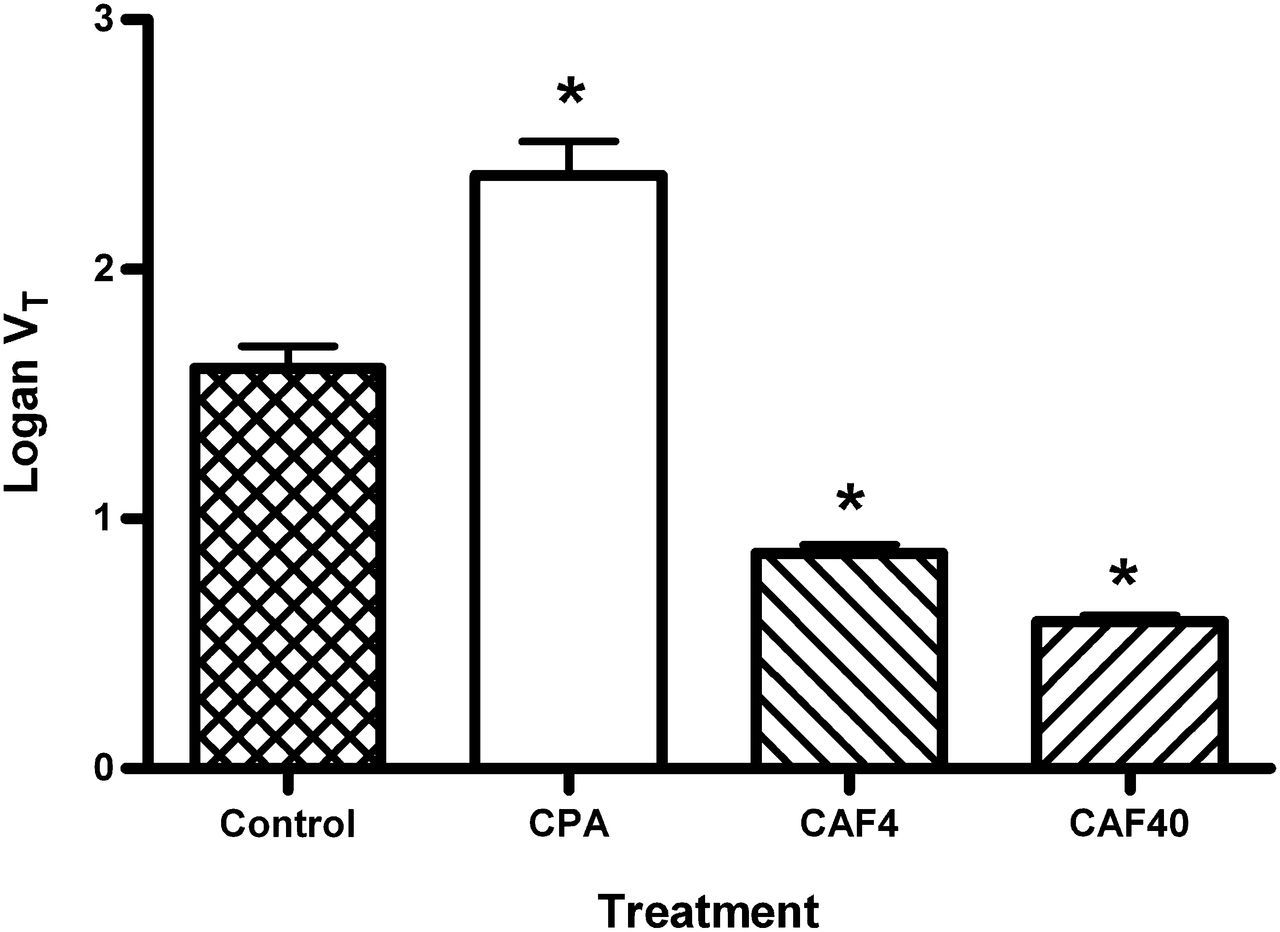
The tracer VT was calculated from a Logan plot, time–activity curves from a region of interest drawn around the entire brain, and radioactivity counts from arterial blood samples. Compared with the results for saline-treated controls, a significant increase in the VT after pretreatment of animals with CPA (from 1.60 ± 0.23 to 2.38 ± 0.36 [P = 0.0005]) and a significant decrease after pretreatment with caffeine (from 1.60 ± 0.23 to 0.86 ± 0.08 [P < 0.0001] after a dose of 4 mg/kg and to 0.59 ± 0.06 [P < 0.0001] after a dose of 40 mg/kg) were seen (Fig. 3).

VT of 11C-MPDX in whole brain, calculated from Logan plot. CAF4 = animals treated with caffeine at 4 mg/kg; CAF40 = animals treated with caffeine at 40 mg/kg; CPA = CPA-treated animals. *Significantly different from control group.
Compartment Modeling of PET Data
When a 2TCM was fitted to time–activity curves from a region of interest drawn around the entire brain, with radioactivity counts from arterial blood samples as the input function, the partition coefficient for 11C-MPDX (K1/k2 ratio from the model fit) was found to be not significantly affected by CPA but significantly decreased after the treatment of animals with caffeine (Fig. 4). Receptor occupancy by caffeine—calculated with the formula 100 × [(1 − k3/k4[drug-treated])/k3/k4(control)]—for the dose of 4 mg/kg was 69.8%, and that for the dose of 40 mg/kg was 100%.
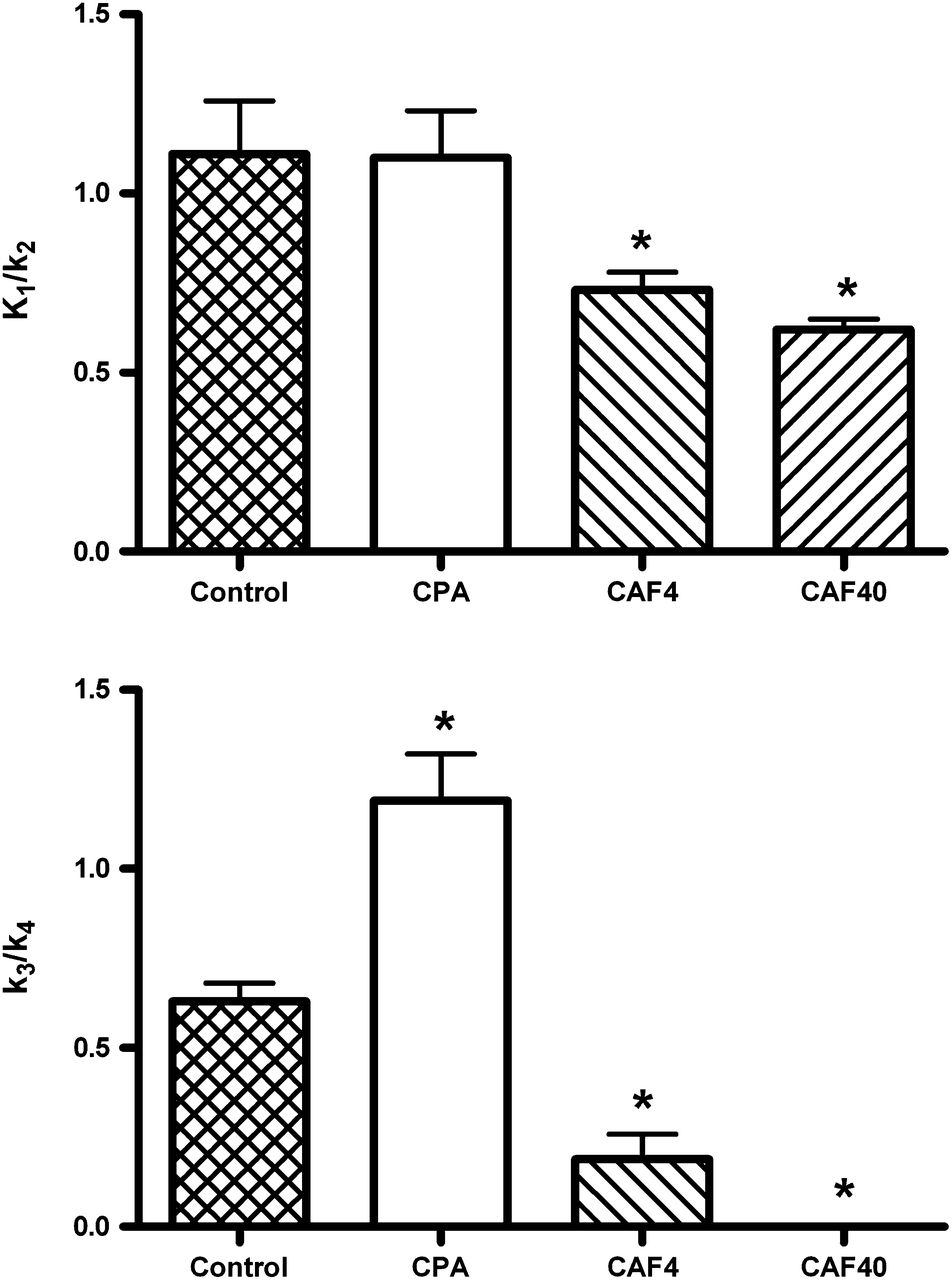
Partition coefficient (K1/k2) and binding potential (k3/k4) for 11C-MPDX in whole brain, calculated from 2TCM fit. CAF4 = animals treated with caffeine at 4 mg/kg; CAF40 = animals treated with caffeine at 40 mg/kg; CPA = CPA-treated animals.
Tracer k3/k4 was significantly increased after treatment with CPA and significantly decreased by caffeine (Fig. 4). The PET data for the high-dose caffeine group were better fitted by a 1-tissue-compartment model (1TCM) than a 2TCM, in contrast to the data for the other 3 treatment groups. Blood volume could be left floating during the 2TCM or 1TCM fit. The value estimated by the fit program was 3.3% ± 0.4% (mean ± SEM; n = 21). However, in some animals, the program estimated a blood volume of 0%. Data for these animals are not included in the value reported for blood volume.
Estimation of Receptor Occupancy
Modified Lassen plots were prepared from the regional Logan VTs for animals in the control, low-dose caffeine treatment, and high-dose caffeine treatment groups (Fig. 5). Both plots showed good correlation coefficients (r2 values of 0.9738 and 0.9086). Receptor occupancy by caffeine (estimated from the slope of the plot) at a dose of 4 mg/kg was 65.9%, and that at a dose of 40 mg/kg was 98.5%. The VT for nonspecific binding (estimated from the x-intercept of the plot) was about 0.5, that is, less than 25% of the total VTs in the target regions with the highest levels of A1R expression (hippocampus and cerebellum).
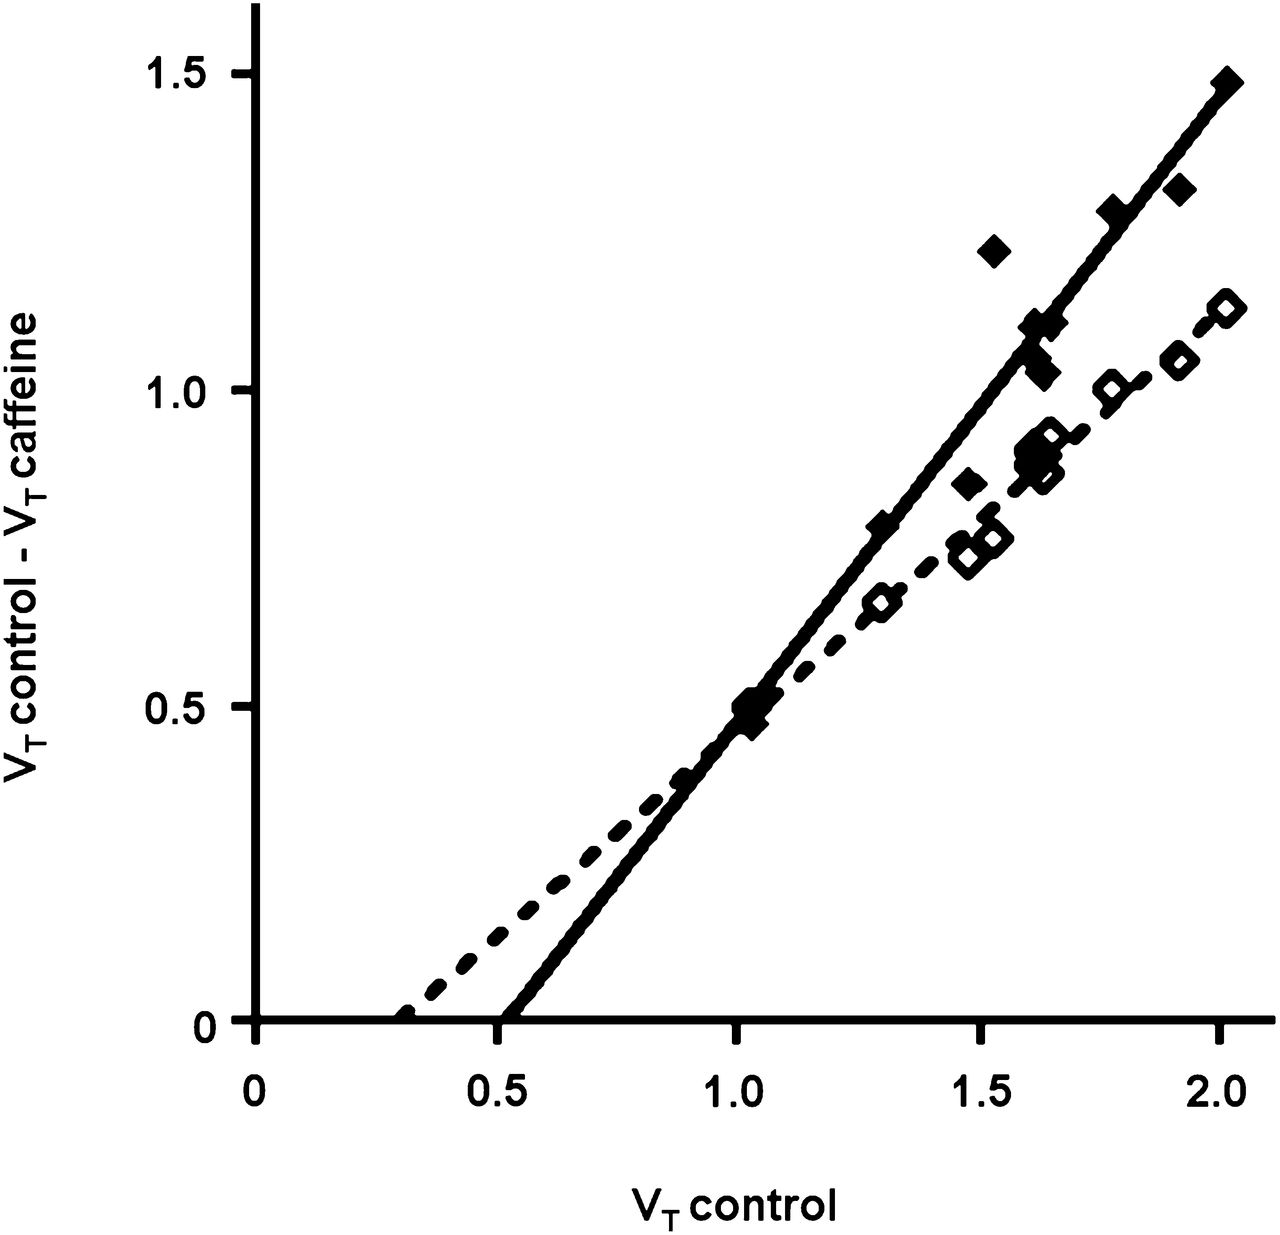
Lassen plots for A1R occupancy by caffeine. ♢ = 4 mg/kg; ♦ = 40 mg/kg.
DISCUSSION
The drug doses that we administered were based on data reported in the literature. CPA at a dose of 0.25 mg/kg causes a strong hypothermic response in rats that persists for at least 2 h. After repeated administration on subsequent days, a downregulation of cerebral A1R that is particularly significant in the hippocampus and somatosensory cortex is observed, and the A1R system is functionally desensitized (16). Thus, CPA enters the brain and interacts with cerebral A1R. Caffeine at a dose of 4 mg/kg has been shown to compete with the ligand 18F-FPCPX for binding to adenosine A1R in the rat brain (14). Although the agonist mass that we injected was an order of magnitude smaller than the mass of the antagonist (0.25 and 4 mg/kg, respectively), in functional terms the agonist dose was much higher because the affinity of CPA for A1R is in the subnanomolar range (8,9), whereas the affinity of caffeine for A1R and adenosine A2A receptors is in the 10−5 M range (10,11). However, competition between nonradioactive caffeine and 11C-MPDX for binding to cerebral A1R was observed, but competition between nonradioactive CPA and the radioligand was not detected.
A1R occupancy by caffeine could be calculated from a modified Lassen plot (Fig. 5) (19). A similar plot made from previously published data (7) indicated that the administration of the selective A1R antagonist DPCPX at 3.2 mg/kg was associated with 100% receptor occupancy. However, the occupancy of A1R by CPA could not be detected with 11C-MPDX, although the CPA dose that we injected caused a strong decline in the heart rate and was close to the upper limit that could be tolerated by our animals. This observation may indicate that purine agonists and xanthine antagonists interact with the A1R pharmacophore in different ways. Experiments in which A1Rs were chemically modified or altered by site-directed mutagenesis indeed showed that agonists and antagonists bind to different domains of the A1R protein (20,21).
We observed a paradoxic increase in 11C-MPDX binding in the rodent brain after the administration of CPA (Figs. 1, 3, and 4; Table 2). Compartmental analysis of brain time–activity curves with data from arterial plasma samples as an input function indicated that K1/k2 values were unchanged but that k3/k4 values were elevated after the treatment of animals with CPA (Fig. 4). Similar findings were reported previously for 11C-MPDX in animals that had been treated with ethanol and the adenosine kinase inhibitor ABT702 to increase the endogenous levels of extracellular adenosine (7). These kinetic modeling results suggest that tracer delivery or the passage of 11C-MPDX across the blood–brain barrier is not altered in the presence of CPA (or ethanol and ABT702) but that the availability of A1R or the affinity of A1R for the radioligand is increased.
The most simple explanation for increased cerebral binding of 11C-MPDX in the presence of CPA or increased levels of extracellular adenosine is the hypothesis that agonists and antagonists bind to different domains on a single A1R protein or to different protomers in a A1R homodimer (22), with agonist binding causing a conformational change in the receptor protein (or receptor complex) that facilitates the subsequent binding of an antagonist. Data from a few reports involving isolated biomembranes or brain slices have suggested that A1R agonists can indeed increase the binding of A1R antagonists to A1R (23,24) and vice versa (22).
CONCLUSION
Competition of nonradioactive xanthine antagonists (caffeine and DPCPX) with 11C-MPDX for binding to A1R in the brains of living rodents was observed with small-animal PET, and values for dose-dependent receptor occupancy could be calculated from a modified Lassen plot (Fig. 5). However, the administration of a high dose of an agonist with a purine structure (CPA) did not result in measurable competition with 11C-MPDX for binding to the target receptor. These data and the data from our previous small-animal PET study with ethanol and ABT702 (7) suggested that agonists and antagonists bind to different sites on the A1R protein which may show allosteric interactions.
DISCLOSURE
The costs of publication of this article were defrayed in part by the payment of page charges. Therefore, and solely to indicate this fact, this article is hereby marked “advertisement” in accordance with 18 USC section 1734. No potential conflict of interest relevant to this article was reported.
Footnotes
Published online Jan. 16, 2014.
- © 2014 by the Society of Nuclear Medicine and Molecular Imaging, Inc.
REFERENCES
- Received for publication August 1, 2013.
- Accepted for publication October 17, 2013.


