


Abstract
Longitudinal studies in nondemented Parkinson disease (PD) subjects offer an opportunity to study the earliest regional cerebral subcortical and cortical metabolic changes underlying incident dementia in this disorder. Methods: Twenty-three PD subjects without dementia (Hoehn and Yahr stages I–III; age, 61.8 ± 9.7 y; Mini-Mental State Examination, 28.0 ± 1.4) and 27 controls (age, 59.8 ± 11.5 y) underwent 18F-FDG PET at study entry. PD subjects underwent yearly clinical assessment to determine conversion to dementia. The mean duration of follow-up was 3.9 ± 1.2 y (range, 2.0–6.8 y). Follow-up 18F-FDG PET was available in a subset of subjects at 2 or more years. Both volume-of-interest and 3-dimensional stereotactic surface projection (3D-SSP) analyses were performed. Results: Six subjects became demented (PDD), with a mean time of 3.8 ± 1.7 y (range, 1.9–6.0 y) to development of dementia. Mean duration of disease before onset of dementia was 9.7 ± 4.2 y (range, 3.1–14 y). There were significant metabolic reductions in the occipital (−11.8% vs. controls, F(2,22) = 7.0, P = 0.002) and posterior cingulate (−12.1% vs. controls, F(2,22) = 5.2, P = 0.009) cortices in PDD subjects at baseline, before diagnosis of dementia, compared with controls. Metabolism was most diminished in the visual association cortex (Brodmann area [BA] 18; −20.0% vs. control, F(2,22) = 8.45, P = 0.0007) of PDD subjects. There was mild hypometabolism in the caudate nucleus (−8.4% vs. control, F(2,22) = 3.2, P < 0.05). There was no significant hypometabolism in the temporal or frontal lobes. PD subjects who did not become demented (non-PDD), compared with controls, had reduced cerebral metabolism in the primary occipital cortex (BA 17) that was revealed only by 3D-SSP analysis. Follow-up scans in 5 PDD subjects at 2 y after study entry demonstrated a significant interval within-subject change in the thalamus (−11.4%), posterior cingulate (−9%), occipital (−7%), parietal (−7%), and frontal cortices (−7%) and mild reductions in the temporal cortex (−5%) and hippocampus (−3%), compared with study entry scans. Conclusion: Incident dementia in idiopathic PD is heralded by decreased metabolism in the visual association (BA 18) and posterior cingulate cortices, with mild involvement also of the caudate nucleus. Two-year follow-up data from 5 PDD converters show that progression to dementia is associated with mixed subcortical and cortical changes that involve the mesiofrontal lobes also. These findings provide insights into early metabolic features of parkinsonian dementia.
Impaired cognition is a frequent finding in individuals with Parkinson disease (PD), and ultimately more than 75% of PD patients will become demented (PDD) (1). Reported pathologic changes in PDD include cortical involvement as evidenced by the presence of Lewy body or Alzheimer pathology and subcortical changes, including dopaminergic nigrostriatal neuron degeneration, locus ceruleus neuron loss, and loss of cholinergic neurons in the nucleus basalis of Meynert and pedunculopontine nucleus (2). Cerebral metabolic changes are known to occur in advance of clinically manifest dementia in Alzheimer disease (AD). Using 18F-FDG PET, Minoshima et al. first reported decreased glucose metabolism of the posterior cingulate cortex in Alzheimer disease (AD) (3). Reduced metabolism of the posterior cingulate and cinguloparietal transitional area is observed also in subjects with isolated forgetfulness, before a clinical diagnosis of probable AD can be made, and also in clinically normal individuals homozygous for the apolipoprotein E e4 allele (4). Posterior cingulate hypometabolism is present in subjects with PDD (5), but it is unclear whether posterior cingulate or subcortical hypometabolism may herald the onset of dementia in PD.
Longitudinal studies in nondemented PD (non-PDD) subjects offer an opportunity to study the metabolic pattern of incident dementia. These studies also provide precious opportunities to study the early stage of dementia in Lewy body disease including PDD and dementia with Lewy bodies (DLB), the second most common neurodegenerative dementia among elderly people (6). In this prospective cohort study, we evaluated subcortical and cortical metabolic changes in PD subjects who developed incident PDD. 18F-FDG PET was obtained for each subject at the entry to the study. We hypothesized that PDD subjects subsequently would have lower regional (particularly, posterior cingulate cortex and parietal association) cortical glucose metabolic activity at baseline than non-PDD subjects and controls. We also analyzed the interval metabolic changes between baseline and follow-up scans in a subset of PDD converters. A single subject with incident dementia had four 18F-FDG PET scans performed during a period of 5 y.
MATERIALS AND METHODS
Subjects
This prospective cohort study involved 50 subjects (23 PD subjects and 27 controls). PD subjects had a mean age of 61.8 ± 9.7 y (range, 43−79 y; 17 men, 6 women). At study entry (7), 9 subjects were at Hoehn and Yahr stage I, 12 stage II, and 2 stage III, and all were receiving levodopa treatment. Subjects underwent neuropsychologic testing for assessment of dementia at baseline and at subsequent yearly intervals. Subjects were considered demented if they met the research criteria established for the diagnosis in this population by board-certified neurologists in consensus with a neuropsychologist on the basis of criteria from the Diagnostic and Statistical Manual of Mental Disorders and the National Institute of Neurological and Communicative Disorders and Stroke–Alzheimers Disease and Related Disorders Association, which reflect a global decline in cognition and impairments in sociooccupational functioning (8,9). A minimum follow-up period of 2 y was required for inclusion in the study. PD subjects had a mean Mini-Mental State Examination (MMSE) score of 28.0 ± 1.4 (range, 24–30) at study entry (10). Demographic information collected included age, duration of education, and age of onset of PD symptoms. Duration of PD was calculated using the subject's age at which motor symptoms began.
Twenty-seven age-comparable controls (age, 59.8 ± 11.5 y; range, 41–84 y; 12 men, 15 women) without a history of neurologic, psychiatric, or major medical diseases were also included in the study (MMSE, 28.1 ± 1.1; range, 26–30). Results of the neurologic examinations were confirmed as normal on the day of PET. Controls did not undergo follow-up assessments.
Clinical Assessment
Clinical assessment and a brief neuropsychologic screening battery were used at yearly intervals to determine cognitive and dementia status in the PD subjects. The cognitive measures included verbal fluency (VF) (11), Wechsler Adult Intelligence Scale III Picture Arrangement subtest (PARR) (12), Benton Visual Retention Test Revised (BVRT) (11), and Wechsler Memory Scale III Visual Reproduction subtest (WMS VI, immediate learning, and WMS VI-PREC, percentage delayed recall) (13).
PET Cerebral Glucose Metabolic Imaging
PET images were obtained using an ECAT-931 scanner (model 931/08-12; Siemens Medical Systems, Inc.) for 63 scans (37 for PD subjects and 26 for controls) or an ECAT EXACT scanner (CTI) for 16 scans (15 for PD subjects and 1 for a control). A transmission scan was obtained using a 68Ga/68Ge pin source for attenuation correction. Emission scans were acquired in 2-dimensional mode, with a total axial field of view of either 10.5 cm (ECAT-931) or 16.2 cm (ECAT EXACT). PET studies were performed with the subjects under resting conditions, with eyes open and ears unplugged, lying comfortably in a dimly lit and quiet room. All subjects fasted for at least 4 h before PET. Thirty minutes after injection of 18F-FDG (370 MBq), a sequence of three 10-min frames was acquired and later summated into a single frame. Images were reconstructed by filtered backprojection with a Hanning filter (cutoff frequency at 0.5 cycles per projection element) for both scanners. The dimensions of the reconstructed PET images were 128 × 128, with a pixel size of 1.99 × 1.99 mm and an interslice distance of 3.375 mm.
Data Analysis
The quantitative parametric images were transformed to the bicommissural stereotactic coordinate system using a method described previously (14,15). Differences in individual brain sizes were removed by linear scaling, and regional anatomic differences were minimized by a nonlinear warping technique (15). Subsequently, gray matter activities were extracted to a standard set of pixels covering the entire brain surface using 3-dimensional stereotactic surface projections (3D-SSP) (16). This cortical data extraction technique compensates for small anatomic differences in gray matter structures (such as variable depth of gyri) across subjects and minimizes partial-volume artifacts and effects of atrophy.
Because 18F-FDG PET data were obtained on 2 different scanners, the primary analysis was based on volume-of-interest (VOI) analysis and complemented by pixel-by-pixel analysis using the 3D-SSP technique (16). Images were reconstructed with slightly different filters for each scanner to make the final reconstructed image resolution as similar as possible or the same. Furthermore, these analysis approaches are quite insensitive to differences in resolution, sensitivity, and scatter between the 931 and EXACT tomographs. The regional cerebral metabolic rate of glucose consumption was analyzed with stereotactically defined cortical and subcortical VOIs (16). Predefined cortical VOIs included the following Brodmann areas (BA) predefined in a standard stereotactic atlas: lateral parietal association cortex (BA 5, 7, 39, and 40), lateral temporal association cortex (BA 21, 22, 37, and 38), lateral frontal association cortex (BA 6, 8, 9, 10, 11, 44, 45, 46, and 47), occipital cortex (BA 17, 18, and 19), primary sensorimotor cortex (BA 1, 2, 3, and 4), posterior cingulate cortex (BA 23 and 31), and anterior cingulate cortex (BA 24 and 32) (14). VOIs were also defined for the striatum, thalamus, amygdala, and hippocampus. Data were normalized to the pons as previously described (17). The PD subject data were also compared with the normal data on a pixel-by-pixel basis. Two sample t statistic values were calculated for each pixel and then converted to corresponding z values. Resultant images were displayed in 3 dimensions.
Age- and education-adjusted ANCOVA was used to compare baseline cognitive performance between the PDD and non-PDD groups. Age-adjusted ANCOVA with Duncan post hoc testing was used to determine differences in regional glucose cerebral metabolic activity among PDD subjects, non-PDD subjects, and controls. Paired t testing was used to assess 2-y interval changes in a subset of 5 PDD subjects who completed 2-y follow-up 18F-FDG PET. Stepwise multiple-regression analysis was used for a post hoc analysis of cognitive PET relationships for psychometric data obtained at study entry.
RESULTS
Clinical Results
The mean duration of follow-up was 3.9 ± 1.2 y (range, 2.0–6.8 y) between study entry and final cognitive evaluation. Six subjects were diagnosed with dementia at follow-up (PDD). The mean baseline MMSE score in the PDD subjects was 27.0 ± 0.9 (range, 26–28). The mean time to develop dementia after study entry was 3.8 ± 1.7 y (range, 1.9–6.0 y). There was no difference in mean symptomatic disease duration at study entry between PDD subjects and those who remained free of dementia at follow-up (non-PDD) (5.9 ± 2.9 vs. 6.2 ± 2.8 y, respectively). The mean duration of motor disease before onset of dementia was 9.7 ± 4.2 y (range, 3.1–14.0 y). As expected, PDD subjects were older than non-PDD subjects at entry: 72.2 ± 5.6 versus 58.2 ± 8.1 y, respectively (t = 3.9; P = 0.0009). Cognitive test scores at the time of study entry in the PDD and non-PDD groups are presented in Table 1. Allowing for differences in age and education, there were no significant differences in cognitive performance between the PDD and non-PDD groups, except for lower performance in delayed visual reproduction learning (WMS VI-PREC) in the PDD subjects.
Cognitive Test Scores at Time of Study Entry
Table 2 lists the average MMSE scores at years 1–4 in the PDD and non-PDD groups. MMSE scores become significantly lower in the PDD subjects in years 3 and 4 than in the non-PDD group. Scores in the non-PDD group remained stable over time.
Average (SD) Follow-up MMSE Scores
Glucose Metabolic Findings at Study Entry in Prospective PDD Converters Versus Nonconverters
ANCOVA (using subject age) of the 18F-FDG PET VOI data from baseline scans demonstrated regional cerebral metabolic reductions in the PDD converters, compared with control and non-PDD groups (Table 3). Compared with controls, PDD subjects had significant metabolic reductions in the occipital (−11.8%, F(2,22) = 7.0, P = 0.002) and posterior cingulate (−12.1%, F(2,22) = 5.2, P = 0.009) cortices. Regional hypometabolism was greatest in BA 18 (−20.0%, F(2,22) = 8.45, P = 0.0007), followed by BA 17 (−13.3%, F(2,22) = 4.0, P = 0.003). Less prominent reductions were present in BA 19 (−9.3%, F(2,22) = 4.0, P = 0.02). There was mild hypometabolism of the caudate nucleus (−8.4%, F(2,22) = 3.2, P < 0.05). There was no significant hypometabolism in the parietal, temporal, or frontal cortices; hippocampus; amygdala; putamen; or thalamus of PDD versus non-PDD or control groups.
Baseline Cerebral Glucose Metabolism in Controls, PDD Group, and non-PDD Group
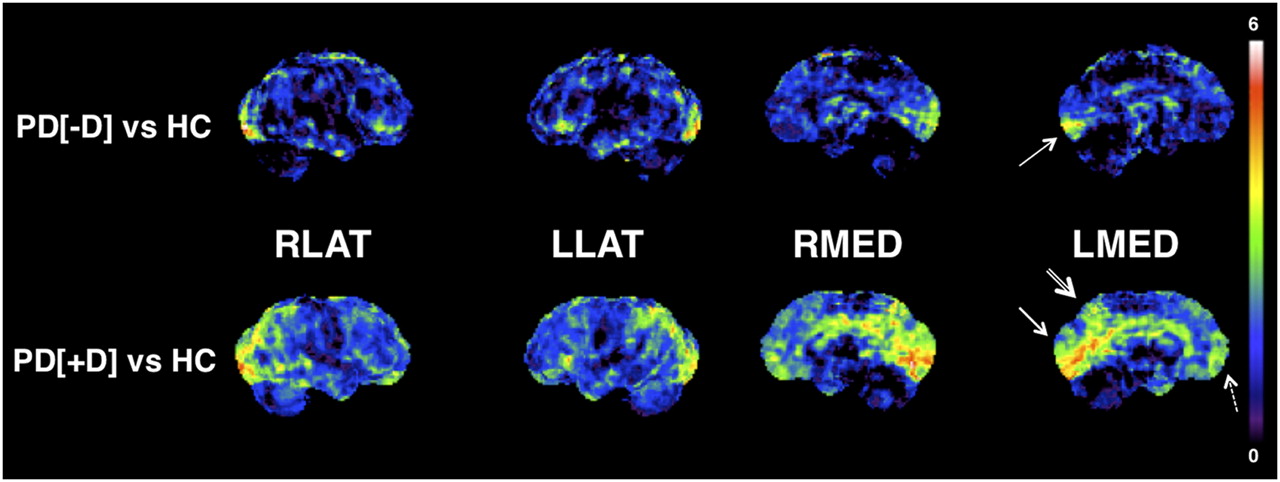
The spatial extent and regional magnitudes of cerebral cortical metabolic differences between PDD and non-PDD subjects at study entry were confirmed by 3D-SSP analysis (Fig. 1). Although the PET VOI analysis did not demonstrate significant reductions in the non-PDD subjects, compared with the control subjects, 3D-SSP analysis demonstrated isolated metabolic reductions in the more posterior aspect of the primary occipital cortex (BA 17). However, there was metabolic sparing of the occipital association cortex (BA 18 and 19; Fig. 1).

Metabolic reduction in PD. 3D-SSP t statistic maps comparing PDD and non-PDD subjects with controls at baseline. 18F-FDG PET data are normalized within each subject to the pons. The most prominent metabolic reduction in PDD is evident in cuneus (especially BA 18; single-lined arrow) and precuneus (double-lined arrow). Mild-to-moderate reductions are also present in mesiofrontal lobes (stipple-lined arrow). In addition, PDD subjects demonstrate relative sparing of primary sensorimotor cortex, a pattern similar to AD. In non-PDD subjects, metabolic reduction in posterior calcarine cortex (BA 17) is evident (arrow), whereas there is relative sparing of BA 18 and 19 and precuneus. LLAT = left lateral; LMED = left medial; PD[+]D = PDD; PD[-]D = non-PDD; RLAT = right lateral; RMED = right medial.
Interval Changes in Glucose Metabolic Findings at 2-Year Follow-up, Compared with Study Entry
VOI analysis of the 2-y follow-up scans in 5 PDD subjects demonstrated significant year 2 versus baseline within-subject interval changes in nearly all brain regions, with the exceptions of the primary sensorimotor cortex, anterior cingulate cortex, and amygdala (Table 4). Interval metabolic reductions in the PDD subjects were most prominent in the thalamus (−11.4%, t = 5.25, P = 0.006), with moderate reductions in the posterior cingulate, occipital, parietal, and frontal cortices and mild reductions in the temporal lobes (Table 4). Occipital cortical subregion analysis again demonstrated the most significant reductions in BA 18 (−7.7%, t = −8.3, P = 0.001) and BA 17 (−7.6%, t = −7.4, P = 0.002) and less reduction in BA 19 (−5.7%, t = −4.7, P = 0.009).
Changes in Regional Cerebral Glucose Metabolism Between Baseline and 2-Year Follow-up Imaging in PDD Converters (Within-Subject Analysis)
The spatial extent and regional magnitudes of cerebral cortical metabolic differences between PDD and controls at baseline and 2-y follow-up imaging were confirmed by pixel-by-pixel 3D-SSP analysis (Fig. 2). The most prominent metabolic reduction in PDD was evident in the cuneus and precuneus. Within the frontal lobes, relative regional metabolic reductions were more prominent in the mesiofrontal cortex (Fig. 2). In addition, the PDD subjects demonstrated relative sparing of the primary sensorimotor cortex, a pattern similar to other neurodegenerative diseases such as AD.

Progressive metabolic reduction in PDD. 3D-SSP t statistic maps comparing PDD converters (n = 5) with controls at baseline (t1) and 2-y follow-up imaging (t2). 18F-FDG PET data are normalized within each subject to pons. There is progressive metabolic decline in cuneus and precuneus and more widespread cortical hypometabolism including mesiofrontal lobes in follow-up 18F-FDG PET. LLAT = left lateral; LMED = left medial; PD[+]D = PDD; PD[-]D = non-PDD; RLAT = right lateral; RMED = right medial.
Cognitive PET Analysis
Stepwise multiple-regression analysis was used to evaluate the relationship between cerebral metabolic activity in the posterior cingulate, BA 18, and the dorsal caudate nucleus from the baseline 18F-FDG PET study in the PD subjects (n = 23) and several cognitive tests obtained at study entry that were available for analysis: VF, PARR, BVRT, WMS VI, and WMS VI-PREC. Stepwise regression analysis for the posterior cingulate cortex demonstrated a significant model effect for the WMS VI-PREC variable (R2 = 0.31, F(1,21) = 9.2, P = 0.007), with a nonsignificant regressor effect for the BVRT variable (R2 = 0.10, F(1,21) = 3.2, P = 0.08). Stepwise regression analysis for BA 18 demonstrated a significant model effect only for the BVRT variable (R2 = 0.43, F(1,21) = 14.9, P = 0.001), with no other significant regressors in the model. Stepwise regression analysis for the dorsal caudate nucleus demonstrated a significant model effect only for the WMS VI variable (R2 = 0.31, F(1,21) = 9.0, P = 0.007), with no other significant regressors in the model.
Case Studies of Subjects with 3 and 4 Longitudinal 18F-FDG PET Studies
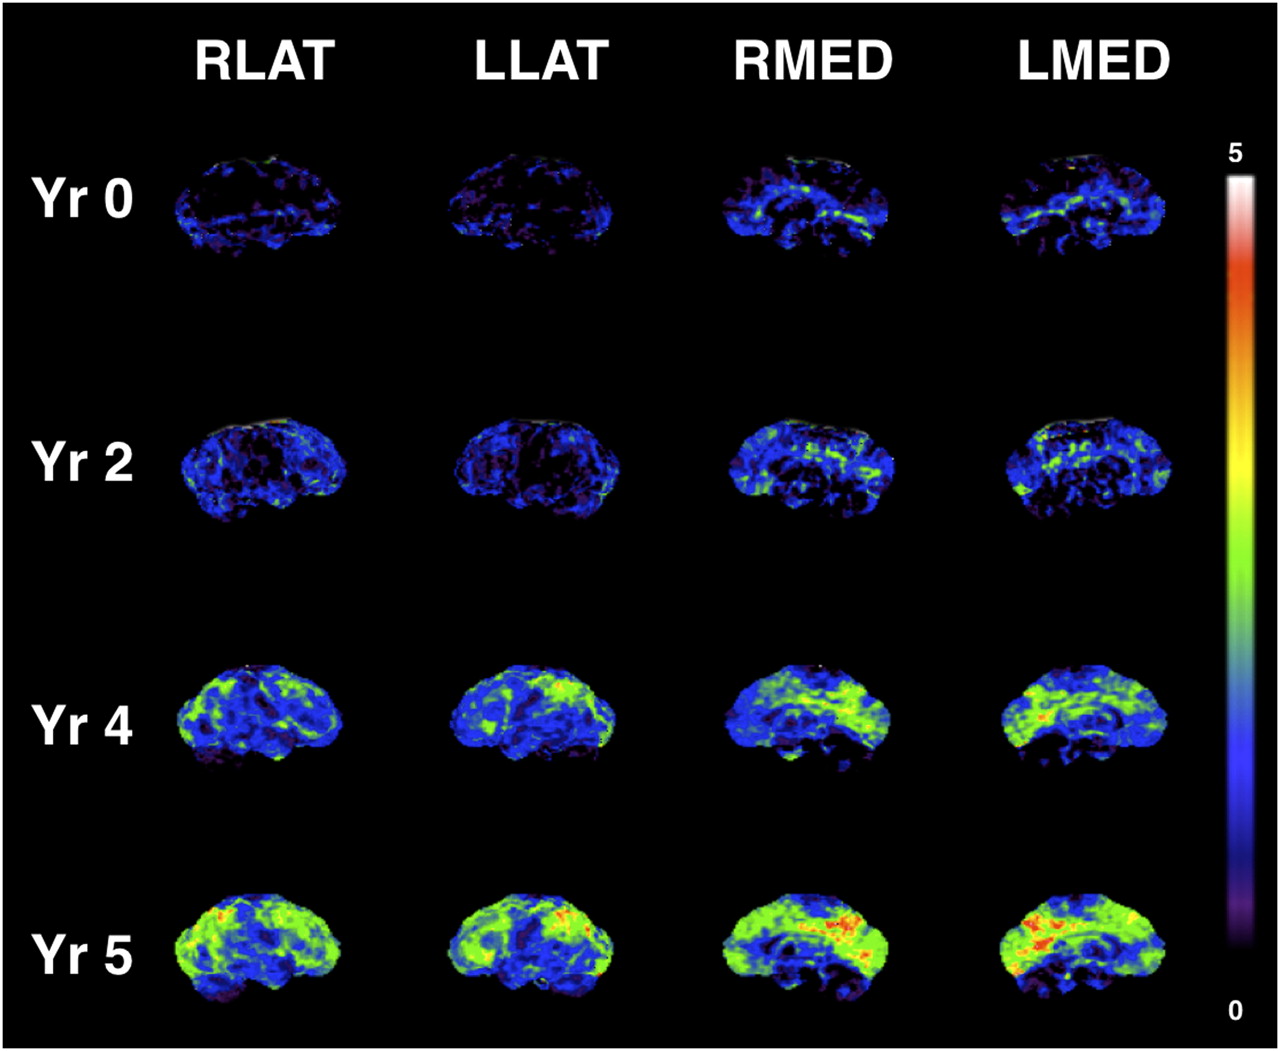
Interval changes between scans of years 2 and 4 in 2 PDD subjects and years 2, 4, and 5 in 1 PDD subject using multiple 18F-FDG PET scans demonstrated the most prominent changes in the subcortical structures and in the occipital, cuneus, parietal, and frontal cortices. Progressive metabolic changes from a cognitively grossly normal state to mild cognitive impairment and progressive dementia in a single subject with four 18F-FDG PET scans over a 5-y interval are illustrated in Figure 3. This subject became clinically demented at 5 y after study entry (i.e., at the time of the fourth PET scan). Evolving progressive reductions in the cuneus and precuneus occur before less severe, but more widespread, neocortical reductions. Sparing of the primary sensorimotor cortical strip is present (Fig. 3).

Progressive metabolic reduction from within reference range at baseline (Yr 0), through stages of mild cognitive impairment (Yr 2 and Yr 4), and clinical diagnosis of dementia (Yr 5) in PDD converter. 3D-SSP t statistic maps comparing single PDD converter to controls with 18F-FDG PET data normalized to pons. Progressive metabolic reductions in cuneus and precuneus occur before less severe, but more widespread, cortical reductions. Sparing of primary sensorimotor cortical strip is present. LLAT = left lateral; LMED = left medial; RLAT = right lateral; RMED = right medial; Yr = year.
DISCUSSION
Our findings indicate that incident dementia in idiopathic PD is heralded by metabolic changes within visual association (BA 18) and posterior cingulate cortices. Although hypometabolism of the cuneus and precuneus remained prominent, progression of dementia was associated with mixed subcortical (especially thalamic) and widespread cortical changes that also involve the mesiofrontal lobes. On follow-up imaging, PDD subjects demonstrated relative sparing of the primary sensorimotor cortex, a pattern similar to other neurodegenerative dementias such as AD. The anterior cingulate cortex, which has connections and behavioral attributes distinct from those of the posterior cingulate cortex, was relatively spared. Cuneus hypometabolism was observed first in parkinsonian dementia by Kuhl et al. in 1985 (18). In subsequent studies of severely affected PDD subjects, glucose metabolic and regional cerebral blood flow studies demonstrated reduced activity in the parietal and temporal neocortices, similar to that seen in AD (19,20). Vander Borght et al., for example, compared metabolic differences between AD and PDD subjects matched for severity of dementia (mean MMSE scores of 18 in both groups) and found similar glucose metabolic reductions globally and regionally, involving the posterior cingulate, lateral parietal, lateral frontal, and lateral temporal association cortices when compared with controls (5). PDD subjects, however, exhibited greater metabolic reductions in the occipital cortex and relatively preserved metabolism in the medial temporal lobe. In the present study, we followed subjects converting from mild cognitive impairment to dementia and found less prominent reductions in the lateral parietotemporal cortices, compared with metabolic changes seen typically in subjects with mild cognitive impairment at the time of conversion to clinical dementia of the AD type (21). Cuneus involvement as a herald of dementia may, thus, be specific for PDD. Our present findings indicate that incident dementia preferentially involves BA 18 (visual association cortex), whereas reductions in the primary visual cortex (BA 17) can be seen in PD without dementia (22). Extension of occipital hypometabolism from the primary to the visual association cortices, together with precuneus hypometabolism, may be the early cortical metabolic signature of incident dementia in PD. The involvement of the cuneus is distinct from findings in longitudinal 18F-FDG PET in AD. For example, Mosconi et al. reported the first clinicopathologic series of longitudinal 18F-FDG PET scans in postmortem elderly subjects who were verified to be cognitively normal and were followed to the onset of AD (23). The 18F-FDG PET scans indicated a progression of glucose metabolic deficits from the hippocampus to the parietotemporal and posterior cingulate cortices but sparing the cuneus. One AD subject had combined AD and diffuse Lewy body disease at postmortem examination, and her last 18F-FDG PET examination showed occipital and parietotemporal hypometabolism.
Visual association cortex hypometabolism as a herald of dementia is interesting in view of the prominence of visual hallucinations in more advanced PD and PDD. Prior metabolic imaging studies suggest that visual hallucinations are associated with hypometabolism of visual association cortices (24). Visual hallucinations are by far the most common form of hallucination in PD, and incidence of visual hallucinations in PD may herald progression of dementia (25).
PDD may be a diverse entity, although pathologically, DLB likely accounts for many cases of PDD (6). A generally accepted distinction in current international consensus diagnostic criteria is between subjects presenting with parkinsonism for at least 1 y before the onset of dementia (PDD) and those developing parkinsonism and dementia concurrently or with dementia in advance of parkinsonism (DLB) (6). We do not have autopsy diagnosis available for our PDD subjects; but following the 1-y rule, our PDD subjects would not be categorized as DLB. However, recent β-amyloid and postmortem literature indicates significant overlap between subjects clinically diagnosed as either PDD or DLB (26). Cuneus hypometabolism is also a common metabolic feature of both DLB and PDD (27), and it is plausible that some of our findings may reflect a predementia stage of DLB in clinically diagnosed PDD subjects.
Prior resting cerebral glucose metabolic and blood flow studies in mild, early PD showed increased striatal activity contralateral to the clinically most affected body side, possibly representing a compensatory mechanism within the striatum (28). Striatal glucose metabolism may then decrease with advancing disease, especially in subjects with PDD (5). Interval changes in striatal metabolism or perfusion are more difficult to interpret because of early compensatory changes related to motor impairments in PD and possible effects of dopaminergic medications. Our data suggest that the most prominent early metabolic changes in incident dementia in PD occur at the posterior and medial neocortical levels and that mild caudate hypometabolism is also present. Progression of dementia is associated with mixed subcortical and diffuse neocortical changes that involve the mesiofrontal cortices. The involvement of mesiofrontal regions in our PDD subjects may potentially reflect effects of dopaminergic nigrostriatal denervation, including the caudate nucleus, and dopaminergic mesocortical pathways (29). Posterior cortical activity changes may reflect cholinergic denervation secondary to loss of nucleus basalis of Meynert afferents. The cuneus is thought to be the most vulnerable region to cholinergic deafferentation because there is more severe loss of cholinergic projections to the cuneus than to any other cortical region (30,31). Recently, Shimada et al. also made an important observation of significant reductions in cortical acetylcholinesterase activity in early drug-naïve PD subjects. These authors found most prominent cholinergic reductions in the medial occipital association visual cortex (BA 18) (32). The observed anterior and posterior cerebral metabolic changes may in part correspond to mixed effects of dopaminergic and cholinergic denervation in PDD (31).
Analysis of cognitive test results obtained at the time of study entry demonstrates regionally specific correlations with 18F-FDG PET changes. The Benton Visual Retention Test, which assesses visuospatial perception, visuomotor and visuoconstructive abilities, and visual memory, best correlates with BA 18 metabolism. Immediate recall on the Wechsler Memory Scale III Visual Reproduction Learning best correlated with glucose metabolism in the dorsal caudate nucleus. In contrast, delayed recall on this test had the most robust correlation with glucose metabolic activity in the posterior cingulate cortex. This finding may reflect the cognitive difference in visual delayed recall between the PDD and non-PDD subjects at the time of study entry. In this respect, functions of working memory may be more related to the caudate nucleus and its connections, and delayed memory recall may be more related to the posterior cingulate and its mesial temporal lobe connections. This may correspond to data from animal studies showing that posterior cingulate cortical lesions lead to specific learning impairment in the later stages of data acquisition (33). Our preliminary data indicate that specific brain regions that are affected in incident dementia in PD may have differential contributions to the cognitive profile in these subjects.
CONCLUSION
The results of this prospective cohort study demonstrate that incident dementia in idiopathic PD is heralded by hypometabolism in visual association (BA 18) and posterior cingulate cortices, with additional mild reduction in the caudate nucleus. Although hypometabolism in the cuneus and precuneus remain prominent, 2-y follow-up data from 5 PDD converters show that progression of PD dementia is associated with mixed subcortical, especially thalamic, and cortical changes that also involve the mesiofrontal lobes. These results suggest that visual association and posterior cingulate cortex metabolic changes may be a useful biomarker for enriching studies aimed at studying progression to dementia in PD.
DISCLOSURE STATEMENT
The costs of publication of this article were defrayed in part by the payment of page charges. Therefore, and solely to indicate this fact, this article is hereby marked “advertisement” in accordance with 18 USC section 1734.
Acknowledgments
We thank UM PET technologists for their skillful performance in data acquisition and cyclotron operators and chemists for their production of 18F-FDG. This study was supported by National Institutes of Health grants RO1 NS24896, AG08671, and P01 NS015655.
- © 2011 by Society of Nuclear Medicine
REFERENCES
- Received for publication March 11, 2011.
- Accepted for publication April 11, 2011.


Jump to section
Related Articles
Cited By...
- Visual dysfunction is a better predictor than retinal thickness for dementia in Parkinsons disease
- Visual dysfunction is a better predictor than retinal thickness for dementia in Parkinsons disease
- Brain Metabolism Related to Mild Cognitive Impairment and Phenoconversion in Patients With Isolated REM Sleep Behavior Disorder
- Combined Metabolic Activators Improve Cognitive Functions without Altering Motor Scores in Parkinsons Disease
- Factor analysis-derived cognitive profile predicting early dementia conversion in PD
- Cognitive correlates of cerebellar resting-state functional connectivity in Parkinson disease
- The Metabolic Pattern of Idiopathic REM Sleep Behavior Disorder Reflects Early-Stage Parkinson Disease
- Single-subject SPM FDG-PET patterns predict risk of dementia progression in Parkinson disease
- 18F-FDG PET in Parkinsonism: Differential Diagnosis and Evaluation of Cognitive Impairment
- Cerebral glucose metabolism and cognition in newly diagnosed Parkinson's disease: ICICLE-PD study
- Metabolic Imaging in Parkinson Disease
- 18F-FDG PET Is an Early Predictor of Overall Survival in Suspected Atypical Parkinsonism
- Resting-state fMRI sheds light on neural substrates of cognitive decline in Parkinson disease
- PET Approaches for Diagnosis of Dementia
- Exploratory analysis of neuropsychological and neuroanatomical correlates of progressive mild cognitive impairment in Parkinson's disease
- Progressive changes in a recognition memory network in Parkinson's disease
- Functional brain imaging of cognitive dysfunction in Parkinson's disease
- [18F]FDG-PET is superior to [123I]IBZM-SPECT for the differential diagnosis of parkinsonism