


Abstract
Idiopathic REM sleep behavior disorder (iRBD) is considered a prodromal stage of Parkinson disease (PD) and other Lewy body disorders. Spatial covariance analysis of 18F-FDG PET data has disclosed a specific brain pattern of altered glucose metabolism in PD. In this study, we identify the metabolic pattern underlying iRBD and compare it with the known PD pattern. To understand the relevance of the iRBD pattern to disease progression, we studied the expression of the iRBD pattern in de novo PD patients. Methods: The iRBD-related pattern was identified in 18F-FDG PET scans of 21 patients with polysomnographically confirmed iRBD and 19 controls using spatial covariance analysis. Expression of the iRBD-related pattern was subsequently computed in 18F-FDG PET scans of 44 controls and 38 de novo, treatment-naïve PD patients. Of these 38 PD patients, 24 had probable REM sleep behavior disorder (RBD) according to the Mayo Sleep Questionnaire. Neuropsychologic evaluation showed mild cognitive impairment in 20 PD patients (PD-MCI), of whom 16 also had concomitant RBD and roughly half (11/20) had bilateral motor symptoms. Results: The iRBD-related pattern was characterized by relative hypermetabolism in the cerebellum, brain stem, thalamus, sensorimotor cortex, and hippocampus, and by relative hypometabolism in the middle cingulate, temporal, occipital, and parietal cortices. This topography partially overlapped with the PD-related pattern (PDRP). The iRBD-related pattern was significantly expressed in PD patients compared with controls (P < 0.0001). iRBD-related pattern expression was not significantly different between PD patients with and without probable RBD, or between PD patients with unilateral or bilateral parkinsonism. iRBD-related pattern (iRBDRP) expression was higher in PD-MCI patients than in PD patients with preserved cognition (P = 0.001). Subject scores on the iRBD-related pattern were highly correlated to subject scores on the PDRP (r = 0.94, P < 0.0001). Conclusion: Our results show that the iRBDRP is an early manifestation of the PDRP. Expression of both PDRP and iRBDRP was higher in patients with a more severe form of PD (PD-MCI), which indicates that expression of the 2 patterns increases with disease severity.
- Neurology
- PET/CT
- statistical
- analysis
- 18F-FDG-PET
- idiopathic REM
- sleep behavior disorder
- Parkinson’s disease related pattern
- α-synucleinopathy
- metabolic pattern
Most patients with idiopathic REM sleep behavior disorder (iRBD) will develop Parkinson disease (PD) or dementia with Lewy bodies (DLB) on long-term clinical follow-up (1–6). In such patients, REM sleep behavior disorder (RBD) indicates the presence of α-synuclein pathology in specific brain stem nuclei that regulate REM sleep (7). It is postulated that over time, the pathologic process spreads to other brain areas (8). When the substantia nigra is reached, the ensuing degeneration of the presynaptic dopaminergic system causes the typical motor features of the disease, at which point a PD diagnosis can be made (9,10). Patients with iRBD, by definition, have not yet developed motor symptoms, and provide a unique opportunity to study the early (prodromal) stages of a patient subgroup with α-synucleinopathy (9).
The clinical manifestations of PD are caused by functional changes in multiple neuronal networks, reflected by a typical pattern of abnormal glucose utilization in specific brain regions on 18F-FDG PET, referred to as the PD-related pattern (PDRP). The PDRP is characterized by relatively increased metabolism in the thalamus, globus pallidus/putamen, cerebellum, and pons and by relative hypometabolism in the occipital, temporal, parietal and frontal cortices. The PDRP has been consistently identified in several PD populations using spatial covariance analysis (i.e., with the Scaled Subprofile Model and Principal Component Analysis [SSM/PCA]) (11–18). Expression of the PDRP can be quantified in new 18F-FDG PET scans (12), which can be used to investigate group differences and relationships with clinical characteristics.
PDRP expression was significantly higher in 18F-FDG PET scans of patients with iRBD, than in age-matched controls (19–21). Moreover, high baseline PDRP subject scores were associated with a higher risk of developing PD in the next 5 y (19).
Wu et al. investigated the metabolic topography of iRBD, applying SSM/PCA to the 18F-FDG PET data of 21 patients with iRBD and 21 age-matched controls (20). The iRBD-related pattern (iRBDRP) showed partial overlap with the PDRP. Interestingly, iRBDRP expression was high in patients with iRBD and in early-stage PD patients with unilateral parkinsonism (Hoehn and Yahr [H&Y] stage 1), but lower in more advanced PD patients (H&Y stage 2), suggesting that the iRBDRP contains altered metabolism in regions specific to the prodromal or early stages of PD.
PD patients with concomitant RBD are thought to have a rapidly progressive subtype of the disease with a higher risk of subsequent cognitive decline (22), underscoring the potential of the iRBDRP to provide insights into the evolution of functional changes in PD from its early stages. In this study, we provide a further identification of the iRBDRP in an independent 18F-FDG PET dataset of 21 iRBD patients and 19 controls. In addition, we study the relationship between the iRBDRP and disease severity by calculating expression of the newly identified iRBDRP in 38 carefully characterized, de novo, treatment-naïve PD patients. We compare iRBDRP expression not only between H&Y stages 1 and 2, but also between PD patients with and without probable RBD, and between PD patients with mild cognitive impairment (PD-MCI) and those with normal cognition (PD-NC).
MATERIALS AND METHODS
Participants
Twenty-one patients with iRBD and 19 age-matched controls (cohort A) were used for identification of the iRBDRP. Cohort B, consisting of 9 patients with iRBD and 13 age-matched controls, was used for validation. Clinical data of both cohorts are provided in Table 1. iRBD was confirmed by video-assisted polysomnography (21). Subjects in cohorts A and B underwent 18F-FDG PET on a Biograph mCT-64 PET/CT camera (Siemens) as described previously (21).
Demographic Data of Controls and iRBD Patients (Cohorts A and B)
From a previous study, we included 18F-FDG PET data from 44 healthy controls and 38 consecutive outpatients with de novo, drug-naïve PD (Table 2) (23). The Mayo Sleep Questionnaire (24) and a clinical interview by a sleep medicine expert were conducted on each patient. A diagnosis of “probable RBD” was made in 24 patients (PD-RBD+). The remaining 14 PD patients had no signs or symptoms of RBD (PD-RBD–). On the basis of neuropsychologic assessment, 20 PD patients were diagnosed with MCI, and 18 had normal cognition. Furthermore, 23 PD patients had unilateral motor symptoms (H&Y stage 1), and 15 had bilateral symptoms (H&Y stage 2). Disease duration was defined by the number of months patients had motor symptoms before the diagnosis.
Demographic Data of PD Patients and Corresponding Controls
The study was approved by the local Institutional Review Boards. Voluntary written informed consent was obtained from each subject after verbal and written explanation of the study, in accordance with the Declaration of Helsinki.
18F-FDG PET Data Preprocessing
All images were spatially normalized onto an 18F-FDG PET template in Montreal Neurologic Institute brain space (25) using SPM12 software (Wellcome Department of Imaging Neuroscience, Institute of Neurology), implemented in MATLAB (version 2012b; MathWorks).
iRBDRP Identification in Cohort A
The iRBDRP was identified by applying SSM/PCA to the 18F-FDG PET data of cohort A. In brief, after anatomic registration, images were masked to remove out-of-brain voxels and log-transformed, and subject and group means were removed, resulting in a residual profile for each scan. PCA was applied to these residual profiles in voxel space, and the components explaining the top 50% of the total variance were selected for further analysis. For each subject, a score was calculated on each selected principal component (PC). These scores were entered into a forward stepwise logistic regression analysis. The components that could best discriminate between controls and patients (26) were linearly combined to form 1 disease-related pattern (the iRBDRP). In this linear combination, each component was weighted by the coefficient resulting from the logistic regression model. All voxel weights in the iRBDRP were overlaid on a T1 MRI template in Montreal Neurologic Institute space for visualization.
IRBDRP Subject Scores in Cohort B
Anatomically registered images were masked and log-transformed, and subject and group means were removed to obtain a residual profile for each scan. The mask and group mean were based on cohort A in the iRBDRP identification process. The subject score was calculated by multiplying the residual profile of each subject with the pattern (12).
In cohort B, iRBDRP subject scores in controls and iRBD patients were z-transformed to cohort A controls (i.e., the reference; n = 19). iRBDRP z scores were compared between cohort B controls and patients with a Student t test. If significant, the iRBDRP was considered valid.
RBDRP Subject Scores in De Novo PD Patients
To account for differences in data acquisition, iRBDRP subject scores in the PD cohort were z-transformed to the subject scores of the corresponding 44 controls. For reference, we also calculated subject scores for the PDRP (16,21) in the 44 controls and 38 PD patients. Again, PDRP subject scores were z-transformed with reference to the 44 controls (supplemental materials [available at http://jnm.snmjournals.org]).
Stable Regions in iRBDRP
Voxel weights in SSM/PCA patterns can fluctuate to some degree depending on the specific sample of patients and controls that is used for derivation (27). This is especially relevant in the study of iRBD because it is a heterogeneous patient group. To investigate which regions in the iRBDRP were stable, we performed a bootstrap resampling (1,000 repetitions). Voxels that survived a 1-sided confidence interval threshold of 90% (percentile method) after bootstrapping were overlaid on a T1 MRI template. The (stable) regions in the iRBDRP were compared visually to stable regions in the PDRP.
Statistical Analysis
iRBDRP z scores were compared between cohort B controls and iRBD patients with an independent samples t test. iRBDRP z scores were also compared across controls, PD-RBD−, and PD-RBD+ groups with a 1-way ANOVA. Post hoc comparisons were Bonferroni-corrected. This analysis was repeated for the comparisons of H&Y stage 1 versus H&Y stage 2, and PD-NC versus PD-MCI.
In the 44 controls and 38 PD patients, the correlation between iRBDRP and PDRP subject z scores was tested for significance with a Pearson r correlation coefficient. In addition, a voxelwise correlation of the 2 patterns was performed with a Pearson r correlation coefficient.
RESULTS
iRBDRP Identification—Cohort A
After the application of SSM/PCA to cohort A, the first 10 PCs (explaining 49.8% of the variance) were used for further analysis. The iRBDRP was formed by a linear combination of PC4 and 5 (5.5% and 4.1% of variance, respectively), having approximately equal weights. All voxel weights in the iRBDRP contribute to the iRBDRP subject score (Fig. 1). Stable regions (90% confidence interval threshold after bootstrap resampling) are shown in Figure 2 and include relative hypermetabolism in cerebellum, brain stem, thalamus, sensorimotor cortex, and left hippocampus/parahippocampal gyrus and relative hypometabolism in middle cingulate, temporal, occipital, and parietal cortices.

Unthresholded iRBDRP overlaid on T1 MRI template. Red indicates positive voxel weights (relative hypermetabolism), and blue indicates negative voxel weights (relative hypometabolism). L = left. Coordinates in axial (Z) and sagittal (X) planes are in Montreal Neurologic Institute standard space.

Stable voxels (90% confidence interval not straddling zero after bootstrap resampling) of iRBDRP are visualized by overlaying them on T1 MRI template. Red indicates positive voxel weights (relative hypermetabolism), and blue indicates negative voxel weights (relative hypometabolism). L = left. Coordinates in axial (Z) and sagittal (X) planes are in Montreal Neurologic Institute standard space.
iRBDRP Subject Scores in Cohort B iRBD Patients and Controls
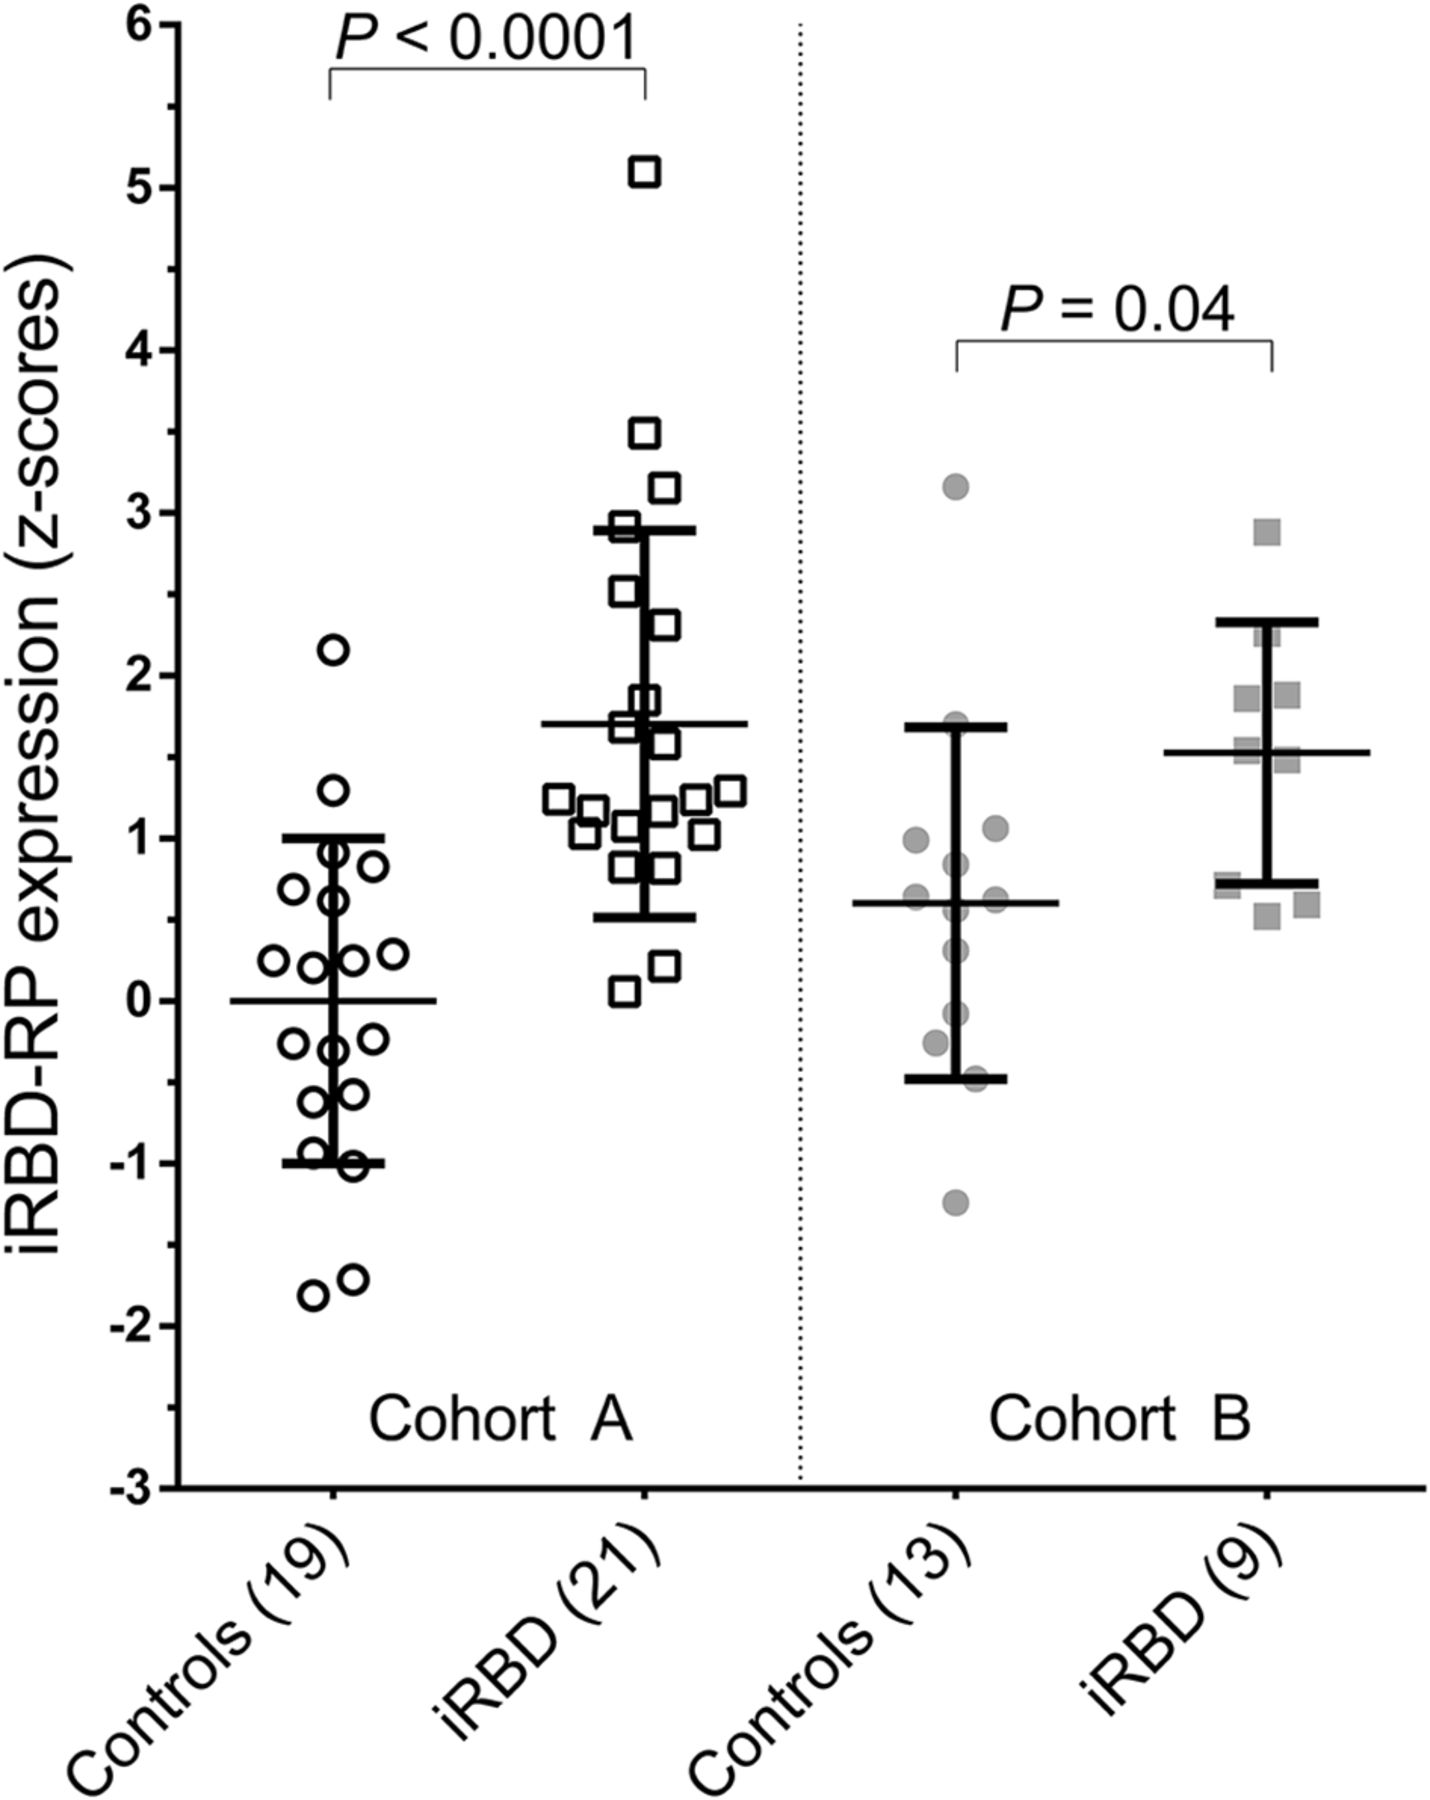
iRBDRP subject z scores were significantly different between controls (n = 13) and iRBD patients (n = 9) from cohort B (P = 0.04; Table 1; Fig. 3). iRBDRP subject scores in cohort B controls were not significantly different from subject scores in cohort A controls (P = 0.12). iRBDRP subject scores were also not significantly different between the 2 iRBD groups (P = 0.69).

iRBDRP subject scores in derivation cohort (A) and in validation cohort (B). Subject scores were z-transformed to cohort A controls and compared between groups with a Student t test.
iRBDRP Subject Scores in PD Patients
iRBDRP subject z scores were significantly higher in PD patients than in controls (P < 0.0001). iRBD z scores were higher in patients with H&Y stage 1 than H&Y stage 2 (Fig. 4A), although this difference was not significant (P = 0.26). iRBD z scores were also not significantly different between PD-RBD− and PD-RBD+ (Fig. 4C). However, iRBDRP z scores were significantly higher in PD-MCI patients than in PD-NC patients (Fig. 4B). Compared with the PD-NC group, the PD-MCI group was older and contained a larger proportion of patients with concomitant probable RBD and a larger proportion of patients with bilateral parkinsonism (Table 2).
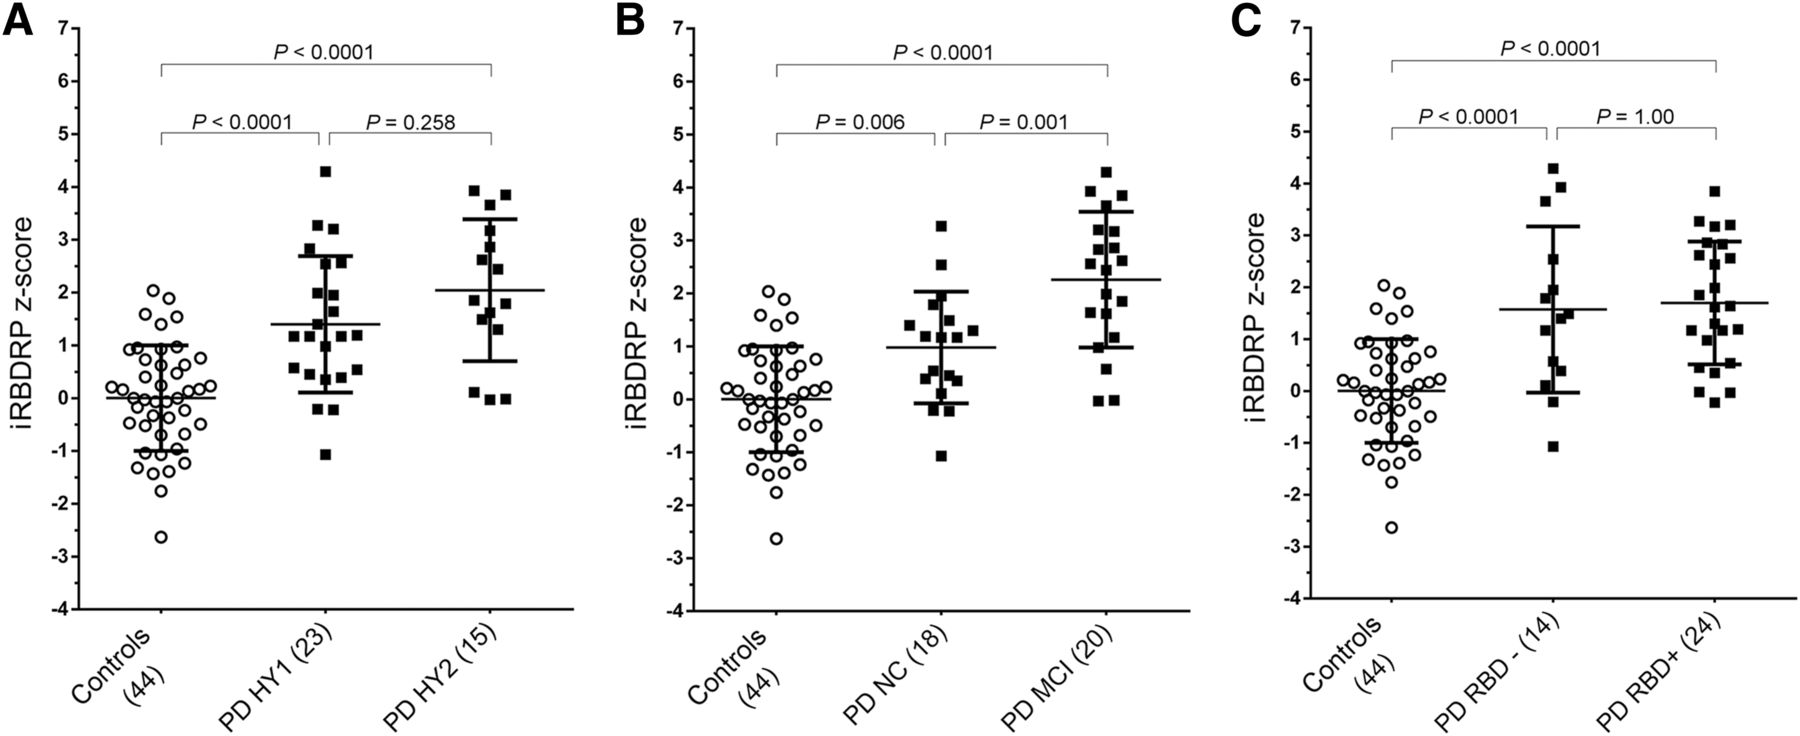
(A) IRBDRP subject scores were calculated in controls (n = 44), PD patients with H&Y stage 1 (n = 23), and PD patients with H&Y stage 2 (n = 15). Subject scores were z-transformed with reference to the 44 controls. IRBDRP z scores were compared across groups with 1-way ANOVA (F(81) = 22.4, P < 0.0001). IRBDRP z scores are significantly higher in PD patients than in controls, but not significantly different between H&Y stage 1 and H&Y stage 2 groups. (B) IRBDRP z scores were compared across controls, PD-NC, and PD-MCI with a 1-way ANOVA (F(81) = 30.2, P < 0.0001). (C) IRBDRP z scores were compared across controls, PD-RBD− (n = 14), and PD-RBD+ (n = 24) with a 1-way ANOVA (F(81) = 20.3, P < 0.0001). P values in post hoc group comparisons were Bonferroni-corrected.
Comparison with PDRP
PDRP z scores were also compared between the different PD subgroups and showed trends similar to the iRBDRP. Specifically, PDRP expression was not significantly different between PD-RBD− and PD-RBD+ (P = 1.00), but was significantly different between H&Y stage 1 and H&Y stage 2 PD patients (P = 0.024) and between PD-NC and PD-MCI (P = 0.004) (supplemental materials). Both PDRP and iRBDRP subject z scores correlated significantly to age in PD patients (r = 0.50; P < 0.005) but not in controls (r = 0.30; P > 0.05). Both PDRP and iRBDRP subject scores were not significantly correlated to disease duration in PD patients (r ≈0.02, P > 0.80).
Subjects’ iRBDRP and PDRP z scores were highly correlated (r = 0.94; P < 0.0001; controls and PD patients combined). In addition, voxel weights of the PDRP were correlated to the iRBDRP (r = 0.52). For reference, voxel weights of 2 PDRPs from independent populations (the PDRP used in this study (16) vs. the original North-American PDRP published by Eidelberg et al. (14)) have a stronger voxelwise correlation (r = 0.75).
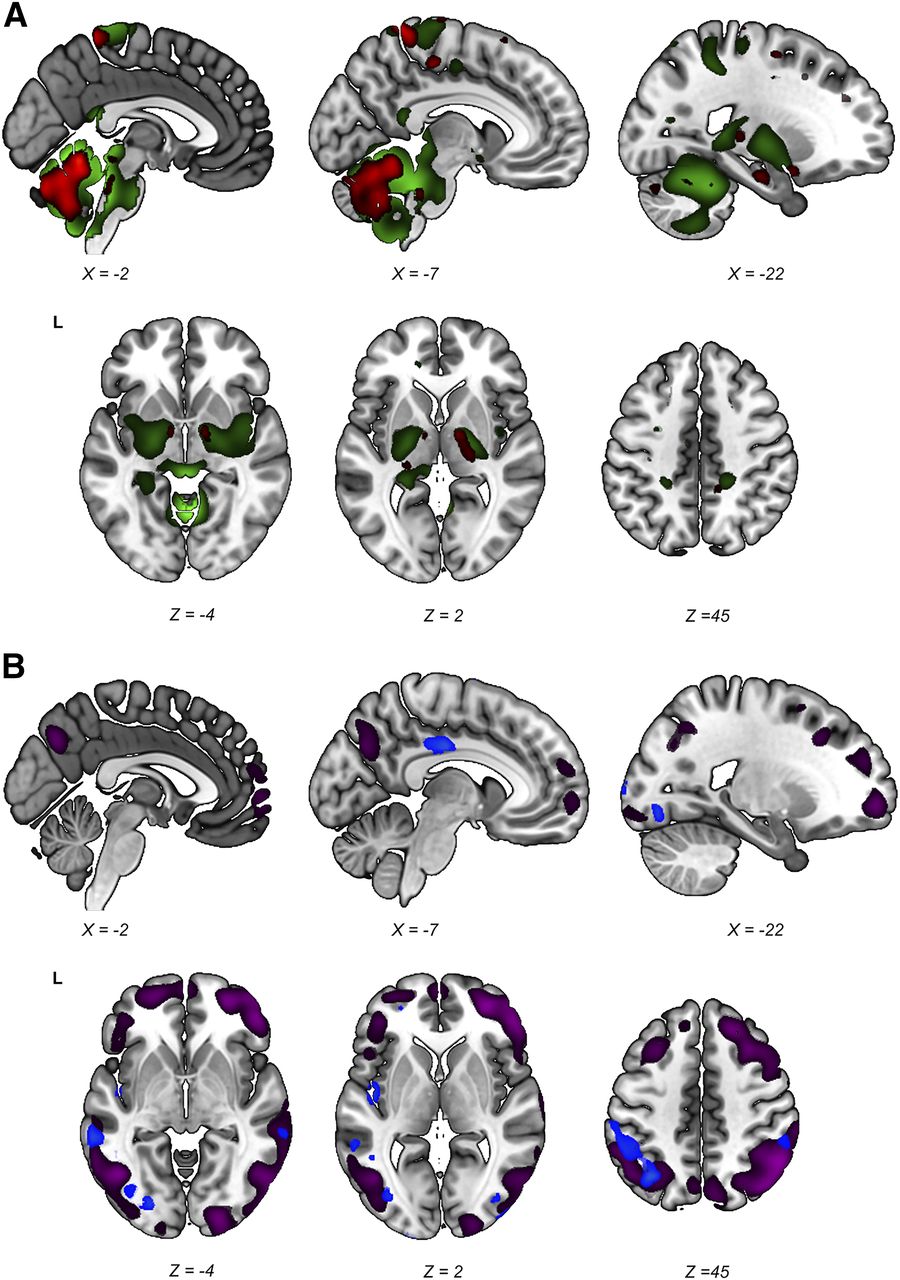
Stable regions (i.e., those surviving the 90% confidence interval threshold) in both the PDRP and the iRBDRP were overlaid on a T1 template. Figure 5A shows the relatively hypermetabolic stable regions of both patterns. Cerebellum, brain stem, thalamus, and sensorimotor cortex were hypermetabolic in both patterns. In contrast to the PDRP, putamen and pallidum did not show stable involvement in the iRBDRP. Stable hypometabolic regions (Fig. 5B) in the 2 patterns overlapped in parietal, temporal, and occipital cortices.

Stable regions in iRBDRP and PDRP overlap. Stable voxels (90% confidence interval not straddling zero after bootstrap resampling) of iRBDRP and PDRP are overlaid on T1 MRI template. (A) Stable, relatively hypermetabolic regions of PDRP (green) and iRBDRP (red). (B) Stable, relatively hypometabolic regions of PDRP (purple) and iRBDRP (blue). L = left. Coordinates in axial (Z) and sagittal (X) planes are in Montreal Neurologic Institute standard space.
DISCUSSION
We report the second identification of the iRBDRP in an independent cohort of iRBD patients. The iRBDRP identified in this study disclosed a symmetric topography, which was strikingly similar to the PDRP. Both patterns are characterized by relatively increased metabolism in cerebellum, brain stem, and thalamus and by decreased metabolism in occipital, temporal, and parietal cortices. Furthermore, iRBDRP and PDRP subject scores were highly correlated, and both patterns were significantly expressed in de novo PD patients compared with controls.
In contrast to the original iRBDRP study by Wu et al. (20), we report slightly higher (nonsignificant) iRBDRP z scores in patients with bilateral parkinsonism (H&Y stage 2) than in patients with unilateral parkinsonism (H&Y stage 1). Wu et al. found significantly lower iRBDRP z scores in H&Y stage 2 than H&Y stage 1 PD patients, and hypothesized that “the iRBDRP is perhaps relevant only for prodromal iRBD cases and likely breaks down with disease progression” (20). This original iRBDRP (20) was not as similar to the PDRP as our iRBDRP. For instance, the correlation coefficient between subject scores for the iRBDRP and the PDRP reported in that study (20) was r = 0.39, compared with r = 0.94 in the current study. Considering that our iRBDRP and PDRP showed considerable overlap, subject scores on the 2 patterns were highly correlated, and that PDRP expression in iRBD is associated with a higher risk of conversion to PD (19), we hypothesize that the iRBDRP represents an early PDRP pattern. In other words, we suggest that the PDRP and iRBDRP are part of the same spectrum and are both likely to increase with disease progression.
Interestingly, iRBDRP expression was not significantly higher in PD patients with probable RBD than in PD patients without RBD, suggesting that the iRBDRP is not strictly related to the presence of RBD in PD. In addition, both PDRP and iRBDRP expression were higher in PD-MCI than PD-NC. The PD-MCI group was older and contained a larger proportion of patients with bilateral parkinsonism, and most had probable RBD. This combination of features may signal a rapidly progressive subtype of PD (22,28). The fact that such more severely affected PD patients have higher subject scores on both the PDRP and the iRBDRP again suggests that both patterns are markers of severity of the same disease process.
However, some important differences between the iRBDRP and the PDRP were found. The PDRP is characterized by relative hypermetabolism of putamen and pallidum. Although putamen and pallidum were relatively hypermetabolic in the unthresholded iRBDRP, they did not survive our predefined threshold (bootstrap resampling), which indicates that these regions were not involved in each iRBD patient. Relatively increased putaminal metabolism is thought to be a functional response to loss of dopaminergic input beyond a certain threshold and is related to the onset of motor symptoms (29). In a previous study, we showed that 9 of our 21 iRBD patients (cohort A) had significant loss of dopamine transporter binding (21), indicating neurodegeneration of the presynaptic dopaminergic system (30,31). These 9 patients may have contributed to the relative hypermetabolism of putamen/pallidum in the unthresholded iRBDRP.
Furthermore, iRBDRP disclosed relative hypermetabolism of the dorsal aspect of the pons. Pontine hypermetabolism was more extensive in the PDRP. Nuclei that regulate REM sleep circuitry are located in the dorsal pons (32) and lie close to the noradrenergic locus coeruleus, cholinergic pedunculopontine nucleus, and serotonergic raphe nuclei. Although the spatial resolution of 18F-FDG PET images is not sufficient to discriminate between brain stem nuclei, we note that the clusters in the pons and mesencephalon (Fig. 2) overlap with the median raphe (33), locus coeruleus (34), and partially with the pedunculopontine nucleus (35,36). These nuclei are affected early on in PD, before degeneration of the dopaminergic system (8). All 3 systems project to cerebellum and thalamus (37–39). The pedunculopontine nucleus additionally projects to the basal ganglia and motor cortex (37), the locus coeruleus projects to the hippocampus and cortex (38), and the median raphe projects to the hippocampus and cingulate (39). All these regions were identified in the iRBDRP and PDRP. Although the underlying mechanism of relative pontine hyperactivity is unclear, it appears to be a consistent feature of iRBD (19,20,40) and PD (11–18).
Relative hippocampal hypermetabolism, another consistent finding in functional imaging studies in iRBD (20,41–43), reliably contributed to the iRBDRP, but not to the PDRP. Relative hyperperfusion of the hippocampus was associated with subsequen development of PD/DLB (n = 10) in a 3-y clinical follow-up study of 20 iRBD patients (40). Hypometabolism of the middle cingulate, associated with cognitive decline in longitudinal PD studies (44–47), appears to be a distinct feature of the iRBDRP, as it was not seen in the PDRP.
Both the original (20) and the current iRBDRP included relative hypermetabolism of the thalamus, hippocampus, and pons and relative hypometabolism of the temporal and occipital cortices. However, there are clear differences. First, in contrast to the original iRBDRP, our pattern included relative hypermetabolism of the cerebellum, putamen, and pallidum, in keeping with Holtbernd et al. (19). The 2 latter regions were not considered stable in our analysis, but did contribute to iRBDRP subject scores. Second, Wu et al. described relatively increased metabolism of the middle cingulate, whereas our iRBDRP discloses relatively decreased metabolism of the same region. Third, relative hypometabolism of the parietal cortex appears to be a more salient feature in the current iRBDRP, whereas the occipital cortex was more prominent in the original iRBDRP.
It is conceivable that the differences between the 2 iRBDRPs were caused by heterogeneity in the respective iRBD samples. Although the iRBD cohorts in both studies had similar ages and symptom durations, it is unknown which proportion of patients will develop DLB or PD, and at what time interval. For example, it is possible that a larger proportion of prodromal DLB patients in the study by Wu et al. has caused the salient reductions in the occipital cortex. In addition, iRBD patients occasionally develop multiple system atrophy instead of PD or DLB (1–6). Multiple system atrophy is characterized by a different metabolic pattern (17) and could therefore have influenced pattern topography and subject scores.
Furthermore, the iRBDRP in our study was formed by a combination of PCs 4 and 5 (together accounting for 9.6% of the total variance), whereas most disease-related patterns (such as the PDRP) are found among the first few PCs (i.e., PC 1 and PC 2 combined (16), or PC 1 in isolation (14,18)). Wu et al. also identified their iRBDRP by PC 1 (14% of the variance) (20). The fact that the current iRBDRP was found among components with lower eigenvalues indicates that the between-subject variance was larger than the between-group variance in the iRBDRP identification cohort (cohort A: iRBD vs. controls). We also evaluated components 1 and 2 in cohort A. These components did not discriminate significantly between controls and iRBD patients in cohort A and cohort B, and were also not significantly different between PD patients and healthy controls (P > 0.05). PC 1 and PC 2 were similar to the first 2 components, which were reported in several cohorts of healthy controls (48). This is perhaps not surprising, as we contrasted controls to patients who did not have parkinsonism, of which most (n = 12) had normal dopamine transporter scans. The disease-related alterations are weak; a proportion of patients may have a metabolic brain profile that is close to normal. As a consequence, the first few PCs in this dataset describe normal resting-state brain function.
CONCLUSION
Our results suggest that the iRBDRP is an early manifestation of the PDRP. Expression of both PDRP and iRBDRP was higher in patients with a more severe form of PD (PD-MCI), which may indicate that expression of the 2 patterns increases with disease severity. This finding may be relevant for future progression and therapeutic studies in prodromal PD. Clinical and imaging follow-up of our cohort is ongoing and will provide insights to the changes of the iRBDRP over time and in relation to phenoconversion to PD or DLB.
DISCLOSURE
This study was funded by the Dutch ‘Stichting ParkinsonFonds’ and the German ‘ParkinsonFonds Deutschland’. Wolfgang H. Oertel, MD, PhD is Hertie-Senior-Research Professor, supported by the Charitable Hertie Foundation, Frankfurt/Main, Germany. No other potential conflict of interest relevant to this article was reported.
Acknowledgments
Members of the REMPET Study Group include Elisabeth Sittig-Wiegand, Candan Depboylu, Kathrin Reetz, Sebastiaan Overeem, Angelique Pijpers, Fransje E. Reesink, Teus van Laar, Laura K. Teune, Helmut Höffken, Marcus Luster, Lars Timmermann, Karl Kesper, Sofie M. Adriaanse, Jan Booij, Gianmario Sambuceti, Nicola Girtler, and Cathrine Jonsson. We thank J.M.C. (Marc) van Dijk, MD, PhD, and D.L.M. (Marinus) Oterdoom, MD, from the neurosurgery department, UMCG, for assistance in localizing brainstem regions in the iRBDRP. We thank Rosalie V. Kogan for proofreading the manuscript.
Footnotes
↵* Contributed equally to this work.
Published online Feb. 23, 2018.
- © 2018 by the Society of Nuclear Medicine and Molecular Imaging.
REFERENCES
- Received for publication September 14, 2017.
- Accepted for publication January 17, 2018.


