


Abstract
This review focuses on recent human 18F-FDG PET studies in Parkinson disease. First, an overview is given of the current analytic approaches to metabolic brain imaging data. Next, we discuss how 18F-FDG PET studies have advanced understanding of the relation between distinct brain regions and associated symptoms in Parkinson disease, including cognitive decline. In addition, the value of 18F-FDG PET studies in differential diagnosis, identifying prodromal patients, and the evaluation of treatment effects are reviewed. Finally, anticipated developments in the field are addressed.
Parkinson disease (PD) is a common neurodegenerative disorder and its prevalence is likely to increase in the next decades. Although the exact cause is unknown, the disease is associated with a gradual accumulation of the misfolded synaptic protein α-synuclein in the nervous system. The pathology is suggested to start in the gut (or olfactory bulb) and spreads via the dorsal motor nucleus of the vagal nerve to the brain stem (1). Subsequently, the pathologic process reaches the substantia nigra pars compacta in the mesencephalon, where the dopaminergic neurons reside. These neurons give important dopaminergic input to the striatum. Degeneration results in a cascade of dysfunction in several neural networks connecting the basal ganglia, thalamus, and cortical motor regions (2). This process is associated with the typical motor features of the disease: slowness of movement (bradykinesia), muscle stiffness (rigidity), and sometimes rest tremor, together referred to as parkinsonism.
PD is a clinical diagnosis and can be straightforward in a patient with parkinsonism who has an excellent and sustained levodopa response (3). However, parkinsonism is also an early sign of other neurodegenerative disorders such as multiple system atrophy (MSA), progressive supranuclear palsy (PSP), and corticobasal degeneration (CBD). Differentiating between these disorders at early disease stages can be challenging, and clinicopathologic studies show that the clinical diagnosis of PD is often incorrect in the early stages (4). This is problematic, because accurate, early diagnosis is important for patient management, prognosis, and patient selection for clinical trials. The diagnosis of neurodegenerative parkinsonism can be supported by presynaptic dopaminergic radiotracer studies. However, at an individual level, presynaptic dopaminergic tracer studies cannot differentiate between PD, MSA, PSP, or CBD (5).
Pathology in PD is widespread, involving neurotransmitters other than dopamine and distributed brain regions participating in neural networks. In addition to parkinsonism, PD patients experience multiple nonmotor symptoms including cognitive, mood, sleep, olfactory, and autonomic disorders. Some of these nonmotor symptoms can precede motor features by many years. Identifying patients in such a prodromal phase will be important for enrolling patients in neuroprotective trials (6). The strongest prodromal marker of PD is idiopathic rapid eye movement sleep behavior disorder (RBD), a parasomnia that can be diagnosed with a polysomnography. Patients with RBD fail to suppress muscle tone during the REM sleep stage, leading to dream enactment. Longitudinal studies have shown that more than 80% of patients initially diagnosed with idiopathic RBD developed PD, dementia with Lewy bodies (DLB), or incidentally MSA in the following decades (7).
At later disease stages, dementia is a common problem in PD, often preceded by mild cognitive impairment. Patients with DLB present with cognitive impairment and parkinsonism (3). Identifying patients at risk of developing cognitive impairment or dementia is important for patient management, and for clinical trials targeting early interventions to prevent dementia.
Neuroimaging studies have provided considerable insight in the neurobiologic basis of PD and its different clinical profiles (an excellent review is provided by Weingarten et al. (2)). Imaging of brain glucose metabolism is an important contributor to the field. Glucose metabolism can be measured accurately and reliably with 18F-FDG PET. This technique is increasingly available for routine clinical practice. The radiotracer 18F-FDG is analogous to glucose and provides an index for the first step of the cellular glycolytic pathway (8). Cerebral glucose metabolism is closely associated with local neural integrity and density. 18F-FDG uptake increases with synaptic activity and decreases with neural dysfunction in a patternlike manner, following the neuronal systems that are affected. 18F-FDG PET studies are especially relevant in PD and other neurodegenerative diseases, in which neuronal dysfunction precedes structural changes not detected by anatomic brain imaging. The current review focuses on recent human 18F-FDG PET studies in PD. Both glucose metabolism and cerebral blood flow are coupled to regional neuronal activity. Therefore, where necessary, we also review a few radioactively labeled water studies (e.g., H215O PET) or perfusion SPECT (99mTc-labeled ethylcysteinate dimer SPECT) studies.
ANALYSIS OF 18F-FDG PET IMAGES
The analysis of 18F-FDG PET images starts with the registration of images to standard anatomic space, to allow voxel-based comparisons between subjects. Next, interindividual variability is reduced, usually by dividing each voxel value by the global mean or another reference value. After anatomic registration and ratio-normalization, a common and straightforward approach to the analysis of 18F-FDG PET images is the application of univariate models in the software package statistical parametric mapping (SPM; http://www.fil.ion.ucl.ac.uk/spm/). In such studies, regions of altered relative 18F-FDG uptake in patients compared with controls are identified or correlations between 18F-FDG uptake in certain regions and clinical metrics are determined. A key characteristic of univariate approaches is that every region or voxel is treated separately.
However, it is increasingly recognized that PD is characterized by stereotyped connectivity changes, and that studying networks, rather than separate regions, provides more insight in pathophysiologic mechanisms underlying PD. Covariance analysis techniques are considered appropriate methods to explore network activity. A well-investigated approach is the scaled subprofile model (SSM). The SSM identifies disease-specific patterns of altered glucose metabolism in combined samples of resting-state scans of patients and controls (Spetsieris and Eidelberg (9) provide a complete description). Briefly, between-subject and between-region variability is removed from log-transformed imaging data. Next, the covariance is calculated between all voxels, and the data are reduced with principal component analysis (PCA). The components that best discriminate between controls and patients are identified as the relevant disease-related pattern. An important advantage of this approach is that once a pattern has been identified, the degree of its expression can be quantified in any 18F-FDG PET scan. This expression score is reflected by a single numeric value that can be used to investigate relationships with clinical or physiologic metrics or to make predictions.
For multivariate analysis of 18F-FDG PET images with multiple conditions (i.e., multiple scans per subject), ordinal trends canonical variates analysis (OrT/CVA) can be applied. This algorithm identifies relevant spatial covariance patterns within subjects, for which subject expression increases or decreases in most individuals across scan conditions, whereas the relationships between brain regions remain constant (10).
METABOLIC PROFILE OF PD
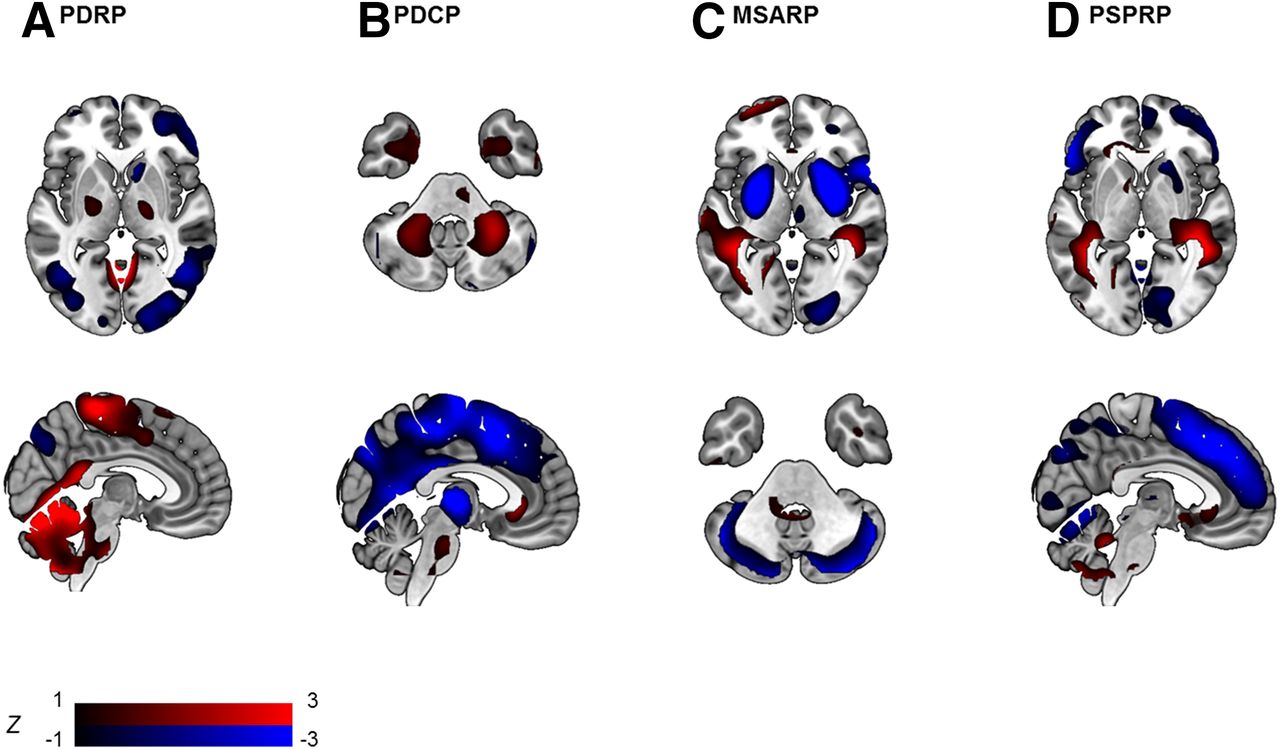
A disease-specific pattern for PD was first identified by Eidelberg et al. (11,12) and has been validated in multiple independent populations (13–16). The PD-related pattern (PDRP) is consistently characterized by relatively increased metabolism in the globus pallidus and putamen, thalamus, cerebellum, pons, and sensorimotor cortex and relative decreases in the lateral frontal and parietooccipital areas (Fig. 1A), similar to results from univariate group contrasts (17). The clinical and pathophysiologic correlates of the PDRP have been investigated extensively (13). PDRP expression correlates positively with akinetic-rigid motor symptoms and disease duration and negatively with uptake of presynaptic dopaminergic markers in the posterior striatum (18).

Disease-specific patterns in parkinsonian disorders identified with SSM PCA. Visualization of PDRP (A) (15), PDCP (B) (34), MSA-related pattern (MSARP) (C) (14), and PSP-related pattern (PSPRP) (D) (14). All patterns are displayed as z-maps, thresholded at |z > 1| (as indicated by the color bar), overlayed on an MRI T1 template. Red regions = relative hypermetabolism; blue regions = relative hypometabolism.
Interestingly, the PDRP is not related to tremor, probably reflecting the distinct pathophysiologic origins of bradykinesia/rigidity and tremor. A separate tremor-related pattern (PDTP) was identified with OrT/CVA applied to 18F-FDG PET data of 9 tremor-dominant PD patients before and after thalamic deep brain stimulation (DBS) (19). The PDTP was characterized primarily by increases in the cerebellum and primary motor cortex. PDTP expression scores were correlated to tremor but not to bradykinesia/rigidity.
It has also been shown that motor networks described in normal condition are disturbed in PD (20). Derived from cerebral blood flow measurements during a motor task and at rest, a normal movement-related activation pattern was identified with OrT/CVA, of which the activation was subsequently compared with that in rest. This motor pattern comprised the sensorimotor, premotor, and inferior parietal cortex and the cerebellar vermis, being activated in both controls and PD patients during task performance. However, whereas the motor pattern was not activated at rest in controls, PD patients strikingly failed to repress the motor pattern at rest, irrespective of tremor. Expression of this normal motor pattern at rest was present at the early clinical stages of PD and increased with disease progression, similar to PDRP expression.
Another well-defined network that is disturbed in PD is the default mode network (DMN). The DMN is identified with functional MRI and describes normal regional brain activity at rest, in the absence of focused cognitive activity. A resting-state network resembling the DMN has also been identified in 18F-FDG PET data with SSM (21). In controls and early PD patients, expression of this PET-derived DMN was lower during a task than the rest condition. However, in advanced PD, this physiologic task-related deactivation of the DMN was lost. Moreover, with advancing disease, resting-state brain organization moved away from the DMN and was increasingly dominated by a pathologic network: the PDRP.
PD AND COGNITIVE IMPAIRMENT
Distinct PD subtypes, such as postural instability gait disorder and PD patients with RBD, are associated with a higher risk of developing dementia. In contrast, patients with a tremor-dominant phenotype rarely develop dementia. Zhang et al. found additional hypometabolism in the caudate nucleus and inferior parietal lobule in patients with postural instability gait disorder compared with tremor-dominant patients (22). Decreased metabolism in parietal-occipital regions was found in PD patients with RBD compared with PD patients without RBD (23). Compared with patients with PD or PD dementia, DLB patients show more pronounced hypometabolism of the visual association cortices (24). Occipital hypometabolism is associated with visual hallucinations, which are common in DLB but may also occur in PD. PD patients with visual hallucinations indeed also show occipital hypometabolism and have a higher risk of developing dementia than patients without visual hallucinations (25).
Both cross-sectional (26,27) and longitudinal (28–31) 18F-FDG PET studies using univariate designs have shown that progressive cortical hypometabolism, especially of parietal and occipital regions, marks the transition from normal cognition to dementia in PD and DLB. In addition, a study combining 18F-FDG PET with structural imaging concluded that hypometabolism predates atrophy in these brain regions (32). Thus, hypometabolism and atrophy are consecutive stages of the same process, which is progressive in nature and is associated with the development of cognitive decline.
Network studies (SSM) have revealed a consistent metabolic pattern associated with cognitive decline in nondemented PD patients (33,34). This PD cognition–related pattern (PDCP) is characterized by hypometabolism in frontal and parietal association regions and hypermetabolism in the cerebellar dentate nuclei (Fig. 1B). PDCP expression was correlated to executive and memory performance but not to motor scores. Furthermore, PDCP expression was significantly higher in PD patients with mild cognitive impairment than in their cognitively unimpaired counterparts.
Although cognitive dysfunction may be influenced by many neurotransmitter systems, degeneration of cholinergic and dopaminergic projections are thought to be the most important (35). The dopaminergic system projects not only to motor pathways but also to the lateral prefrontal cortices via the caudate. This frontostriatal system is intimately connected with the posterior parietal cortex and is related to executive and memory functioning. Associations found between PDCP topography (a frontoparietal network), decreased uptake of presynaptic dopaminergic markers in the caudate nucleus, and executive and memory dysfunction imply that the PDCP is caused by disintegration of frontostriatal circuits (18,36). The cholinergic system originates in the nucleus basalis of Meynert in the basal forebrain and the pedunculopontine nucleus in the brain stem. DLB and PDD are associated with severe cholinergic deafferentiation of the neocortex, especially in parietooccipital regions. This is congruent with 18F-FDG PET findings of posterior hypometabolism in dementia (37).
DIFFERENTIAL DIAGNOSIS
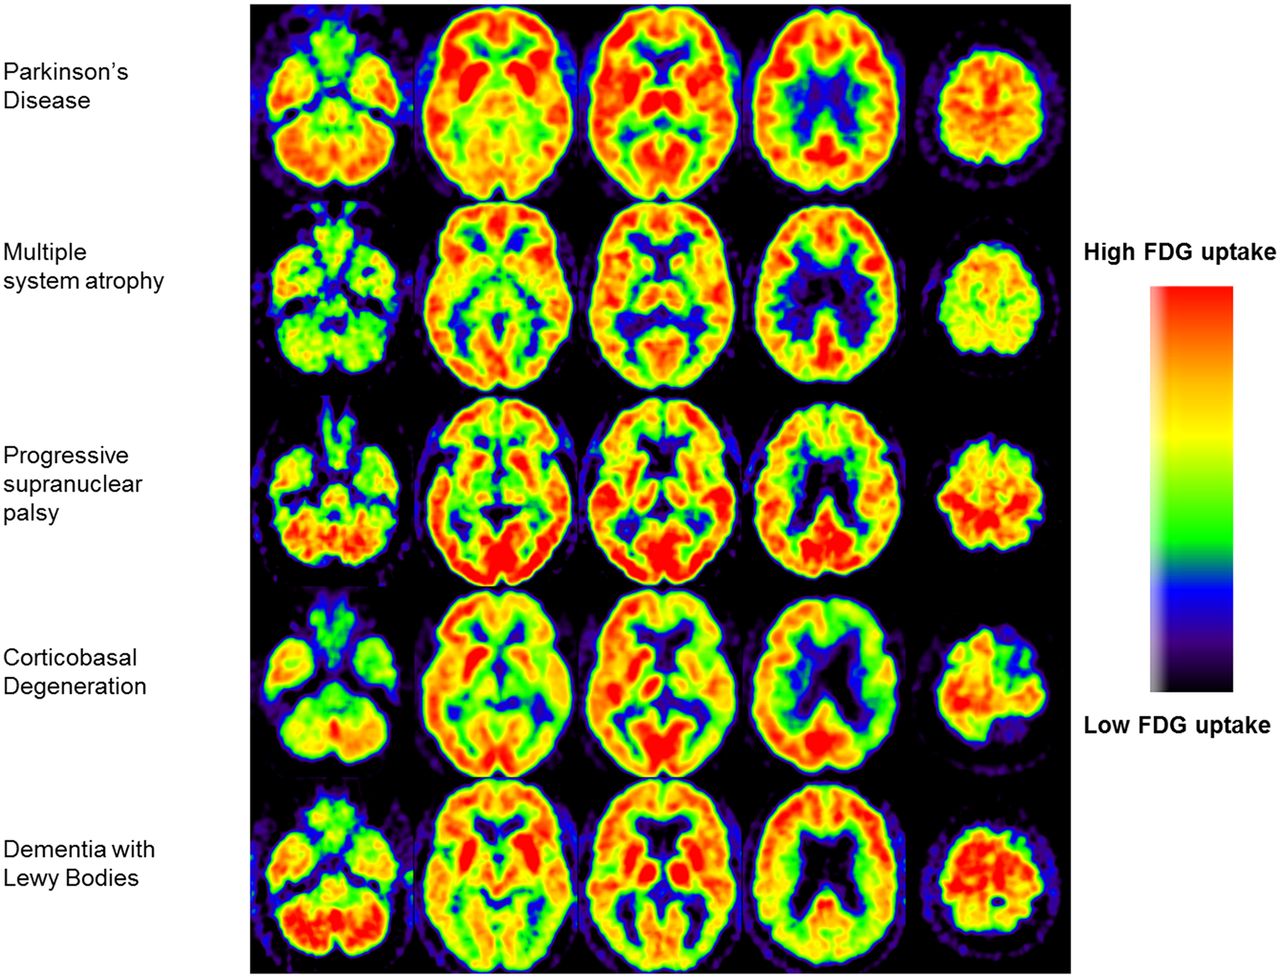
SPM studies contrasting healthy controls with PSP, MSA, and CBD cases have found consistent metabolic patterns in each condition, which are distinct from the PD metabolic profile (17). MSA is characterized by hypometabolism in the putamen and cerebellum; PSP by hypometabolism in the prefrontal cortex, frontal eye fields, caudate nuclei, medial thalamus, and upper brain stem; and CBD by hypometabolism of the cortex and basal ganglia of one hemisphere and the contralateral cerebellum. In routine clinical practice, the 18F-FDG PET scan of a patient can be assessed visually with reference to these typical vignettes (Fig. 2). Hellwig et al. analyzed 18F-FDG PET scans of parkinsonian patients with an unclear diagnosis by visual assessment combined with individual voxel-based statistical maps (3-dimensional stereotactic surface projection technique). Consensus interpretation of the 18F-FDG PET image was compared with the clinical diagnosis after 1-y follow-up. The sensitivity and specificity were, respectively, 86% and 91% for PD versus not-PD, 77% and 97% for MSA, 74% and 95% for PSP, and 75% and 92% for CBD. This study underscores the value of 18F-FDG PET for differential diagnosis of neurodegenerative parkinsonism in a clinical setting (38). An important restriction of this approach is that an expert is needed for correct visual assessment and that the 3-dimensional stereotactic surface projection technique method does not cover the striatum.

Typical examples of transversal 18F-FDG PET brain images of individual patients with neurodegenerative parkinsonism. (Reprinted from Booij J, Teune LK, Verberne HJ. The role of molecular imaging in the differential diagnosis of parkinsonism. Q J Nucl Med Mol Imaging. 2012;56:17–26. Copyright 2012, with permission from Minerva Medica.)
With SSM, disease-specific patterns have been identified not only for PD (Fig. 1A), but also for MSA (Fig. 1C), PSP (Fig. 1D), and CBD (13,14,39). These patterns mirror findings of univariate studies but can be especially useful in differential diagnosis, because expression of these patterns can be quantified on a prospective case basis (Fig. 3). When expression scores for each of these patterns are calculated in individual patients, there can be some overlap between disease groups (5). Differential diagnosis is therefore better achieved by combining several pattern scores in a statistical model. A logistic 2-step model, which first differentiates between PD and not-PD and subsequently between MSA and PSP, was tested in 2 cohorts of patients with parkinsonism and an uncertain diagnosis at the time of imaging (n = 167 (40) and n = 129 (41)). After a follow-up of 2 y by a movement disorders specialist masked for the 18F-FDG PET, clinical diagnosis accorded well with the pattern diagnosis in both studies, with similarly high sensitivity and specificity. The sensitivity and specificity were, respectively, 83% and 94% for PD versus not-PD, 79% and 90% for MSA, and 100% and 94% for PSP. The diagnostic accuracy was similarly high when the model was applied to a subgroup of patients with a very short symptom duration (<2 y) (41).
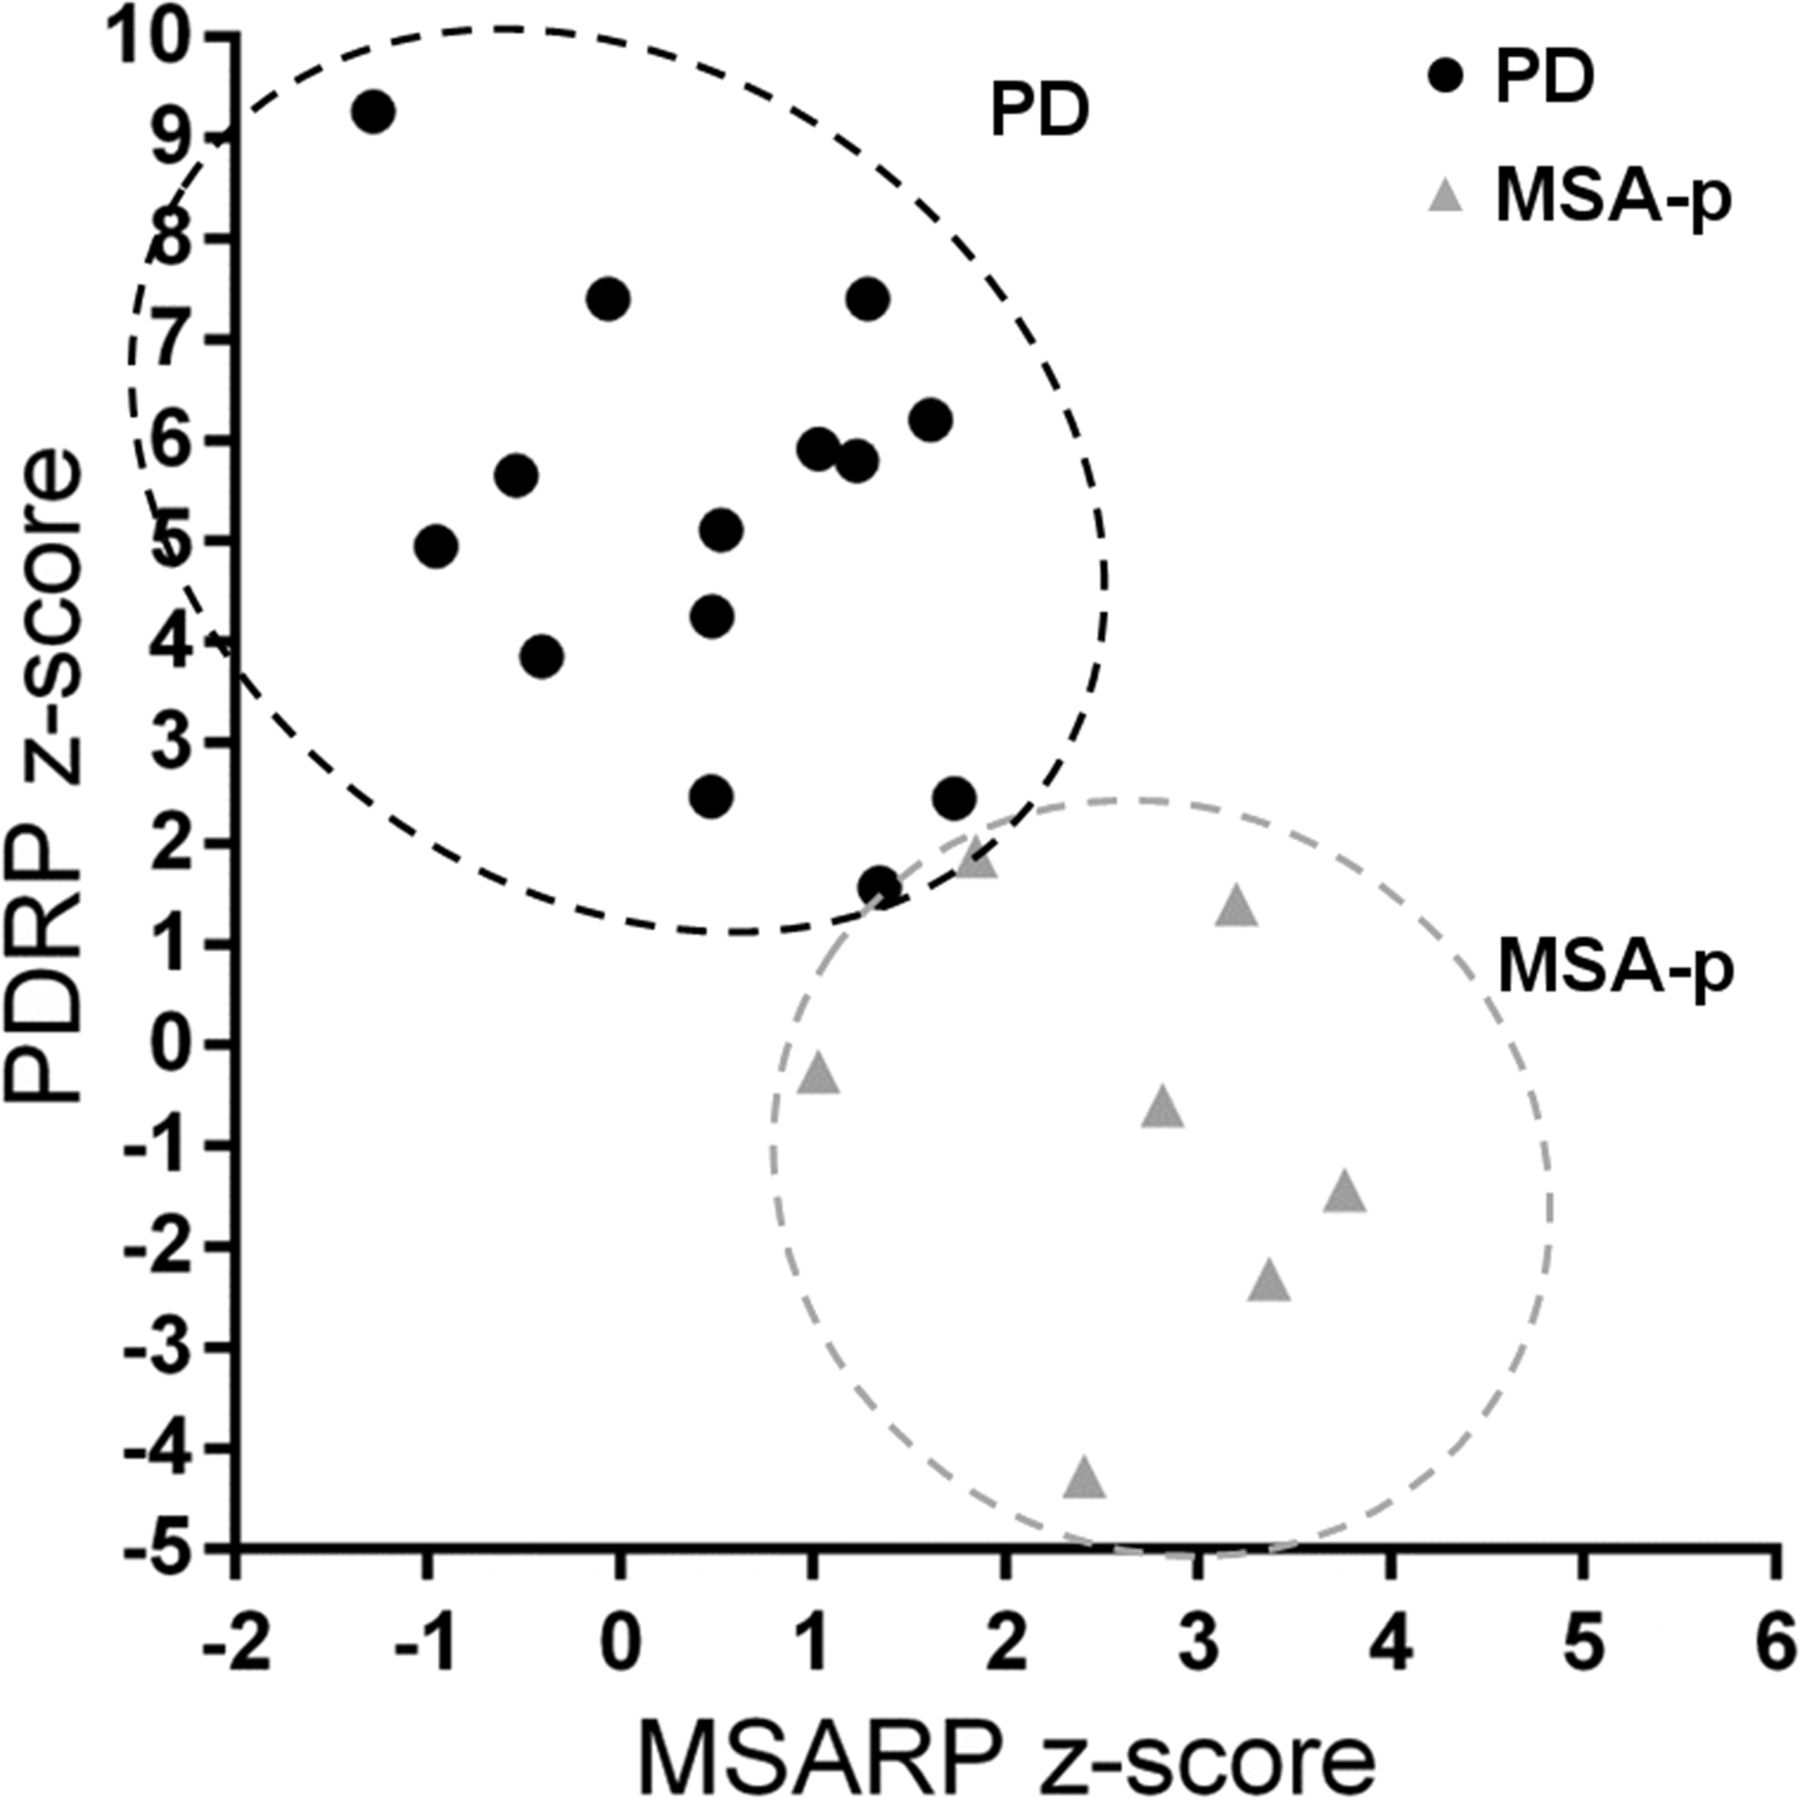
Preliminary data from Glucose Imaging in Parkinsonian Syndromes project. Individual PDRP and MSARP expression values are displayed for patients with clinical diagnosis of probable PD and probable MSA (of parkinsonian subtype, MSA-P). MSARP = MSA-related pattern.
Other classification algorithms have also been tested. Mudali et al. combined SSM PCA features with several classifiers, comparing multiple groups in the same model. Performance of nearest neighbors and linear support vector machine gave the best classification of controls, PD, PSP, and MSA subjects, although performance was not as high as in the studies discussed above (42). Garraux et al. applied relevance vector machine to the classification of 120 patients with parkinsonism, which yielded high performance for PD versus not-PD (sensitivity, 93%; specificity, 83%), but classification of MSA and PSP was poor.
PREDICTING PD ONSET IN IDIOPATHIC RBD
Because idiopathic RBD is the strongest currently known predictor of PD, a growing number of studies have tried to identify reliable neuroimaging markers to predict the onset of parkinsonism in these prodromal individuals (43). Two studies demonstrated that idiopathic RBD patients significantly express the PDRP (44,45). This finding was recently confirmed by our group (Meles et al., unpublished data, 2013–2016). Holtbernd et al. included long-term clinical follow-up data of 17 idiopathic RBD patients, which revealed that phenoconversion to PD/DLB was more likely in individuals with high PDRP expression at baseline. In contrast, 3 idiopathic RBD patients who developed MSA 2–4 y later did not express the PDRP at baseline. A logistic regression model based on PDRP expression and age at baseline could accurately predict phenoconversion to PD/DLB (44). These findings indicate that network expression has potential as a marker for phenoconversion and may have additional value in predicting which phenotype a patient with idiopathic RBD will develop.
TREATMENT EFFECTS
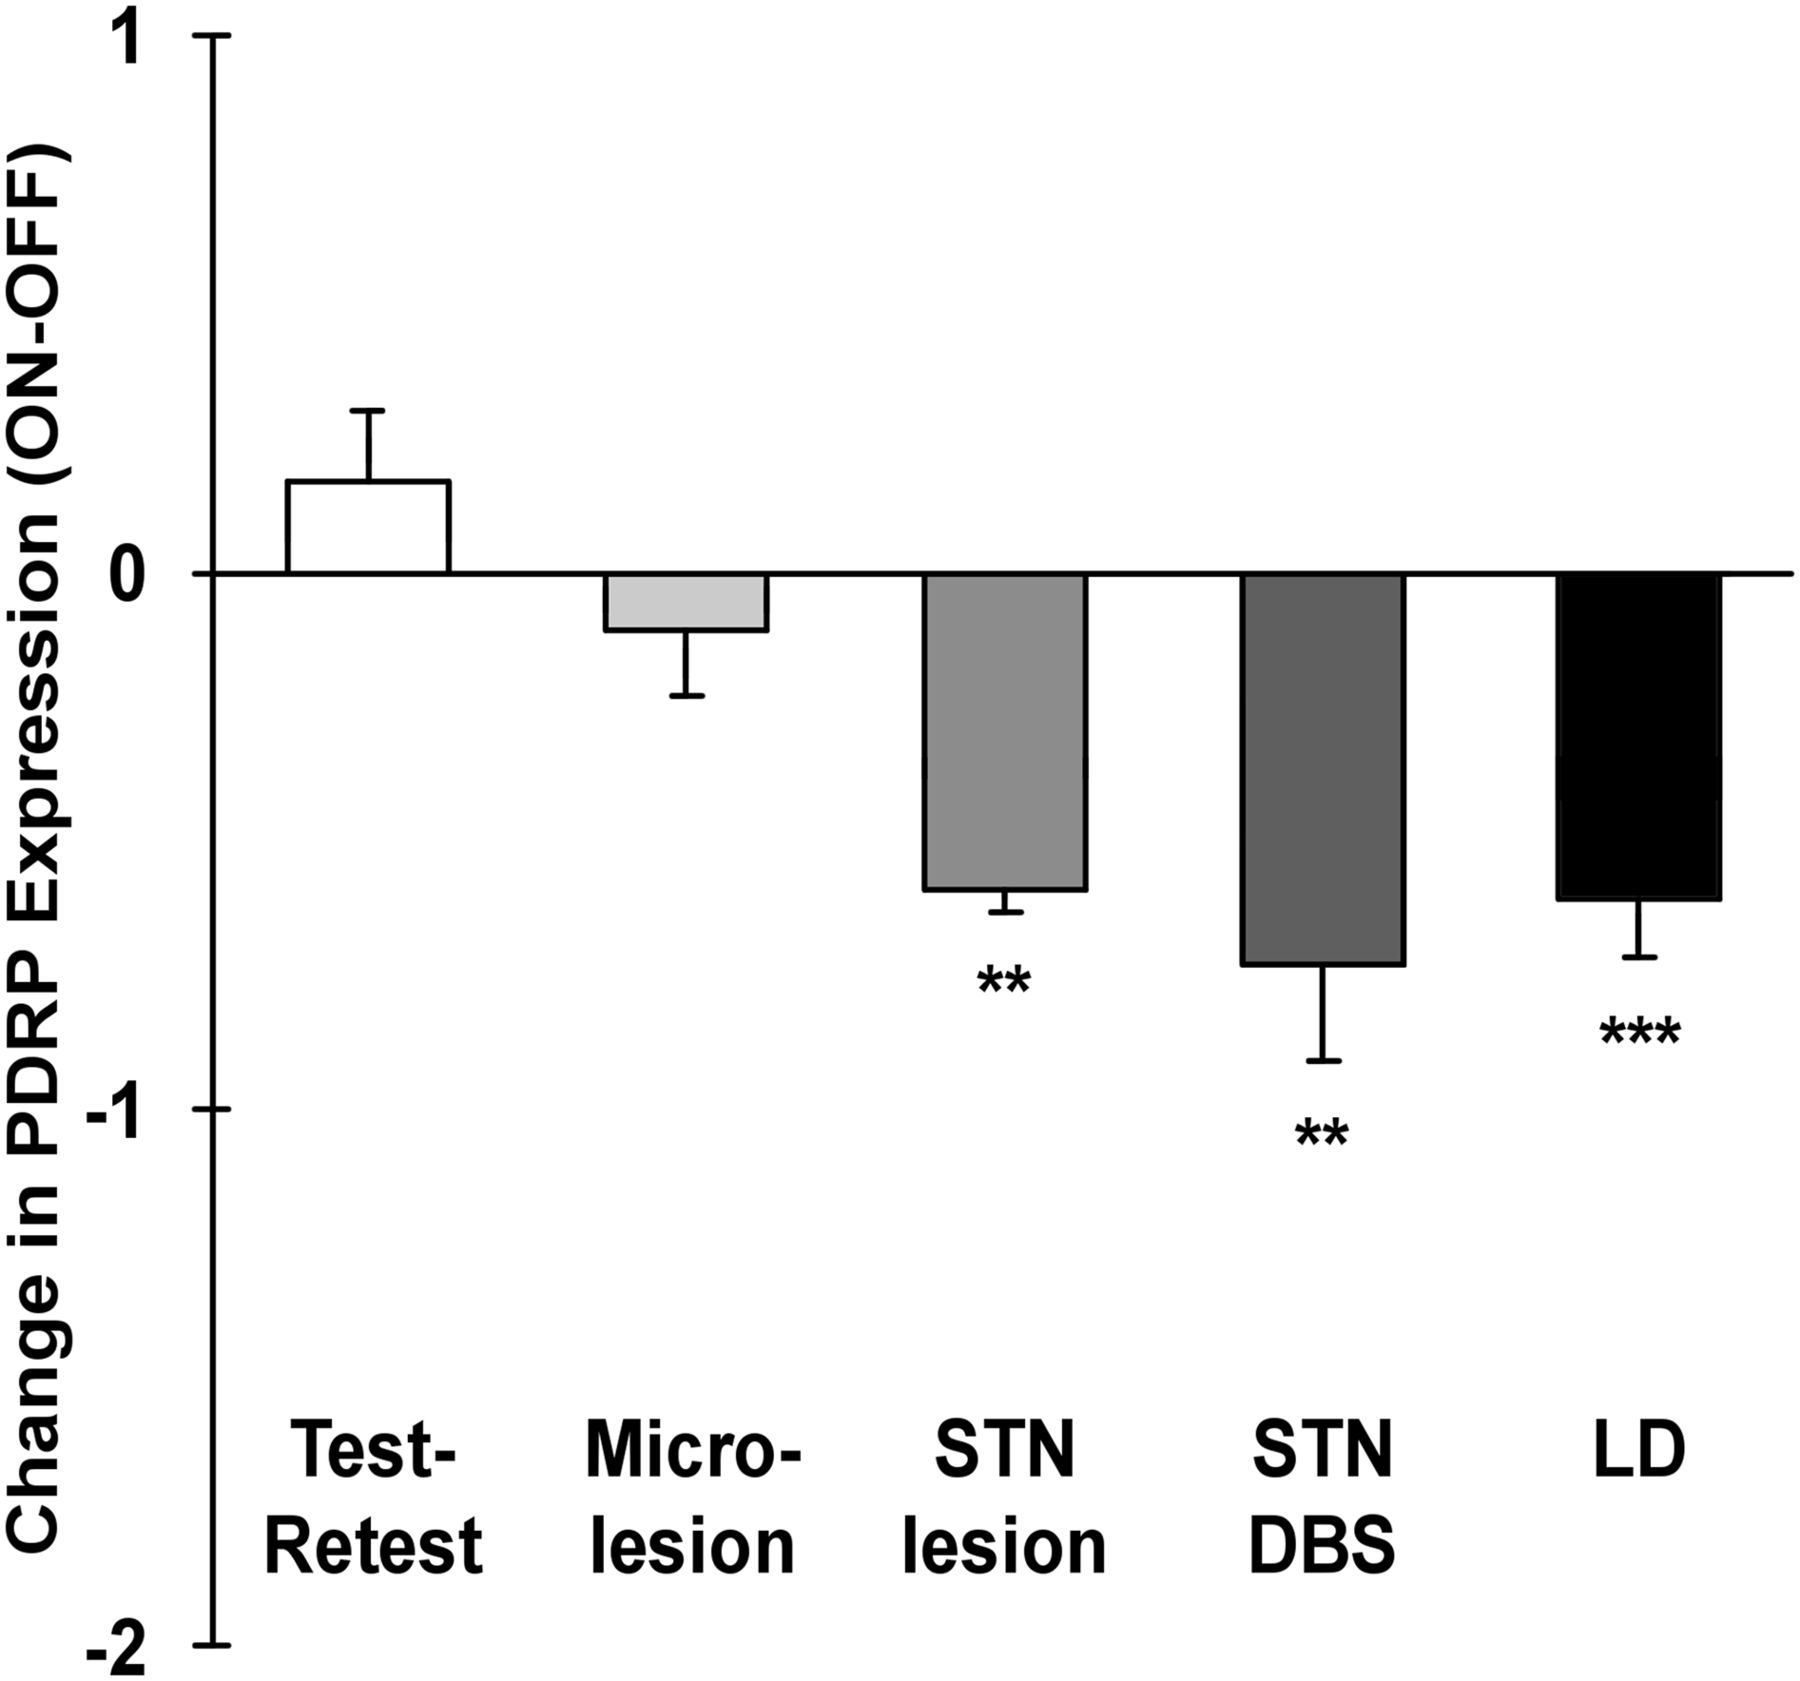
Because the PDRP is expressed in early and prodromal disease, increases with disease severity and progression, and is useful differential diagnosis, PDRP expression could be considered as a biomarker for PD in clinical trials. In that case, PDRP expression should also be modulated by effective therapies. Indeed, PDRP expression decreased after subthalamotomy, DBS of the subthalamic nucleus (STN), and levodopa treatment (Fig. 4). Moreover, clinical improvement after therapy correlated to the degree of PDRP modulation (13). The effect of levodopa on brain metabolism and blood flow, especially from a network perspective, has been reviewed recently (46).

Modulation of PDRP expression in response to treatment (mean ± SE). Shaded bars indicate change in PDRP expression after stereotactic surgery targeting STN: microlesion (n = 6), subthalamotomy (n = 6), and DBS (n = 18). Solid bar indicates changes in PDRP expression in response to levodopa (LD) administration (n = 18). Changes were significant after subthalamotomy, STN DBS, and levodopa treatment but not microlesion (**P < 0.01, ***P < 0.001 for the comparison of changes in PDRP expression with each intervention with those observed during test–retest evaluation, RMANOVA). (Reprinted from Niethammer M, Eidelberg D. Metabolic brain networks in translational neurology: concepts and applications. Ann Neurol. 72:635–647, Copyright 2012, with permission from John Wiley and Sons.)
The effect of treatment on other PD networks has also been evaluated. The PDTP was modulated by DBS of the ventral intermediate (Vim) thalamic nucleus, whereas the PDRP was not. Although STN DBS reduced activity of both PDTP and PDRP, PDTP was better modulated by Vim DBS than by STN DBS (19).
The effect of levodopa on PDCP expression is not as straightforward as the effect on PDRP expression. Interestingly, only certain patients show a decrease in PDCP expression after levodopa therapy. These patients, so-called cognitive responders, showed improved executive functioning after levodopa administration. Cognitive responders are usually patients with more advanced cognitive impairment, signified by more extensive caudate dopamine depletion and a higher PDCP score at baseline (46).
Evaluation of therapies for PD has been challenging because of clinical improvement in patients receiving sham/placebo treatments. The underlying network effects of this sham response were studied with 18F-FDG PET and OrT/CVA in a cohort of PD patients who participated in a randomized controlled trial of a gene therapy (47). A spatial covariance pattern associated with motor improvement 6 mo after sham surgery was identified, characterized by hyperactivity of the cerebellum and paralimbic structures. This sham-related pattern was expressed in sham responders under the mask, but declined significantly after unmasking. Expression was absent in patients not responding clinically to sham surgery and in active therapy responders. Expression of the sham-related pattern at baseline (i.e., before surgery) could predict motor responses 6 mo after sham surgery and may thus reflect a proneness to positive expectancy. The authors concluded that identification of sham responders with this approach may be useful in clinical trials.
FUTURE PERSPECTIVES
Network analysis of 18F-FDG PET data may provide appropriate biomarkers for PD, which will be important when neuroprotective compounds may be studied in clinical trials. Especially the PDRP has been thoroughly investigated, and initial studies in prodromal PD are promising. In contrast, the PDCP requires further validation, especially in longitudinal studies.
Recent advances of combined PET/MR imaging may allow better anatomic registration of 18F-FDG images and investigation of precise structural–functional correlates in PD. Combining multiple imaging features in machine-learning approaches may improve classification of individual patients. Quantification tools are needed that can be applied easily and reliably for purposes of differential diagnosis across centers. In this context, the influence of different imaging protocols on image classification needs to be investigated.
These goals may best be achieved by a combined effort of multiple neurology and nuclear medicine centers. A first step in this direction has been made with the Glucose Imaging in Parkinsonian Syndromes project by the Groningen group (http://glimpsproject.com/).
DISCLOSURE
We thank the Dutch ‘Stichting Parkinson fonds’ for financial support. No other potential conflict of interest relevant to this article was reported.
Footnotes
Published online Nov. 22, 2016.
- © 2017 by the Society of Nuclear Medicine and Molecular Imaging.
REFERENCES
- Received for publication October 26, 2016.
- Accepted for publication November 18, 2016.


