


Abstract
Simultaneous PET and MRI using new hybrid PET/MRI systems promises optimal spatial and temporal coregistration of structural, functional, and molecular image data. In a pilot study of 10 patients with intracranial masses, the feasibility of tumor assessment using a PET/MRI system comprising lutetium oxyorthosilicate scintillators coupled to avalanche photodiodes was evaluated, and quantification accuracy was compared with conventional PET/CT datasets. Methods: All measurements were performed with a hybrid PET/MRI scanner consisting of a conventional 3-T MRI scanner in combination with an inserted MRI-compatible PET system. Attenuation correction of PET/MR images was computed from MRI datasets. Diagnoses at the time of referral were low-grade astrocytoma (n = 2), suspicion of low-grade astrocytoma (n = 1), anaplastic astrocytoma (World Health Organization grade III; n = 1), glioblastoma (n = 2), atypical neurocytoma (n = 1), and meningioma (n = 3). In the glial tumors, 11C-methionine was used for PET; in the meningiomas, 68Ga-DOTATOC was administered. Tumor–to–gray matter and tumor–to–white matter ratios were calculated for gliomas, and tracer uptake of meningiomas was referenced to nasal mucosa. PET/MRI was performed directly after clinically indicated PET/CT examination. Results: In all patients, the PET datasets showed similar diagnostic image quality on the hybrid PET/MRI and the PET/CT studies; however, slight streak artifacts were visible in coronal and sagittal sections when using the higher intrinsic resolution of the PET/MRI insert. Prefiltering of images with a 4-mm gaussian filter at a resolution comparable to that of the PET/CT system virtually eliminated these artifacts. Although acquisition of the PET/MR images started at 30–60 min after PET/CT (20.4-min half-life of 11C) acquisition, the signal-to-noise ratio was good enough, thus underlining the high sensitivity of the PET insert, compared with whole-body PET systems. The computed tumor–to–reference tissue ratios exhibited an excellent accordance between the PET/MRI and PET/CT systems, with a Pearson correlation coefficient of 0.98. Mean paired relative error was 7.9% ± 12.2%. No significant artifacts or distortions were detected in the simultaneously acquired MR images using the PET/MRI scanner. Conclusion: Structural, functional, and molecular imaging in patients with brain tumors is feasible with diagnostic imaging quality using simultaneous hybrid PET/MR image acquisition.
Because of its high soft-tissue contrast, MRI has become the first-line method of choice for the assessment of brain tumors. Though conventional MRI allows for excellent visualization of these tumors, there are still certain limitations (1). First, infiltrating glioma cells may extend along white matter tracts beyond abnormalities in contrast-enhanced T1- and T2-weighted imaging (2,3). Second, studies suggest that only half of the low-grade gliomas can be correctly classified using conventional contrast-enhanced MRI, and approximately one third of nonenhancing tumors are in fact high-grade gliomas (4,5). Third, conventional MRI is often insensitive to changes after treatment (1). Advanced MRI techniques such as diffusion-weighted imaging (6), perfusion-weighted imaging (7), and MR spectroscopy (8,9) may provide a better estimation of tumor extension and potentially higher accuracy in tumor grading.
PET can provide important biochemical and metabolic information not obtainable by MRI. The combination of PET and MRI may increase diagnostic accuracy over the single modalities. Indeed, in combination with conventional MRI, PET with radiolabeled amino acids, such as 11C-methionine, is today an established diagnostic tool in the clinical management of cerebral gliomas. In primary diagnostic assessment, this modality can be used to improve biopsy targeting in heterogeneous tumors, determination of tumor extent, and prognosis and choice of treatment. Furthermore, amino acid imaging can help to delineate posttherapeutic alterations from tumor recurrence (10).
68Ga-DOTATOC is a PET radiotracer that binds specifically to somatostatin receptors, which are overexpressed in meningiomas (11–14). Given the high concentration of somatostatin receptors in meningiomas and that normal brain tissue is practically devoid of somatostatin receptors, DOTATOC PET is effective in detecting these tumors and showing their extension. DOTATOC PET is a valuable adjunct to MRI, especially in tumors beneath osseous structures at the skull base that can be difficult to assess with MRI alone. All in all, MRI and PET provide complementary information such that a combination of these imaging modalities may well improve the assessment of various brain tumor entities (15).
Recently, hybrid PET/MRI systems have been developed using MRI-compatible PET components, allowing for simultaneous PET and MRI data acquisition. The first hybrid PET/MRI detectors were developed by Shao et al. (16) in the late 1990s using scintillation crystals placed inside a clinical 1.5-T MRI scanner and coupled to long optical fibers leading to conventional photomultiplier tubes outside the fringe magnetic field. A different approach was taken by Pichler et al.—that of using avalanche photodiodes instead of photomultiplier tubes to construct an MRI-compatible PET system (17). Recently, the first hybrid PET/MRI systems with avalanche photodiodes for preclinical and clinical applications have been installed (18,19).
Reported in this article are the initial experiences from a pilot study of 10 patients with intracranial masses who were scanned with a prototype of a clinical hybrid PET/MRI system (BrainPET; Siemens) for brain and head imaging (inside a conventional high-field MRI scanner) (19) directly after clinical PET/CT with methionine or DOTATOC.
MATERIALS AND METHODS
Subjects
Between August 2008 and November 2009, 10 patients (age range, 34–73 y; median, 51 y) with intracranial masses participated in this pilot study. All patients first underwent clinically indicated brain PET/CT, followed immediately by PET/MRI. Two patients had low-grade astrocytoma, 1 had suspicion of low-grade astrocytoma, 1 had anaplastic astrocytoma (World Health Organization [WHO] grade III), 2 had glioblastoma, 1 had atypical malignant neurocytoma, and 3 had meningioma. In all patients with brain masses, except for those with meningioma, histologic confirmation was obtained; however, in 1 patient with low-grade astrocytoma, histology did not provide a clear diagnosis. The 3 patients with meningiomas underwent radiotherapy without histologic confirmation. The study was approved by the local institutional review board. All patients gave their written informed consent to the PET/CT and PET/MRI examination and scientific evaluation of the datasets.
PET/CT
All patients underwent PET/CT with either methionine or DOTATOC, according to standard clinical protocols. PET data acquisition (Hi-Rez Biograph 16; Siemens Healthcare) started at 30 min after the injection of methionine (585–764 MBq) and lasted for 8 min, or the acquisition started at 20 min after the injection of DOTATOC (126–153 MBq) and lasted for 4 min. For attenuation correction, a non–contrast-enhanced low-dose CT scan was acquired in the glioma patients, and a CT scan was acquired after administration of 90 mL of Ultravist 370 (Bayer-Schering Pharma AG) in the meningioma patients. Attenuation-corrected transaxial slices (matrix size, 256 × 256, corresponding to a field of view [FOV] of 45.5 × 45.5 cm) were reconstructed using the standard software of the scanner (Fourier rebinning, 2-dimensional ordered-subset expectation maximization with 8 iterations, 16 subsets).
PET/MRI System
All PET/MRI examinations were performed using a hybrid PET/MRI system capable of simultaneous PET/MRI of the human brain and skull base. The system consisted of an MRI-compatible PET system (BrainPET; Siemens) inserted into a slightly modified 3.0-T whole-body MRI scanner (Magnetom Tim Trio; Siemens Healthcare). The technical specifications of the PET system have been described previously (19). In short, the PET detector technology relies on lutetium oxyorthosilicate scintillation crystals in combination with MRI-compatible avalanche photodiodes instead of photomultiplier tubes. The PET scanner offers an axial FOV of approximately 19.1 cm and a transversal FOV of 32.0 cm. The image volume consists of 153 transaxial images, with a matrix size of 256 × 256 and a voxel size of 1.25 mm3. All image data were acquired in list mode, for which all single detected coincidence events were stored on hard disk with the exact detector location and timing information, for retrospective data histogramming and reconstruction. The modifications of the MRI scanner comprise the deactivation of the built-in body transmitter and alterations of the MRI patient-handling system to allow for the precise mounting of the head coil within the PET scanner, thereby matching the 2 FOVs. A dedicated birdcage transmit–receive head coil was used for spin excitation, which was combined with an inner 8-channel receive-only head coil. The gradient system operates with a maximum gradient strength of 40 mT/m and a slew rate of 200 T/m/s in all 3 axes.
PET/MRI Data Acquisition
PET and MRI data acquisition was simultaneously started at 30–60 min after PET/CT acquisition. PET data were acquired for 30 min, resulting in about 5 GB of raw data. PET datasets were reconstructed using an ordered-subset expectation maximization 3-dimensional (3D) algorithm (20). The attenuation maps were computed from 3D MRI datasets using an algorithm combining pattern recognition and atlas registration (21). A 4-mm gaussian 3D filter was applied to all PET datasets. Image coregistration and fusion were performed with the VINCI software package (22).
The MRI examination protocol included a transversal T1-weighted 3D-encoded gradient-echo sequence for attenuation correction (repetition time [TR]/echo time [TE], 4.6/2.46; excitation angle, 10°; matrix size, 256 × 256 × 160; resolution, 1.25 × 1.25 × 1.25 mm; bandwidth, 590 Hz/pixel; and parallel imaging GRAPPA factor 2); transversal 2-dimensional–encoded fluid attenuated inversion recovery (FLAIR) sequence (TR/TE, 9,000/87; echo train length, 16; inversion time, 2.5 s; matrix size, 256 × 232; in-plane resolution, 0.78 × 0.78 mm2; slice thickness, 3 mm; and bandwidth, 200 Hz/pixel); T2-weighted 2-dimensional–encoded fast spin-echo sequence in transversal, sagittal, and coronal orientations (TR/TE, 5,000/90; echo train length, 17; matrix size, 512 × 512; in-plane resolution, 0.39 × 0.29 mm2; slice thickness, 3 mm; and pixel bandwidth, 190 Hz/pixel); and sagittal 3D-encoded magnetization-prepared rapid-acquisition gradient-echo (MPRAGE) sequence (TR/TE, 1,900/2.4; inversion time, 0.9 s; matrix size, 512 × 512 × 338; resolution, 0.49 × 0.49 × 0.9 mm; bandwidth, 190 Hz/pixel; and parallel imaging GRAPPA factor 2) after gradient-echo localizers. The Ethics Committee required that no contrast-enhanced images be obtained.
Data Analysis
For all brain tumors, tumor–to–gray matter ratios (T/G ratios) and tumor–to–white matter ratios (T/W ratios) were computed by region-of-interest (ROI) analysis using the VINCI software tool. In addition, as a control gray matter–to–white matter ratio (G/W ratio) was computed in all patients with brain tumors. In the patients with meningiomas receiving a DOTATOC injection, the ratio of uptake in tumor tissue to uptake in nasal mucosa (T/NM ratio) as a reference tissue was computed (11), because nasal mucosa exhibits a slight to moderate physiologic uptake.
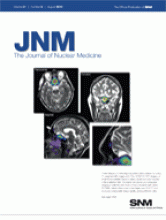
For ROI analysis, PET datasets from PET/MRI and PET/CT were coregistered with the VINCI software tool MMM CoRegistration. The ROIs were outlined in the PET dataset from PET/CT and subsequently copied to the coregistered PET dataset from PET/MRI. For the 3 patients with low-grade astrocytoma, both PET datasets were coregistered to the respective FLAIR dataset from PET/MRI, and ROIs outlining the hyperintense area in the FLAIR images were defined. Gray and white matter ROIs were drawn in the frontal brain area. Typical ROI definition is illustrated in Figure 1. The mean value was computed for the reference ROIs using the VINCI Report Tool. For the tumor ROIs, both the mean and the maximum values were computed to assess whether remaining streak artifacts rendered the maximum values less reliable than the mean values. For all ratios, SDs were computed from the SDs of the ROI evaluation using gaussian error progression. For T/G ratios in brain tumors and T/NM ratios in meningiomas, the Pearson correlation coefficient between PET/CT and PET/MRI examination was calculated. Mean value and SD were computed for T/W ratios. Increased tumoral methionine uptake was classified as “positive” for a T/G ratio of 1.2 or greater or a T/W ratio of 1.5 or greater and “negative” for a T/G ratio less than 1.2 and T/W ratio less than 1.5. Increased DOTATOC uptake was classified as “positive” for a T/NM ratio of 1.2 or greater.

ROIs of tumor are defined on methionine PET images. (Top) PET dataset from PET/CT is visualized in red and yellow; PET dataset from PET/MRI in blue and green. Both PET datasets were coregistered with VINCI software. ROI definitions were drawn manually in PET/CT dataset and subsequently copied to coregistered PET/MRI dataset. (Bottom) Outlines of gray and white matter.
Tumor volumes were calculated by applying a 3D threshold–based volume-of-interest analysis in all patients from the PET datasets of PET/MRI and PET/CT, using the VINCI software. The threshold for increased methionine uptake was set to 1.5 or greater in the contiguous tumor region, with gray matter taken as a reference tissue. Tumor volumes were calculated only for tumors with a T/G ratio of 1.5 or greater.
RESULTS
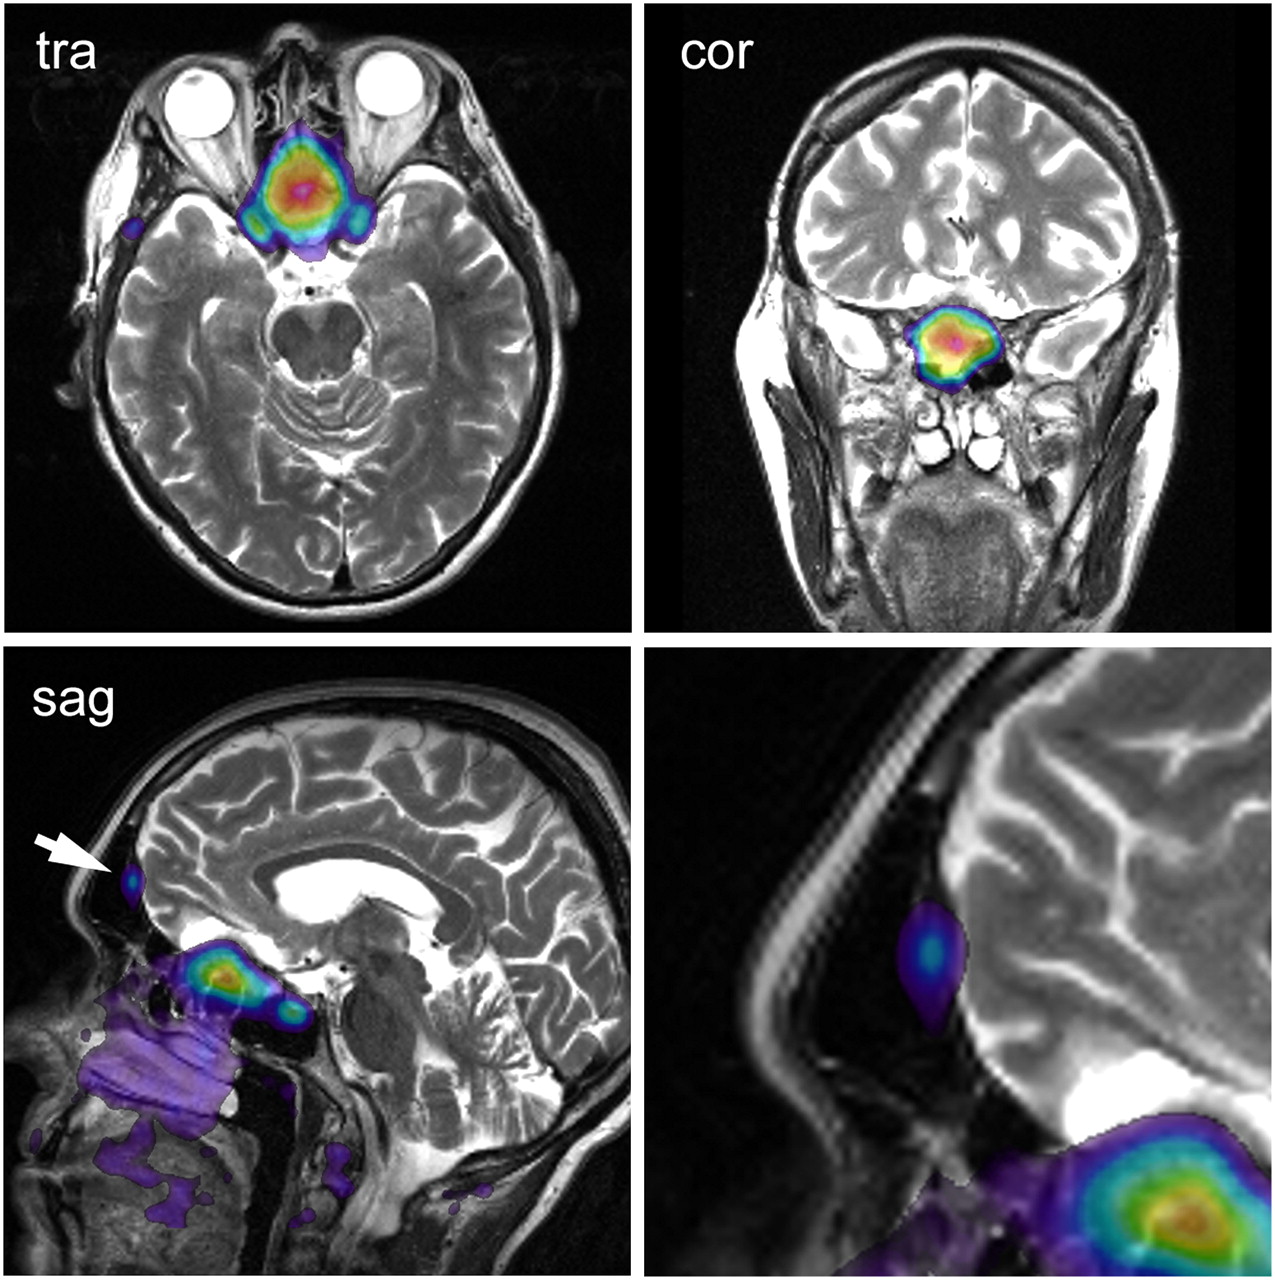
PET/CT and PET/MRI examinations were successfully performed in all participating patients. The MRI datasets acquired during simultaneous PET acquisition showed diagnostic image quality, without apparent artifacts or distortions. Without application of the 4-mm gaussian filter, the PET datasets from concurrent PET/MRI examinations exhibited slight streak artifacts, which were best visible in the sagittal and coronal reformations (data not shown). After filtering, these artifacts were hardly visible. A typical PET/MR image set is shown in Figure 2. Comparable diagnostic image quality was obtained with the PET/CT scanner. The radiotracer decay between the PET/CT and PET/MR image acquisitions was effectively compensated by the longer scanning duration and better scanner sensitivity. An example is displayed in Figure 3. Depiction of the tumor tissue was possible even in the case with diffuse astrocytoma of WHO grade II, exhibiting only slightly increased amino acid uptake (Fig. 4). The PET/MRI examinations after the injection of DOTATOC showed diagnostic imaging quality also. Images of a meningioma patient, in whom a small frontal satellite lesion is clearly visible, are shown in Figure 5.

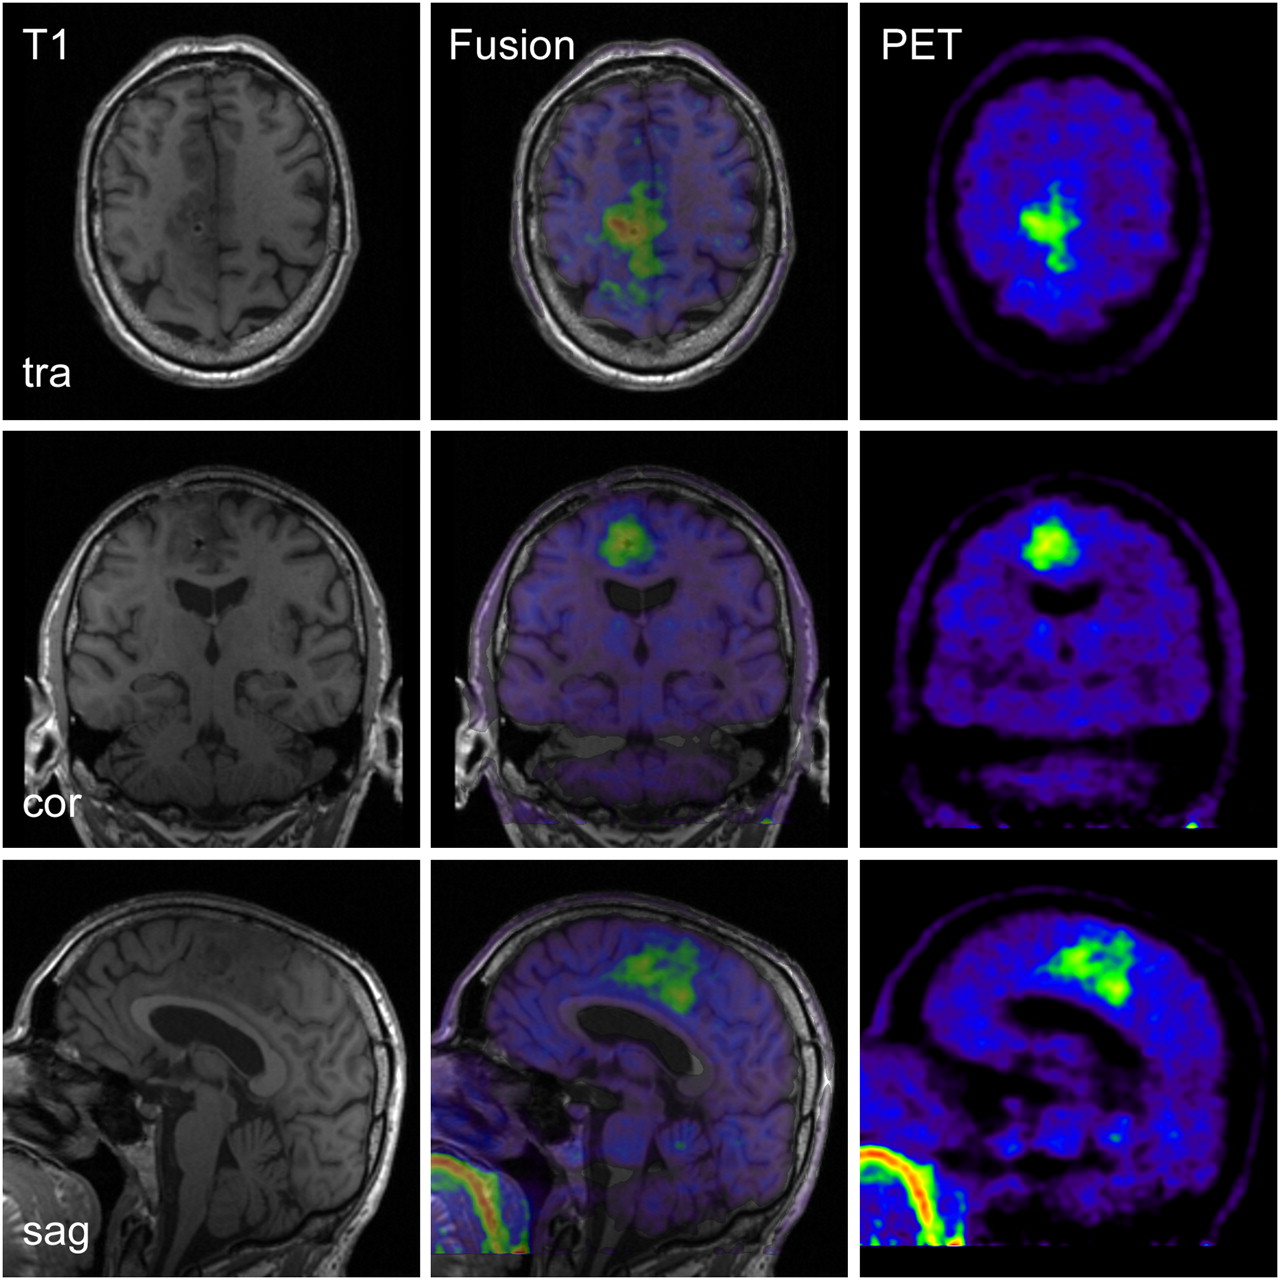
PET/MR images of 60-y-old patient with anaplastic astrocytoma (WHO grade III) with right parafalxial tumor extension (patient 4). MRI and PET datasets were simultaneously acquired. cor = coronal; sag = sagittal; tra = transversal.

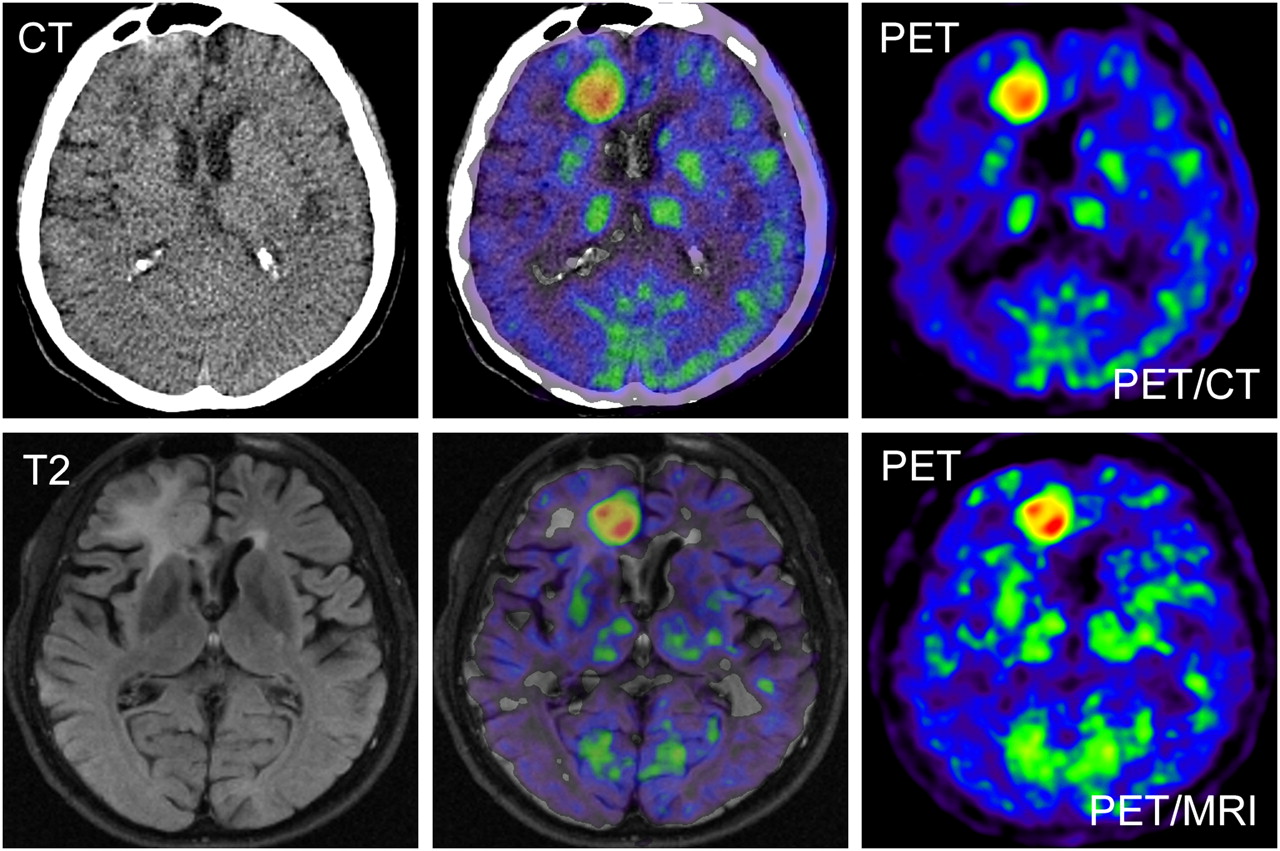
PET/CT and PET/MRI images of 56-y-old patient with glioblastoma multiforme (patient 5) on right side in frontal area close to interhemispheric fissure. (Top) PET/CT data: low-dose non–contrast-enhanced CT scan (left), corresponding fusion image (center), and 11C-methionine PET image (right). (Bottom) PET/MRI data: T2-weighted FLAIR image (left), fusion image (center), and PET image (right). PET datasets of both modalities exhibit similar diagnostic image quality.

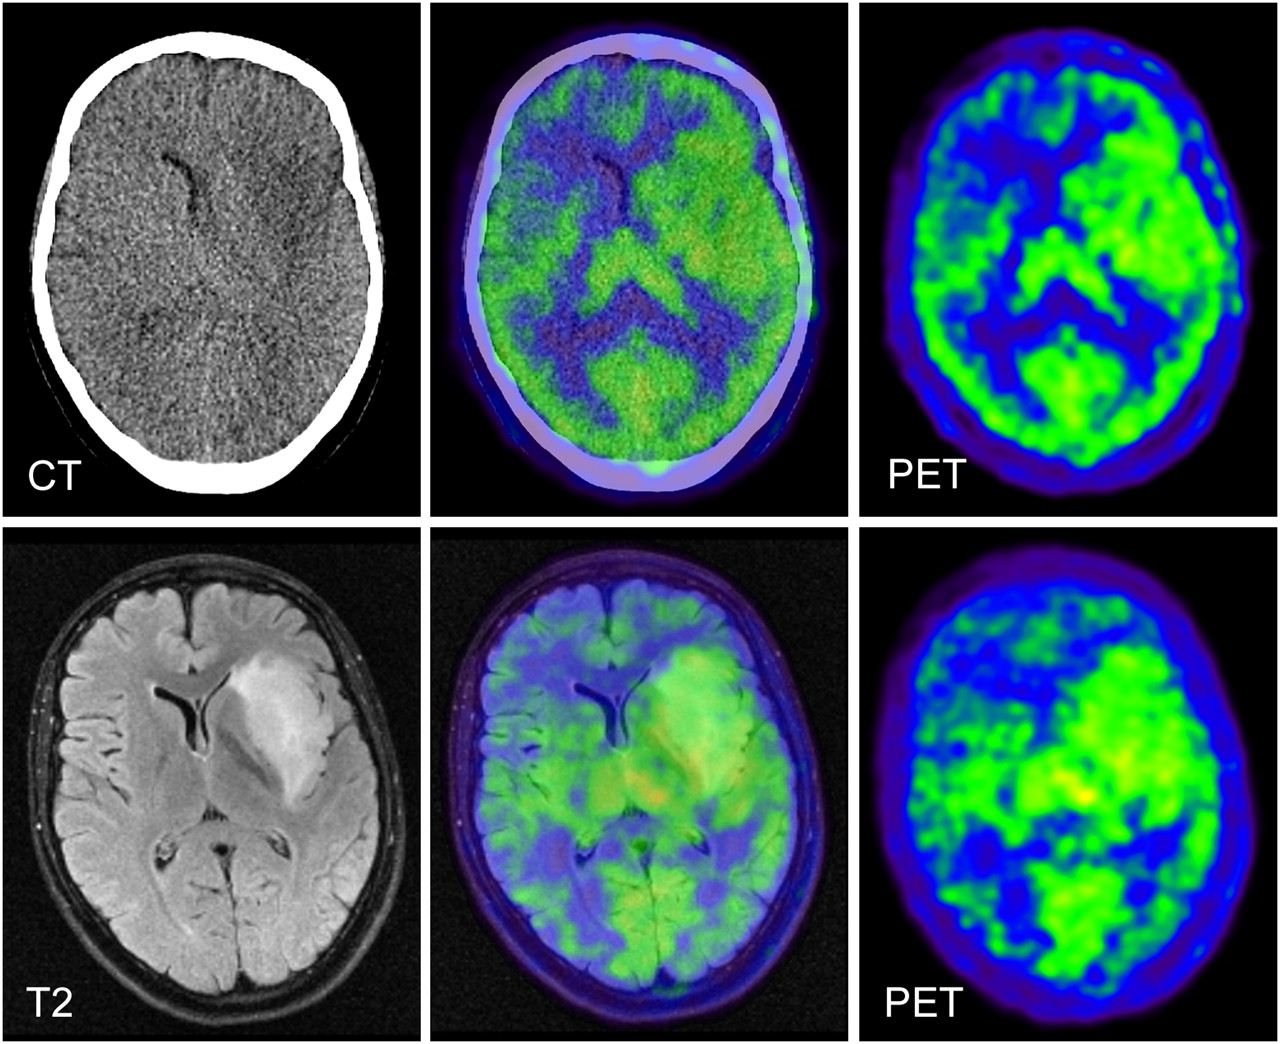
PET/MR and PET/CT images of 30-y-old patient with low-grade glioma (patient 6) extending on left side from insular cortex to temporal lobe and frontal operculum. (Top) PET/CT data: low-dose non–contrast-enhanced CT image (left), fusion image (center), and PET images (right). (Bottom) PET/MRI data: T2-weighted FLAIR image (left), fusion image (center), and 11C-methionine PET image (right). Area of increased amino acid uptake within tumor is difficult to distinguish from adjacent physiologic uptake in neighboring brain structures because of relatively low methionine uptake of this tumor.

PET/MR images of patient with meningioma (patient 9), extending from olfactory sulcus to sphenoidal and ethmoidal paranasal sinus. T2-weighted MR images are fused with 68Ga-DOTATOC PET images. In sagittal image, small satellite lesion is visible in dorsal area of frontal sinus; lower-right-side image shows enlargement of this area. This satellite lesion was detected only on PET images. Small satellite lesion was included in irradiation field. cor = coronal; sag = sagittal; tra = transversal.
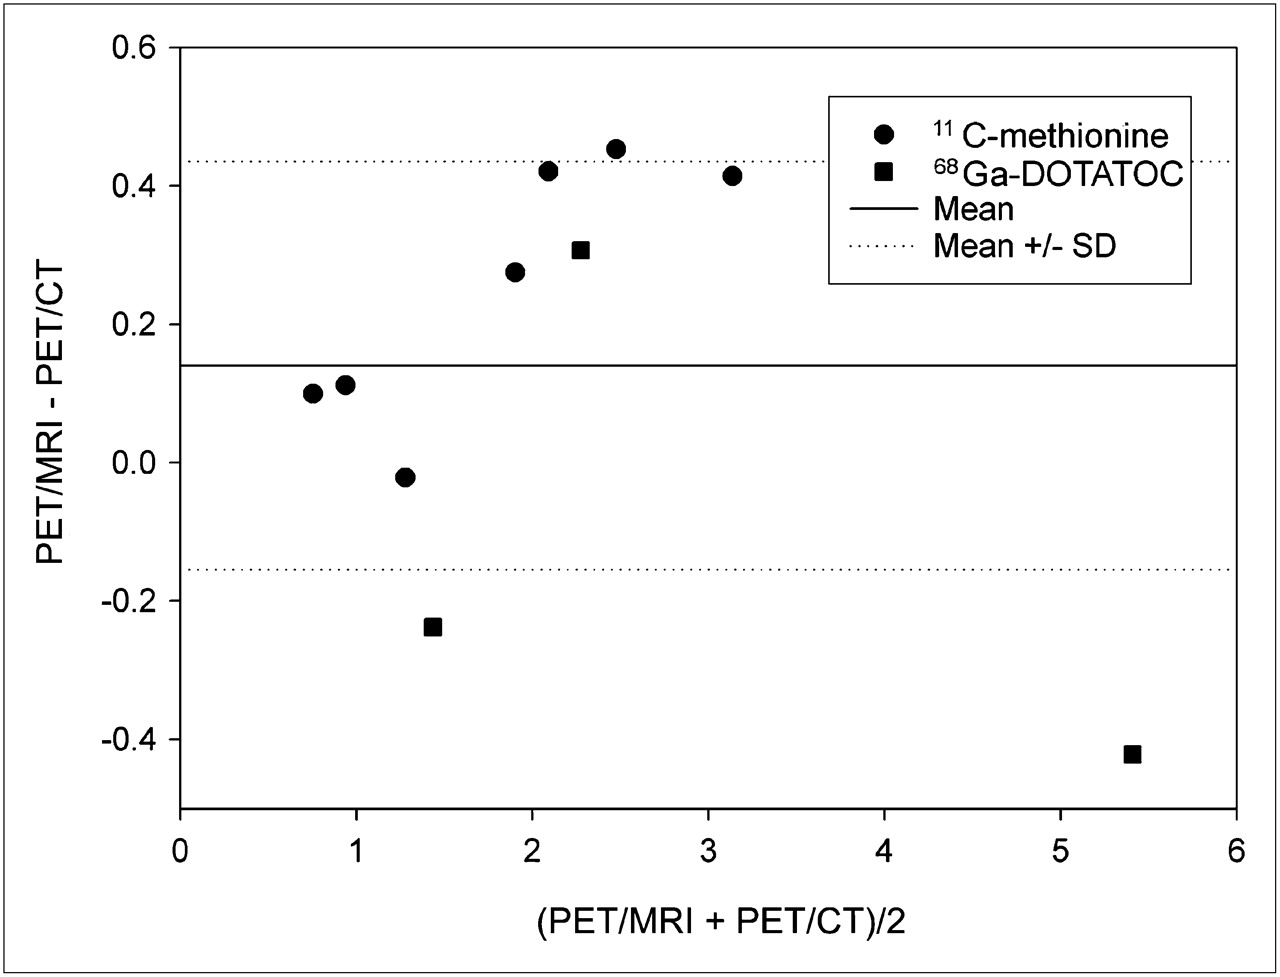
In Table 1, T/G, T/W, and G/W ratios for both modalities—PET/CT and PET/MRI—are reported for the brain tumors, and T/NM ratios are reported for the 3 meningioma patients. Comparable ratios were found for both modalities. The mean paired differences were 0.14 ± 0.30 for T/G and T/NM ratios (relative difference, 7.9% ± 12.2%), 0.25 ± 0.19 for T/G ratios alone (relative difference, 12.7% ± 7.0%), 0.07 ± 0.23 for T/W ratios (relative difference, 3.4% ± 7.5%), and −0.15 ± 0.16 for G/W ratios (relative difference, −9.4% ± 9.7%). The mean G/W ratio was 1.51 ± 0.08 for PET/MRI and 1.67 ± 0.12 for PET/CT. The correlation of T/G and T/NM ratios between the 2 modalities is displayed in Figure 6. An excellent Pearson correlation coefficient (0.98) was found for the T/G and T/NM ratios (T/G ratio alone, 0.99; T/W ratio, 0.99). The corresponding Bland–Altman plot is given in Figure 7. All measurement points of the Bland–Altman plot are within the mean ± 2 SDs. No significant difference was observed using the maximum tumor uptake values (not shown) instead of the mean tumor uptake values (data shown)—for example, the correlation coefficient of the T/G ratios was 0.97 using the maximum tumor uptake values. Tumor uptake classified as “positive” and “negative” was concordant for both scanners (PET/CT and PET/MRI) in all cases. A positive tumor uptake was found in patients 1–2, 4–6, and 8–10 and a negative uptake in patients 3 and 7.
Tumor Uptake Ratios in Comparison to Reference Regions
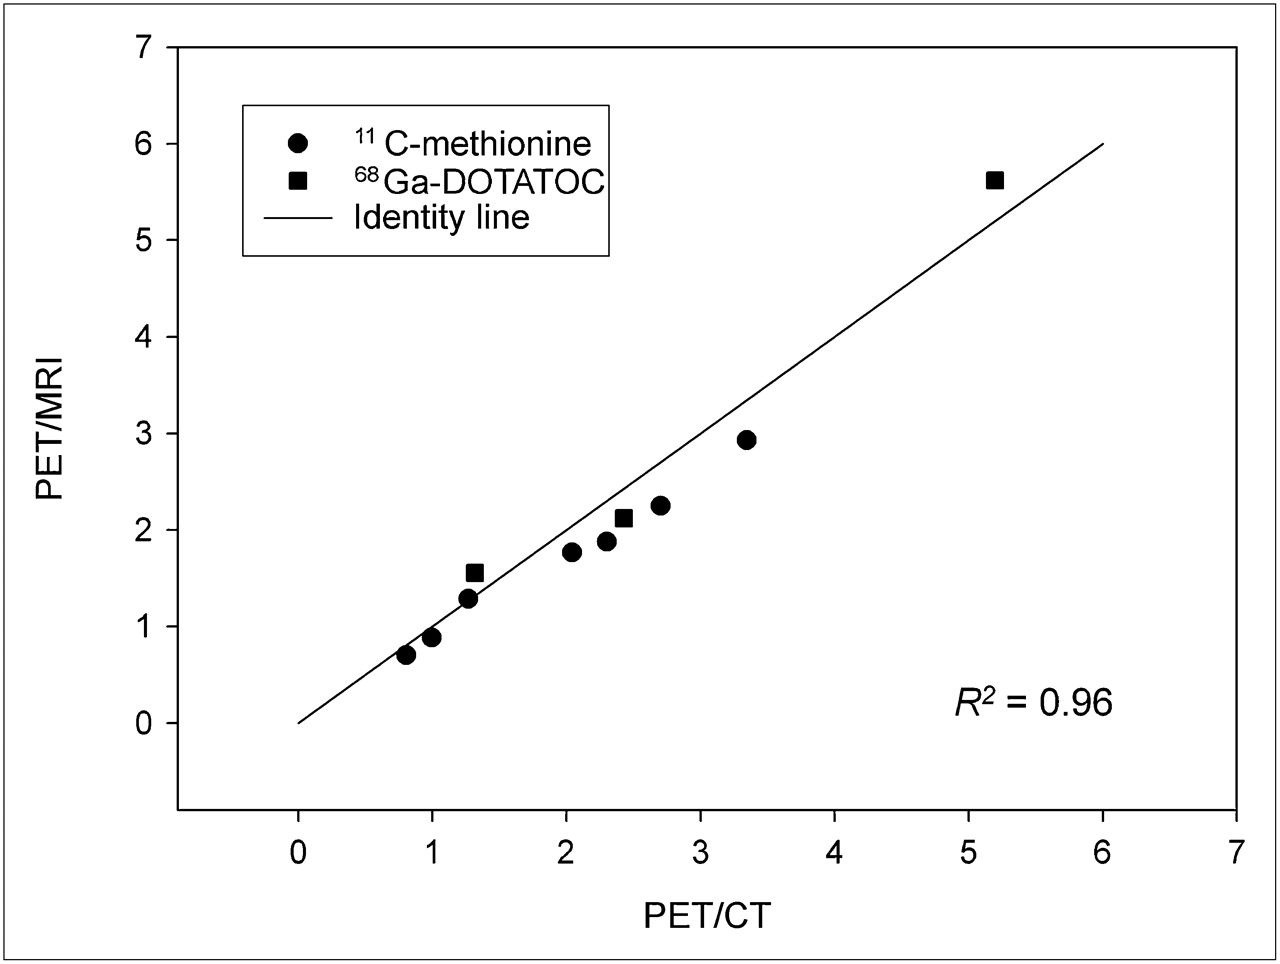
Graph displays correlation of T/G (•) and T/NM ratios (▪) of PET/CT and PET/MRI. Excellent correlation is visible with all measurement points close to identity line. Pearson correlation coefficient is 0.98 (R2 = 0.96).

Bland–Altman plot of tumor–to–reference tissue ratios is displayed. All measurement points are within 2 SDs; 3 measurement points are outside mean ± SD. Slightly higher ratios were found with PET/MRI.
The tumor volumes calculated from both PET datasets (PET/CT and PET/MRI) are given in Table 1. The tumor volumes exhibited a correlation coefficient of 0.99; no significant statistical difference was found for the tumor volumes obtained from the 2 PET systems (P > 0.05). The mean paired difference of the tumor volumes was 0.2 ± 1.3 cm3.
DISCUSSION
The combination of the structural and functional data provided by MRI with the molecular information provided by PET may increase the diagnostic accuracy over the single modalities. Simultaneous data acquisition in a hybrid PET/MRI system promises a fast, convenient workflow, with optimal temporal and spatial data coregistration.
This pilot study was designed to assess the feasibility and accuracy of a prototype hybrid PET/MRI scanner comprising lutetium oxyorthosilicate crystals coupled to avalanche photodiodes for the evaluation of patients with intracranial tumors. This is, to our knowledge, the first report that compares a hybrid PET/MRI system with a PET/CT system for this application in humans.
The clinical application of hybrid PET/MRI in patients with intracranial masses is feasible. When using the highest possible resolution of 2.5 mm in full width at half maximum of the PET insert (19), slight streak artifacts were present, best visible in the sagittal and coronal reformations. These streak artifacts are most likely due to relatively large gaps between the PET detector blocks and subsequently not yet optimized normalization procedures. In addition, the solid birdcage send–receive coil and the 8-channel receive-only coil of the MRI system, which are within the PET FOV, may add to the problem by exhibiting additional scatter and attenuation material, even though the coils are considered in the attenuation correction. Up to now, it has not been possible to completely avoid these artifacts. However, the artifacts were strongly reduced in the current study by a gaussian 3D filter (4-mm radius) applied to the PET datasets from the PET/MRI system to better match the resolution of the 2 PET systems. The prefiltered PET datasets showed image quality comparable to the PET/CT data, maintaining a similar resolution. Tumor-to-reference uptake ratios obtained from the PET insert of the PET/MRI system were comparable to those from the PET/CT system. Unfortunately, filtering of the BrainPET data results in a reduction of best-achievable spatial resolution. For many applications, for which the maximal resolution is of lesser importance, this approach is fully acceptable and the PET/MRI system may replace the PET/CT system for the evaluation of intracranial masses with 11C-methionine and 68Ga-DOTATOC. If high-resolution images are important, the streak artifacts may still pose a problem. The reconstruction and normalization algorithm applied in this study is a beta version and still under development; therefore, further reduction of imaging artifacts are expected in the future.
Uptake quantification with respect to maximum values in an ROI analysis may be affected much more by streak artifacts than ROI analysis based on average values. For not-too-small ROIs, several peaks and troughs of the artifact pattern fall within the same ROI, so the effect of the artifact averages out to a certain extent when using the mean uptake. As a downside, the mean values are sensitive to changes in the manual delineation of the ROI, so that standardized ROIs are needed for improved intra- and interindividual comparison. In some cases, an MRI-based ROI definition may be a solution that also allows for partial-volume correction of the PET uptake values. With the approach applied in this study—prefiltered image data with a 4-mm gaussian filter—the use of the maximum uptake value instead of the mean uptake value is justified because no major difference was found in the correlation coefficients calculated with the maximum uptake.
When comparing the data from the 2 systems (PET/MRI vs. PET/CT), one must keep in mind that 2 different approaches for attenuation correction have been applied: in the PET/CT component, a CT scan was used as the basis for the calculation of the attenuation map, whereas in the PET/MRI system the attenuation map was calculated from MRI data using an algorithm combining pattern recognition and atlas registration (21). The excellent correlation of the tumor ratios gives further evidence for the correctness of this approach of MRI-based attenuation correction.
The present study is limited by a study design that comprises a single radiotracer injection and sequential PET/CT and PET/MR image acquisition, which was imposed by ethical considerations at this early stage of hybrid PET/MRI evaluation. Because of the different timing of the 2 PET scans after radiotracer injection and given the tracer kinetics especially for DOTATOC, a slightly different uptake of the radiotracer is expected for the 2 scans (14,23). In addition, the omission of additional contrast-enhanced MRI sequences, also precluded by the current ethics approval, does not allow for an adequate MRI-based tumor assessment. Both limitations are of little concern for the present feasibility study; however, future studies striving to evaluate the clinical advantage of hybrid PET/MRI over conventional imaging and PET/CT, possibly with additional retrospective image fusion of PET/CT with MRI, should consider these points.
The combination of PET with MRI instead of with CT can significantly reduce the exposure to ionizing radiation during hybrid imaging. On the one hand, CT is replaced by MRI, an imaging modality not associated with ionizing radiation, even for PET attenuation-correction purposes. On the other hand, the injected amount of PET radiotracer may be reduced in many cases. PET data can be acquired throughout the MRI study, which usually takes longer than a conventional nondynamic PET protocol. Efficient strategies for head-movement detection and PET image correction may be needed to cope with the more likely head movement during the longer data acquisition time.
CONCLUSION
Our study indicates that hybrid PET/MRI of intracranial tumors using 11C-methionine or 68Ga-DOTATOC can be reliably performed. The image quality and quantitative data achieved using PET/MRI is similar to that using PET/CT. In addition, the combination of PET with MRI instead of CT offers many advantages such as higher soft-tissue contrast; reduced radiation exposure; and advanced MRI techniques such as perfusion imaging, diffusion imaging, and MR spectroscopy. In the future, reliable and fast partial-volume and motion correction methods may be implemented to significantly improve PET quantitation accuracy using the optimally coregistered MRI data.
Acknowledgments
We thank the staff of the cyclotron and radiochemistry facilities of Tübingen University and all contributing members of Siemens Healthcare for the continued support. Furthermore, we acknowledge Heinz-Peter Schlemmer, Thomas Nägele, Roland Bares, and Frédéric Mantlik for their contributions. Financial research support was provided through the Deutsche Forschungsgemeinschaft (grants PI771/5-1 and PI771/1-1, and SFB 656 Münster, projects C6 and PM3) and the Swiss Werner Siemens-Foundation. Part of this work was supported by the Herzzentrum Münster e.V. (travel grant).
Footnotes
↵* Contributed equally to this work.
- © 2010 by Society of Nuclear Medicine
REFERENCES
- Received for publication January 7, 2010.
- Accepted for publication April 8, 2010.


Jump to section
Related Articles
Cited By...
- Improved Detection of Transosseous Meningiomas Using 68Ga-DOTATATE PET/CT Compared with Contrast-Enhanced MRI
- 68Ga-PSMA-PET/CT Has a Role in Detecting Prostate Cancer Lesions in Patients with Recurrent Disease
- Multimodality Brain Tumor Imaging: MR Imaging, PET, and PET/MR Imaging
- Systematic Comparison of the Performance of Integrated Whole-Body PET/MR Imaging to Conventional PET/CT for 18F-FDG Brain Imaging in Patients Examined for Suspected Dementia
- Application of FDG-PET in Cervical Cancer and Endometrial Cancer: Utility and Future Prospects
- Combined 18F-Fluoride and 18F-FDG PET/CT Scanning for Evaluation of Malignancy: Results of an International Multicenter Trial
- Comparison of Segmentation-Based Attenuation Correction Methods for PET/MRI: Evaluation of Bone and Liver Standardized Uptake Value with Oncologic PET/CT Data
- First Clinical Experience with Integrated Whole-Body PET/MR: Comparison to PET/CT in Patients with Oncologic Diagnoses
- Variable Lung Density Consideration in Attenuation Correction of Whole-Body PET/MRI
- Oncologic PET/MRI, Part 1: Tumors of the Brain, Head and Neck, Chest, Abdomen, and Pelvis
- Introducing Parametric Fusion PET/MRI of Primary Prostate Cancer
- Hyperpolarized Magnetic Resonance: A Novel Technique for the In Vivo Assessment of Cardiovascular Disease
- Multimodality Assessment of Brain Tumors and Tumor Recurrence