


Abstract
A recently developed camera system for high-speed SPECT (HS-SPECT) myocardial perfusion imaging shows excellent correlation with conventional SPECT. Our goal was to test the diagnostic accuracy of an automated quantification of combined upright and supine myocardial SPECT for detection of coronary artery disease (CAD) (≥70% luminal diameter stenosis or, in left main coronary artery, ≥50% luminal diameter stenosis) in comparison to invasive coronary angiography (ICA). Methods: We studied 142 patients undergoing upright and supine HS-SPECT, including 56 consecutive patients (63% men; mean age ± SD, 64 ± 13 y; 45% exercise stress) without known CAD who underwent diagnostic ICA within 6 mo of HS-SPECT and 86 consecutive patients with a low likelihood of CAD. Reference limits for upright and supine HS-SPECT were created from studies of patients with a low likelihood of CAD. Automated software adopted from supine–prone analysis was used to quantify the severity and extent of perfusion abnormality and was expressed as total perfusion deficit (TPD). TPD was obtained for upright (U-TPD), supine (S-TPD), and combined upright–supine acquisitions (C-TPD). Stress U-TPD ≥ 5%, S-TPD ≥ 5%, and C-TPD ≥ 3% myocardium were considered abnormal for per-patient analysis, and U-TPD, S-TPD, and C-TPD ≥ 2% in each coronary artery territory were considered abnormal for per-vessel analysis. Results: On a per-patient basis, the sensitivity was 91%, 88%, and 94% for U-TPD, S-TPD, and C-TPD, respectively, and specificity was 59%, 73%, and 86% for U-TPD, S-TPD, and C-TPD, respectively. C-TPD had a larger area under the receiver-operating-characteristic curve than U-TPD or S-TPD for identification of stenosis ≥ 70% (0.94 vs. 0.88 and 0.89, P < 0.05 and not significant, respectively). On a per-vessel basis, the sensitivity was 67%, 66%, and 69% for U-TPD, S-TPD, and C-TPD, respectively, and specificity was 91%, 94%, and 97% for U-TPD, S-TPD, and C-TPD, respectively (P = 0.02 for specificity U-TPD vs. C-TPD). Conclusion: In this first comparison of HS-SPECT with ICA, new automated quantification of combined upright and supine HS-SPECT shows high diagnostic accuracy for detecting clinically significant CAD, with findings comparable to those reported using conventional SPECT.
Several dedicated hardware camera systems with optimized acquisition geometry, collimator design, and associated reconstruction software have been recently introduced by various vendors (Cardius XPO [Digirad, Inc.]; CardiArc [CardiArc]; and D-SPECT [Spectrum-Dynamics]) (1). The D-SPECT, for high-speed SPECT (HS-SPECT) using cadmium-zinc-telluride (CZT) detectors and rotating detector columns (2–4), has been validated by comparison to conventional Anger camera imaging for rest–stress myocardial perfusion SPECT (MPS) (3,5). This technology has been shown to provide an 8- to 10-fold increase in sensitivity, coupled with a 2-fold improvement in spatial resolution, enabling a significant reduction in imaging time and dose of radiopharmaceutical (1,2,4). In a recent multicenter clinical trial, HS-SPECT has been shown to correlate well with conventional SPECT for rest–stress myocardial perfusion and function (5). However, to date, there have been no studies comparing the diagnostic accuracy of HS-SPECT for detecting physiologically significant coronary artery disease (CAD) with invasive coronary angiography (ICA).
We have previously developed and validated a quantification scheme in which reference limits are derived from patients with a low likelihood (LLk) of CAD without requiring optimization of regional thresholds by expert visual scoring (6). We have additionally implemented and validated an automated approach for quantification of MPS by integrating datasets acquired in both supine and prone positions (7). Unlike conventional MPS, HS-SPECT is performed with the patient in a semirecumbent upright position and, if desired, in the supine position. In this study, we sought to develop an automated approach to quantify total perfusion deficit (TPD), a computer-derived measure of the extent and severity of a perfusion defect, for combined upright–supine MPS using HS-SPECT and to assess the diagnostic accuracy of combined upright–supine quantification as compared with upright-alone or supine-alone quantification for the detection of hemodynamically significant CAD as defined by ICA in patients without a previous history of CAD.
MATERIALS AND METHODS
Total Study Population
The total study population consisted of 142 patients who underwent rest–stress HS-SPECT with rest–stress 99mTc-sestamibi (5) or stress 201Tl–rest 99mTc-sestamibi MPS (8) performed in both upright and supine positions at the Cedars-Sinai Medical Center. All patients provided written informed consent for the use of their clinical and imaging data for research purposes.
Angiographic Validation.
For comparison of HS-SPECT with ICA, we included 56 consecutive patients (35 men, 21 women) who had ICA within 6 mo of rest–stress HS-SPECT after rest–stress 99mTc-sestamibi (n = 39) or stress 201Tl–rest 99mTc-sestamibi (n = 17) MPS. The included patients had no prior myocardial infarction or coronary revascularization, nonischemic cardiomyopathy or valvular heart disease, or change in symptoms between MPS and ICA (Table 1). The mean age (±SD) was 64 ± 13 y, and mean body mass index was 28 ± 7 kg/m2 (range, 19–53 kg/m2). Four patients had typical angina, 31 had atypical angina, and 5 had shortness of breath. Exercise stress was used in 25 (45%) patients, all of whom achieved the maximal target heart rate during exercise. An ischemic electrocardiogram response was noted in 17 patients who underwent exercise stress and in 2 patients who underwent vasodilator stress. The average time between HS-SPECT and ICA was 23 ± 30 d.
Characteristics of Patients with ICA
Creation of Reference Limits.
For generation of reference limits for perfusion by HS-SPECT, we included 86 patients who had an LLk of CAD (<15%) based on age, sex, symptoms, coronary risk factor, and the results of treadmill stress testing at the time of MPS (9): rest–stress 99mTc-sestamibi (n = 60) or stress 201Tl–rest 99mTc-sestamibi (n = 26). Patients did not have angina, shortness of breath, an abnormal resting electrocardiogram, or an abnormal stress electrocardiogram response. Additionally, as per previous practice in generating reference limits (6), the patients had normal rest and poststress HS-SPECT findings on visual assessment of upright and supine images (visual summed score < 3). In the rest–stress 99mTc-sestamibi population, sex-specific reference limits for both upright and supine acquisitions were derived from a group of 60 patients (30 men, 30 women) with an LLk of CAD. In the stress 201Tl–rest 99mTc-sestamibi population, sex-specific reference limits for both upright and supine acquisitions were derived from a group of 26 patients (15 men, 11 women) with an LLk of CAD (Table 2).
Characteristics of Patients with LLk of CAD
Imaging and Stress Protocols
Patients were instructed to abstain from any products containing caffeine for 24 h before the test. β-blockers and calcium-channel antagonists were terminated 48 h before testing, and nitrates were withheld for at least 6 h before testing. Stress testing was performed with a symptom-limited Bruce treadmill exercise protocol or vasodilator protocol, as described previously (10,11). For adenosine stress, adenosine was infused at 140 μg/kg/min for 5 min and, when possible, low-level adjunctive treadmill exercise was performed during adenosine infusion (12). A 12-lead electrocardiogram was monitored continuously during stress testing. An ischemic stress electrocardiogram response of ≥1 mm horizontal or downsloping ST-segment depression or ≥1.5 mm upsloping was considered positive for ischemia.
Rest–Stress 99mTc-Sestamibi Protocol.
For the rest–stress 99mTc-sestamibi protocol (5), a weight-adjusted dose of 99mTc-sestamibi (296–333 MBq [8–9 mCi]) was injected at rest. A 4-min rest image was acquired with the patient upright, beginning at 30–60 min after injection, followed by a 4-min supine acquisition. Patients then underwent symptom-limited standard exercise treadmill testing or adenosine stress with injection of a weight-adjusted dose of 99mTc-sestamibi (1,332–1,480 MBq [36–40 mCi]) at the time of peak stress. Beginning 15–30 min after stress injection, 2-min images were obtained with the patient first in the upright and then in the supine position (5).
Stress 201Tl–Rest 99mTc-Sestamibi Protocol.
For the stress 201Tl–rest 99mTc-sestamibi protocol (8), patients were injected with 201Tl at peak stress. The specific weight-based dose regimen used was to inject 74 MBq (2 mCi) in patients ≤225 lbs and 92.5 MBq (2.5 mCi) in patients >225 lbs. Beginning approximately 10 min after exercise stress or 1 min after adenosine stress, a 6-min supine image was acquired, followed by a 6-min upright acquisition. Subsequently, without moving the patient from the imaging chair, 99mTc-sestamibi was injected (296 MBq [8 mCi] in patients ≤225 lbs and 370 MBq [10 mCi] in patients >225 lbs), and beginning 2 min after injection, a 4-min rest upright image was acquired, followed by a 4-min supine rest acquisition (8).
HS-SPECT Scanner and Imaging Method
The HS-SPECT system uses 9 collimated, pixilated CZT detector columns, mounted vertically in a 90° geometry (2–4). Each of the columns consists of 1,024 (16 × 64) 5-mm-thick CZT elements (2.46 × 2.46 mm). Square-hole tungsten collimators are fitted to each of the detectors, with the size of the collimator holes matching the dimensions of the detector elements. Scintigraphic data are acquired by the detector columns rotating in synchrony, focusing on the region of interest (the heart), and are saved in list mode along with R-wave markers. Before imaging in both the upright and the supine positions, the detector was positioned parallel to the patient's chest, with care taken to align the heart in the center of the field of view. A 10-s prescan image was acquired at the beginning of each imaging session to identify the location of the heart within the chest and to set the angle limits of scanning (center of the region of interest) for each detector. Each image set was acquired with 120 projections per detector for the supine and upright positions. Transaxial images were generated using a proprietary Broadview reconstruction algorithm (Spectrum-Dynamics), based on the maximum-likelihood expectation maximization method (4). No attenuation or scatter correction was applied. Images were then reoriented into short-axis and vertical and horizontal long-axis slices using standard software (QPS; Cedars-Sinai Medical Center).
Automated Quantification of SPECT Myocardial Perfusion Imaging (MPI)
We have previously shown higher accuracy by combining supine and prone images than using supine images alone for the detection of CAD with conventional SPECT (7). Because prone imaging is not possible with HS-SPECT, we used both upright and supine imaging, with the supposition that soft-tissue attenuation or patient motion artifacts would potentially create attenuation artifacts in only 1 of the acquisitions or in separate regions of the myocardium and would hence allow us to distinguish artifacts from true perfusion defects. Upright and supine images were quantified separately using their respective upright and supine reference limits, and all MPS studies were quantitatively reanalyzed using automatic computer analysis (6). Automatically generated myocardial contours were evaluated by an experienced imaging cardiologist without knowledge of any clinical data, and when necessary, contours were adjusted to correspond to the myocardium (13% of cases). The quantitative perfusion variable used was the TPD, which reflects a combination of both the defect severity and the extent of the defect in 1 parameter, as previously described (6). Stress perfusion defects on HS-SPECT were assessed by quantification of the TPD (13,14).
Combined Upright–Supine Quantification.
In addition to deriving separate TPD measures for upright TPD (U-TPD) and supine TPD (S-TPD), we applied a combined quantification approach to obtain upright–supine TPD (C-TPD) values. C-TPD is calculated by limiting the TPD computation from the supine polar map to pixels that have been quantified as abnormal on upright images (mean absolute deviation > 3.0). The same threshold (mean absolute deviation > 3.0) is used for supine images but only in locations determined to be abnormal on upright images; locations quantified as normal by upright imaging were not considered. Therefore, C-TPD represents the magnitude of perfusion defect seen on both supine and upright images in the same location and is analogous to the TPD derived from standard supine and prone images that we have previously described for conventional SPECT (7). The C-TPD parameter was expressed in the same units (percentage of the myocardium) as in the separate supine and upright TPD measurements. In determining the optimal cutoff for TPD, we considered the threshold for which 95% of the patients used to generate reference limits continued to remain in the normal perfusion category. The resultant thresholds of U-TPD ≥ 5%, S-TPD ≥ 5%, and C-TPD ≥ 3% are in agreement with previously established thresholds for combined TPD quantification (7). For per-vessel analysis, we used the previously established threshold (≥2% for TPD measurements) (6,15,16) for quantitative measurement in each coronary artery territory. Defects in the anterior and septal walls were allocated to the left anterior descending coronary artery; in the lateral wall to the left circumflex coronary artery; and in the inferior wall to the right coronary artery.
ICA Analysis
All invasive coronary angiograms were interpreted visually by experienced cardiologists who were unaware of MPS results. Patients did not have myocardial infarction or revascularization in the interval between MPS and ICA. A ≥70% luminal diameter stenosis was considered hemodynamically significant, except for the left main coronary artery, for which stenosis was defined as ≥50%. Patients with left main CAD were considered to have stenosis in both the left anterior descending coronary and left circumflex coronary arteries.
Statistical Analysis
Statistical analyses were performed using software(Analyze-It, version 2.12; Analyze-It Software, Ltd.). All continuous variables were described as mean ± SD. For all datasets, the Shapiro–Wilk test was used for normality. Datasets did not require any adjustment to convert them to a reference distribution. Unpaired t tests were used to compare differences in unpaired continuous data for reference database variation, using P < 0.01 as a cutoff. The receiver-operating-characteristic (ROC) curve analysis was performed to evaluate the ability of the quantification to predict ≥70% stenoses of coronary arteries. ROC curves were created using a step of 0.1% for the TPD values, and the differences between ROC curve areas (area ± SE) were compared. Sensitivity and specificity between different types of acquisitions were compared using a paired McNemar test. In terms of the individual coronary territories, sensitivity and specificity were calculated at a cutoff point disease severity of 70% luminal diameter narrowing on ICA.
RESULTS
Reference Limits
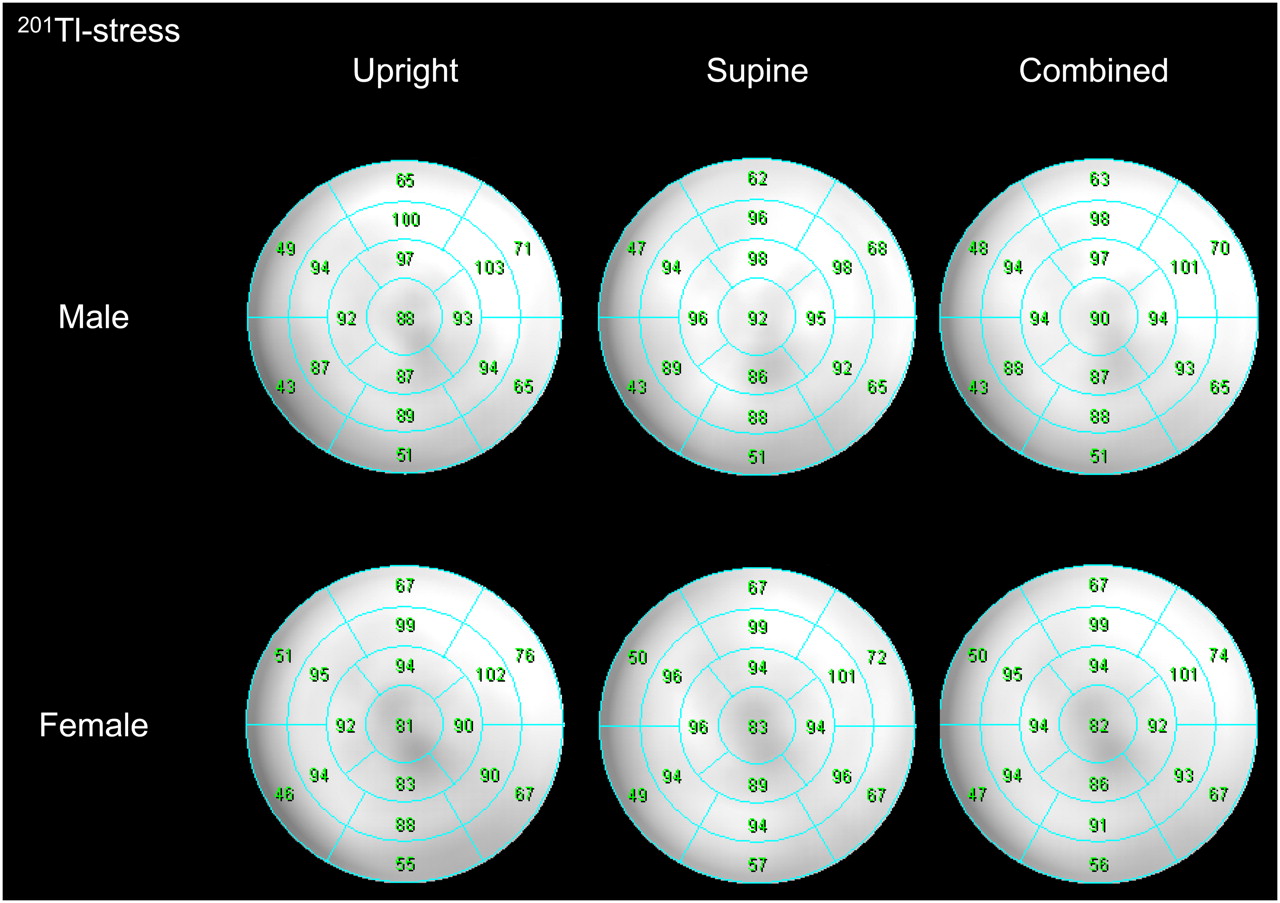
The average count distributions derived from 30 male and 30 female patients with an LLk of CAD who underwent the stress 99mTc-sestamibi protocol are presented in Figure 1, using a polar map display for men and women. Ranges of segmental average deviations in men were 5.1%–8.5% for upright, 5.3%–8.2% for supine, and 5.2%–8.4% for combined databases, and in women they were 5.9%–9.1% for upright, 5.8%–9.0% for supine, and 5.9%–8.8% for combined databases. Figure 2 shows the average count distributions derived from 15 men and 11 women with an LLk of CAD who underwent the stress 201Tl protocol. Ranges of segmental average deviations in men were 6.0–8.6 for upright, 6.4%–8.3% for supine, and 6.6%–8.4% for combined databases, and in women they were 5.9%–9.4% for upright, 5.2%–10.0% for supine, and 5.7%–9.2% for combined databases. The normalized segmental myocardial uptake between upright and supine in any of the 17 segments for either men or women for either the 201Tl or the 99mTc-sestamibi protocol did not differ significantly. Because there were no significant differences between upright and supine limits, we have combined them and generated universal limits for the analysis of upright, supine, and combined data. These combined limits are shown in Figures 1 and 2 for rest–stress 99mTc-sestamibi and stress 201Tl–rest 99mTc-sestamibi protocols. The combined upright–supine limits were subsequently used to identify perfusion defects (expressed as TPD) in the patients who underwent HS-SPECT and ICA.

Polar maps for stress 99mTc-sestamibi perfusion imaging of LLk men (n = 30) and women (n = 30) show segmental comparison of sex-dependent upright, supine, and combined mean reference perfusion distribution. Average myocardial uptake between supine and upright in any of 17 segments for either men or women did not differ significantly.

Polar maps for stress 201Tl perfusion imaging of LLk men (n = 15) and women (n = 11) show segmental comparison of sex-dependent upright, supine, and combined mean reference perfusion distribution. Average myocardial uptake between supine and upright in any of 17 segments for either men or women did not differ significantly.
ICA Findings
There were 34 patients with and 22 patients without obstructive coronary artery stenosis (Table 3). Regarding the distribution of significant stenoses, the numbers of left main, left anterior descending coronary artery , left circumflex coronary artery, and right coronary artery lesions were 3, 28, 15, and 15, respectively.
ICA Findings
TPD from Upright, Supine, and Combined Quantitative Analysis
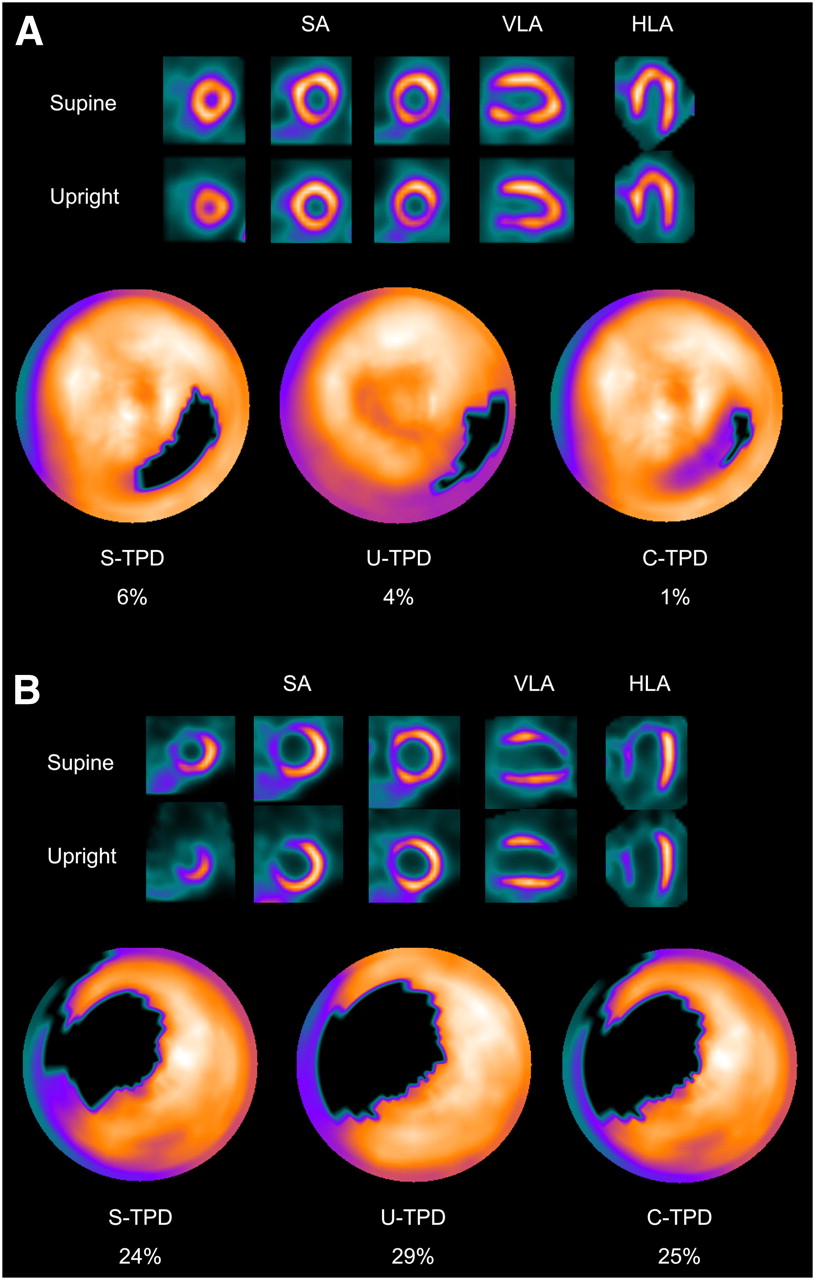
Of the 56 patients who underwent HS-SPECT and ICA, 40 patients had perfusion defects with U-TPD ≥ 5% on, 36 had defects with S-TPD ≥ 5%, and 35 had defects with C-TPD ≥ 3%. Examples of combined upright–supine stress images of the rest–stress 99mTc-sestamibi protocol are shown in Figures 3A and 3B. Figure 3A shows a patient with normal coronary angiography findings who demonstrated a basal–to–mid inferolateral wall defect on supine images and quantification and an inferolateral wall defect on prone images and quantification, with no significant defect detected by combined quantification. Figure 3B shows a patient with left anterior descending coronary artery disease who showed an anteroseptal wall defect on both supine and upright images that was detected by supine, upright, and combined quantification.

(A) Example of inferolateral wall supine and upright MPS artifact images from 49-y-old woman with typical chest pain and known hypertension, diabetes, hypercholesterolemia, and family history of premature CAD. Images are displayed in 3 short-axis views and in vertical and horizontal long-axis views. Electrocardiogram response to exercise was nonischemic for ST-segment depression. Poststress supine and upright images show reduced uptake of radiotracer in inferolateral wall (top and middle rows). Blackout maps (bottom row) give quantification results of 4% for U-TPD and 6% for S-TPD. When supine and upright images are combined, only a small defect is visualized on black-out map, with C-TPD of 1%. Subsequent coronary angiogram showed no significant stenosis. (B) Example of true anteroseptal wall defect on supine and upright MPS images from 43-y-old man with typical chest pain and known hypercholesterolemia. Electrocardiogram response to exercise was ischemic for ST-segment depression, and subsequent coronary angiogram revealed severe stenosis of proximal left anterior descending coronary artery. Both supine and upright images show apparent anteroseptal wall perfusion abnormality, and U-TPD, S-TPD, and C-TPD are 29%, 24%, and 25%, respectively. Defects are visualized on black-out maps. HLA = horizontal long axis; SA = short axis; VLA = vertical long axis.
ROC Curve Analysis
ROC curves for the detection of CAD by TPD measurements derived from upright, supine, and combined upright–supine datasets are shown in Figure 4. The areas under the ROC curves for U-TPD, S-TPD, and C-TPD were 0.88 ± 0.05, 0.89 ± 0.04, and 0.94 ± 0.03, respectively. The area under the ROC curve for C-TPD was significantly higher than that for U-TPD (P < 0.05). There was no significant difference in the area under the ROC curves between C-TPD and S-TPD or between U-TPD and S-TPD. As shown in Figure 5, the sensitivity was relatively unchanged among U-TPD, S-TPD, and C-TPD (not significant). On the other hand, specificity was significantly different among U-TPD, S-TPD, and C-TPD (P = 0.02 for C-TPD vs. S-TPD, and P < 0.0001 for C-TPD vs. U-TPD). When the analysis was performed separately for 2 different MPS protocols, the sensitivity was 92%, 92%, and 92% for U-TPD, S-TPD, and C-TPD, and specificity was 73%, 73%, and 87% for U-TPD, S-TPD, and C-TPD, respectively, with the rest–stress 99mTc-sestamibi protocol. The sensitivity was 100%, 80%, and 100% for U-TPD, S-TPD, and C-TPD, and specificity was 57%, 71%, and 86% for U-TPD, S-TPD, and C-TPD with the stress 201Tl–rest 99mTc-sestamibi protocol.

ROC curves for detection of CAD by measurements of U-TPD, S-TPD, and C-TPD in angiographic population (n = 56). Percentage TPD was compared with presence or absence of hemodynamically significant CAD as observed by ICA. U-TPD ≥ 5%, S-TPD ≥ 5%, and C-TPD ≥ 3% were used as cutoff points.
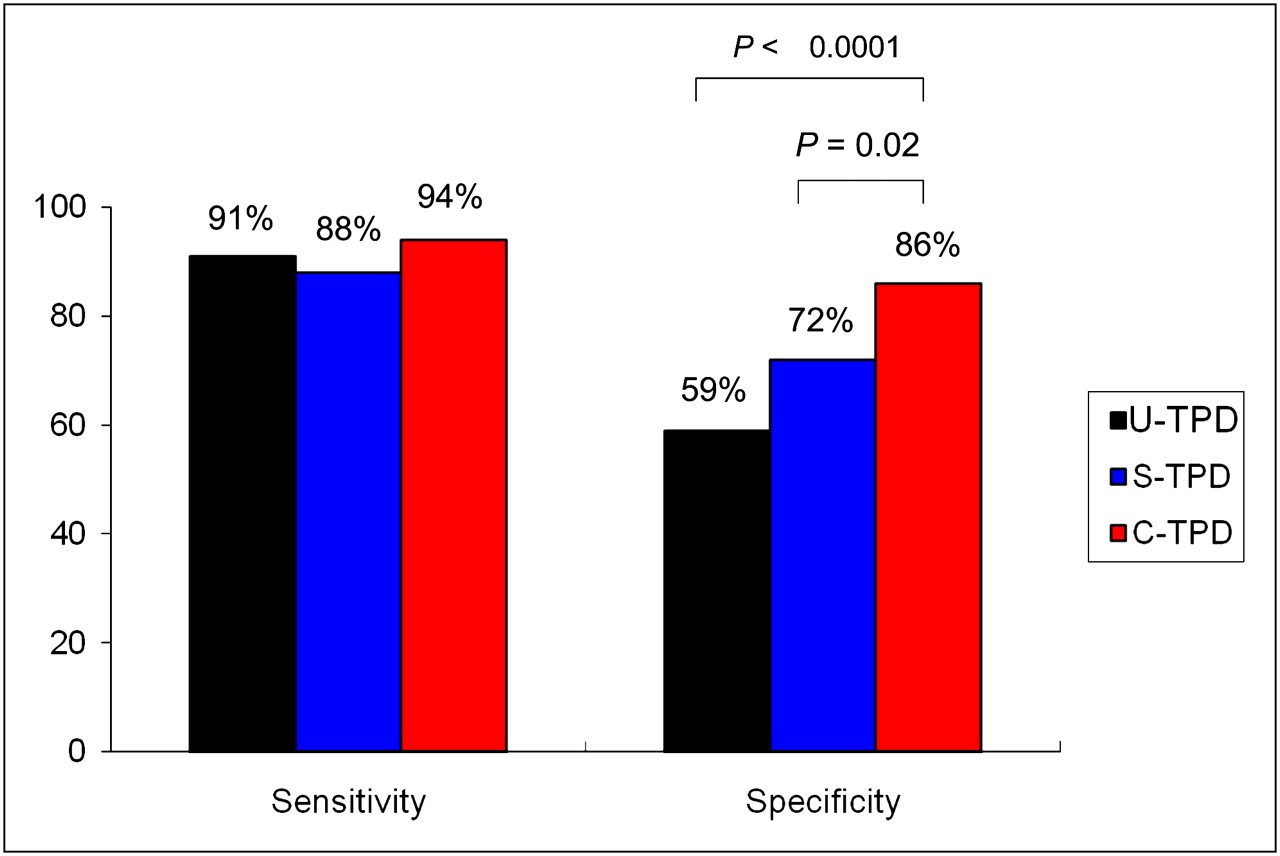
Sensitivities and specificities for detection of CAD by U-TPD, S-TPD, and C-TPD in angiographic population (n = 56).
Per-Vessel Analysis
On a per-vessel basis, using a TPD of ≥ 2% for the detection of significant stenosis, the sensitivity and specificity were 67% and 91% with upright images, 66% and 94% with supine images, and 69% and 97% with combined upright–supine images. The sensitivity was relatively unchanged among U-TPD, S-TPD, and C-TPD (not significant), although specificity was significantly different between U-TPD and C-TPD (P = 0.02).
DISCUSSION
This is the first report, to our knowledge, evaluating the diagnostic accuracy of HS-SPECT MPI for the detection of hemodynamically significant coronary artery stenosis, compared with ICA. In addition, it is the first report of the use of upright–supine imaging for these types of new HS-SPECT devices and the first report of combined automated quantification of such data as a method for eliminating attenuation artifacts related to patient positioning. We observed that with the combined upright–supine approach, the sensitivity for detection of CAD was 94% and that specificity for the absence of CAD was 86%. For individual coronary territories, we found a sensitivity and specificity of 70% and 97%, respectively. The results were comparable to those found using the rest–stress 99mTc-sestamibi or stress 201Tl–rest 99mTc-sestamibi protocols. These findings compare favorably with the results of MPS using the conventional Anger scintillation camera.
Comparison with Prior Studies
There is extensive literature on the diagnostic accuracy of conventional stress MPS in comparison with ICA. The overall sensitivity of exercise and vasodilator stress perfusion SPECT for the detection of angiographically significant (≥50% stenosis) CAD was 87% and 89%, respectively, and specificity was 73% and 75%, respectively (17). Prior studies that applied the automated TPD quantification of our study to Anger-camera MPS found an 85% sensitivity and 65% specificity for supine imaging (area under the ROC curve, 0.86 ± 0.02) and an 85% sensitivity and 86% specificity for combined supine–prone imaging (area under the ROC curve, 0.90 ± 0.02). Our results with HS-SPECT are similar to the results of these prior studies (7). On a per-vessel basis, prior studies have reported that the sensitivity and specificity were 79% and 76%, respectively, with supine images (6). Our results are comparable to these findings.
Quantitative Analysis
We used quantitative analysis for the interpretation of the MPS studies. Quantitative analysis eliminates observer variability and bias and has been shown to be useful in comparing sequential MPI studies (13,18) and assessing the effectiveness of invasive and medical treatments in patients with CAD (14). Quantitative analysis also provides an approach that might be more generalizable to other centers not dependent on the expertise of the interpreter for analysis with the new γ-camera.
Upright and Supine Imaging
We have previously shown that detection of CAD is more accurate with combined supine and prone MPS than with supine imaging alone. With the HS-SPECT system, prone imaging is not possible. We initially introduced the combined upright and supine imaging protocol when comparing the 2 stress 201Tl–rest 99mTc-sestamibi and rest–stress 99mTc-sestamibi protocols for the new fast cameras; however, these image pairs were analyzed only visually in that study (8). In comparison to prone–supine imaging using conventional cameras, the combined upright–supine imaging may be more practical using the new HS-SPECT devices, because the imaging times are much shorter. In addition, we have found that all patients tolerated the upright–supine, whereas some patients cannot tolerate prone imaging.
We have previously developed automated combined supine–prone analysis (7) and showed increased specificity for the diagnosis of CAD by that method. Here, the same concept of requiring the pixel location at both locations to be abnormal has been applied to the analysis of upright–supine data. However, in contrast to the difference in reference limits for prone and supine data, we have shown that the reference limits are similar for upright and supine data (7), likely because of the lower variability between upright and supine positions. Therefore, we were able to use the same (combined) reference limits for both upright and supine but still required the abnormality to be present on both scans in the same location. This technique allows avoidance of artifacts, which can be present on one or the other scan and result in false-positive quantification. Naturally, reference thresholds obtained by such analysis are lower than those obtained in separate analysis because defect collocation is not perfect. With the lower abnormality threshold, the sensitivity of the test is preserved while the specificity is significantly improved.
Study Limitations
The study was performed at a single center, and whether our findings may be applicable to other centers will require further investigation; however, the use of automated quantitative analysis increases the likelihood that the results of our study could be replicated elsewhere. Data from 2 different protocols, rest–stress 99mTc-sestamibi and stress 201Tl–rest 99mTc-sestamibi MPS, were combined; however, there was no significant difference in the sensitivity and specificity of HS-SPECT when these datasets were analyzed individually or when they were combined. Our study was a retrospective analysis of patients who had undergone HS-SPECT and ICA within 6 mo. Although this duration between studies was fairly long, the mean duration between studies was 23 d and 73% of patients underwent both studies within 4 wk. Moreover, patients considered for analysis did not have a change in clinical status between the studies. The ICA was performed for clinical purposes. This practice results in a selection bias, because patients with abnormal SPECT findings are more likely to be referred for ICA. The number of studies was limited because of the novelty of the imaging protocols; however, significant differences were demonstrated in the specificity and increased area of the ROC curve for the combined (upright and supine) analysis. The exact cutoff point for optimal specificity is difficult to establish because of the few angiographically normal cases (n = 22), and we chose to use an LLk population to establish the reference thresholds. However, in this study we showed that the performance of combined imaging is improving the overall diagnostic performance as measured by the area under the ROC curve. Specific cutoff thresholds for a given protocol may need to be confirmed in larger studies. The exact mechanism by which test performance is improved through combining supine with upright information is not currently known and warrants further investigation.
CONCLUSION
In this first report, to our knowledge, comparing HS-SPECT with ICA, automatic quantitative HS-SPECT shows high diagnostic accuracy for detecting clinically significant CAD, with findings comparable to those reported using conventional SPECT. Similar to findings with supine and prone imaging on conventional SPECT cameras, combined upright and supine acquisitions with HS-SPECT eliminates imaging artifacts present on 1 type of scan and leads to increased specificity of HS-SPECT in detecting CAD.
Acknowledgments
This research was supported in part by grant R0HL089765-01 from the National Heart, Lung, and Blood Institute/National Institutes of Health (NHLBI/NIH). The contents of this report are solely the responsibility of the authors and do not necessarily represent the official views of the NHLBI. Drs. Daniel Berman and Piotr Slomka participate in software royalties at Cedars-Sinai Medical Center. Dr. Daniel Berman is a shareholder in Spectrum-Dynamics.
Footnotes
↵* Contributed equally to this work.
- © 2010 by Society of Nuclear Medicine
REFERENCES
- Received for publication May 5, 2010.
- Accepted for publication August 11, 2010.


Jump to section
Related Articles
Cited By...
- Artificial Intelligence-Enhanced Perfusion Scoring Improves the Diagnostic Accuracy of Myocardial Perfusion Imaging
- Explainable Deep Learning Improves Physician Interpretation of Myocardial Perfusion Imaging
- 5-Year Prognostic Value of Quantitative Versus Visual MPI in Subtle Perfusion Defects: Results From REFINE SPECT
- Improving Prognostic Accuracy of Myocardial Perfusion Imaging With Quantitative Assessment
- Quantitative Clinical Nuclear Cardiology, Part 1: Established Applications
- Solid-State Detector SPECT Myocardial Perfusion Imaging
- Assessment of Myocardial CZT SPECT Recording in a Forward-Leaning Bikerlike Position
- Deep Learning Analysis of Upright-Supine High-Efficiency SPECT Myocardial Perfusion Imaging for Prediction of Obstructive Coronary Artery Disease: A Multicenter Study
- Deep Learning for Prediction of Obstructive Disease From Fast Myocardial Perfusion SPECT: A Multicenter Study
- Prognostic Value of Combined Clinical and Myocardial Perfusion Imaging Data Using Machine Learning
- Comparison Between Prone and Upright Imaging of the Inferior Wall Using 201TlCl Myocardial Perfusion SPECT
- Diagnostic Accuracy of Myocardial Perfusion Imaging With CZT Technology: Systemic Review and Meta-Analysis of Comparison With Invasive Coronary Angiography
- Achieving Very-Low-Dose Radiation Exposure in Cardiac Computed Tomography, Single-Photon Emission Computed Tomography, and Positron Emission Tomography
- Quantification of Myocardial Perfusion Reserve Using Dynamic SPECT Imaging in Humans: A Feasibility Study
- Cadmium-Zinc-Telluride SPECT in Very Morbidly Obese Patients Routinely Provides High-Diagnostic-Quality Myocardial Perfusion Imaging
- Myocardial Perfusion Imaging with a Solid-State Camera: Simulation of a Very Low Dose Imaging Protocol
- Direct Quantification of Left Ventricular Motion and Thickening Changes Using Rest-Stress Myocardial Perfusion SPECT
- New Toys for Nuclear Cardiologists