


Abstract
(R)-[11C]PK11195 is a tracer for activated microglia. The purpose of this study was to assess the validity of the simplified reference tissue model for analyzing (R)-[11C]PK11195 studies in traumatic brain injury (TBI), where blood–brain barrier disruptions are likely. Methods: Dynamic (R)-[11C]PK11195 scans were acquired at 3 time points after TBI. Plasma input–derived binding potential (BPNDPI), volume of distribution (VT) and K1/k2, and simplified reference tissue model–derived binding potential (BPNDSRTM) were obtained. Simulations were performed to assess the effect of varying K1/k2. Results: Early after TBI, an increase in VT, but not in BPNDPI, was found. Early K1/k2 correlated with VT and BPNDSRTM but not with BPNDPI. One and 6 mo after TBI, BPNDSRTM correlated with BPNDPI. Conclusion: Early after TBI, (R)-[11C]PK11195 studies should be analyzed using plasma input models.
Microglial activation can be measured using (R)-[11C]PK11195 and PET. This methodology has been used in the study of various neurodegenerative and neuroinflammatory diseases (1–6). Although the role of activated microglia after traumatic brain injury (TBI) is currently unknown, they may play a crucial role in this neuroinflammatory response after TBI and, as such, may be an important target for intervention after TBI. In vivo assessment of activated microglia after TBI is essential for developing such a strategy.
In most studies, (R)-[11C]PK11195 binding has been quantified using reference tissue approaches (7–10). Assessment of (R)-[11C]PK11195 binding after TBI, however, should take into account the added complexity of the fact that blood–brain barrier (BBB) disruptions are likely to be present. The purpose of this study was to assess the validity of reference tissue methods for quantifying (R)-[11C]PK11195 binding in TBI patients.
MATERIALS AND METHODS
Subjects
Ten TBI patients (mean age, 37.0 ± 17.2 y; range, 18–63 y; 6 men and 4 women) and 7 healthy control subjects (mean age, 31.2 ± 15.5 y; range, 18–59 y; 4 men and 3 women) were studied. Informed consent was obtained from all subjects or their next of kin. The clinical research protocol had been approved by the Medical Ethical Review Committee of the VU University Medical Center.
Design
All TBI patients were scheduled for the first (R)-[11C]PK11195 scan 7–10 d after trauma. Follow-up PET scans were performed at 1 and 6 mo after TBI. At least 24 h before scanning, patients were deprived of nonsteroidal antiinflammatory drugs and benzodiazepines. All subjects underwent structural T1-weighted MRI at the time of the PET scan. In TBI patients, a second MRI scan was performed 6 mo after TBI. All healthy subjects had normal screening results and normal MRI findings.
(R)-[11C]PK11195 Scans
PET was performed using an ECAT EXACT HR+ scanner, equipped with a neuro insert. All subjects received an indwelling radial artery cannula for arterial blood sampling. After a 10-min 2-dimensional transmission scan, a 3-dimensional dynamic (R)-[11C]PK11195 scan was obtained, consisting of 23 frames and a total acquisition time of 62.5 min. A bolus of 398 ± 75 MBq of (R)-[11C]PK11195 was injected intravenously using an infusion pump. The administered activity of (R)-[11C]PK11195 was not significantly different between patients (395 ± 77 MBq; 46 ± 19 GBq·μmol−1) and healthy controls (438 ± 37 MBq; 75 ± 30 GBq·μmol−1). Arterial blood was withdrawn continuously at a rate of 5 mL·min−1 for the first 10 min and 2.5 mL·min−1 thereafter. In addition, discrete blood samples were taken at set times (11). All PET scans were reconstructed using a Fourier rebinning algorithm plus a 2-dimensional filtered backprojection algorithm with a Hanning filter set at a cutoff of 0.5 times the Nyquist frequency, resulting in an image resolution of about 7 mm in full width at half maximum (12). All data were corrected for decay, dead time, randoms, scatter, and tissue attenuation. A zoom factor of 2 and an image matrix of 256 × 256 × 63 were used, resulting in a voxel size of 1.2 × 1.2 × 2.4 mm.
Volume-of-Interest Definition
MRI and PET scans were coregistered (13,14). Bilateral 3-dimensional volumes of interest (VOI) for frontal, parietal, occipital, temporal cortex cerebellum, thalamus, hippocampus, cingulate gyrus, striatum, corpus callosum, midbrain, pons, and medulla oblongata were outlined manually on the coregistered MRI scan. In addition, areas of traumatic intracerebral contusion and the surrounding penumbra zones were defined. A global VOI was constructed, comprising the volume-weighted values of these regions. VOIs were projected onto the corresponding dynamic PET scans (all frames), generating regional time–activity curves.
Kinetic and Parametric Analysis
Metabolite-corrected plasma input functions were generated as described previously and were used for a 2-tissue-compartment model. In addition, uncorrected whole blood was used as a second input function for estimating blood volume fraction (15). With this model, tissue time–activity curves for all VOIs were analyzed, providing volume of distribution (VT), plasma input–derived binding potential (BPNDPI), and K1/k2. Simplified reference tissue model (SRTM)–derived binding potential (BPNDSRTM) was obtained using SRTM, with total cerebellum as the reference tissue.
Simulations
To investigate the impact of changes in K1/k2 on the accuracy of all analyses, we performed simulation studies. For all simulations, the reference and target regions were simulated using a 2-tissue-compartment model. Nonspecific binding in reference and target regions was assumed to be the same and was set to a binding potential of 1.5 using a k5 of 0.06 min−1 and a k6 of 0.04 min−1. Although, in reality, nonspecific binding may vary between regions, the purpose of the present simulations was only to assess the effect of changes in K1/k2. For the reference region, a K1 of 0.055 mL·cm−3·min−1 and a k2 of 0.15 min−1 (K1/k2 = 0.367) were used, whereas for the target regions the K1/k2 ratio was varied either by changing K1 and keeping k2 constant or by changing k2 and keeping K1 constant. In this way, the K1/k2 ratio of the target region was varied between 0.2 and 0.6—that is, with lower and higher K1/k2 ratios than that of the reference region. Blood volume was set to 0.05 for both reference and target regions. Target region time–activity curves were then analyzed using both a 2-tissue-compartment plasma input model and SRTM. Bias in observed binding potentials was evaluated as a function of simulated K1/k2 of the target region.
RESULTS
Subjects
In TBI patients, (R)-[11C]PK11195 scans were obtained at 10 ± 4 (n = 9), 42 ± 10 (n = 8), and 185 ± 17 (n = 9) days after TBI, with reliable plasma input data for 5, 5, and 8 scans, respectively. SRTM data were available for 8 TBI patients and all controls.
[11C]PK11195 PET Studies
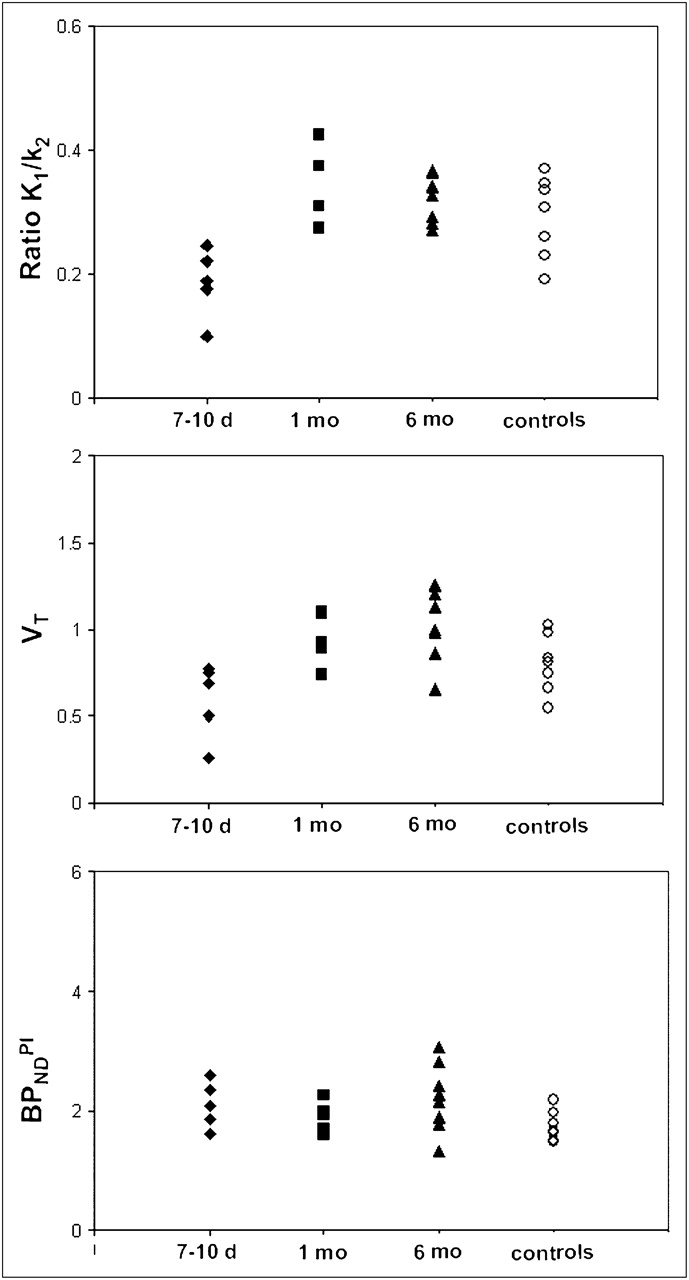
K1/k2, VT, and BPNDPI values for the global VOI are shown in Figure 1. Seven to 10 d after TBI, K1/k2 was decreased, compared with 1 (P = 0.005) and 6 (P = 0.0002) months after TBI and compared with healthy controls (P = 0.015). In addition, the early scans showed a VT decrease that was proportional to the decrease in K1/k2. One and 6 mo after TBI, global K1/k2 normalized to the values seen in the healthy controls (P = 0.33 and P = 0.27, respectively). Similar variations in VT over time were seen, whereas binding potentials appeared to be more constant on average.

K1/k2, VT, and BPNDPI in TBI patients at 7–10 d (♦), 1 mo (▪), and 6 mo (▴) after TBI, and in control subjects (○).
Because K1/k2 abnormalities normalized at 1 and 6 mo, BPNDSRTM could be a valid approach for estimating BPND at these time points. This possibility was further assessed through a comparison of BPNDSRTM with corresponding BPNDPI values. In Figure 2A, combined results for thalamus and trauma/penumbra VOI (regions with the highest signal) are provided and show a clear proportionality between BPNDSRTM and BPNDPI. The observed offset around a BPNDPI of 2.0 corresponds to the value seen in healthy controls (16). In Figures 2B and 2C, BPNDPI and BPNDSRTM, respectively, are shown as functions of K1/k2 obtained from plasma input analysis. No significant correlations (R2 < 0.2) were observed. The 3 outliers encircled in Figure 2A correspond to those encircled in Figure 2B, that is, to the lowest K1/k2 values. Finally, Figure 2D shows the relationship between BPNDSRTM and K1/k2 normalized to that of the reference VOI (total cerebellum). Again, no significant correlations were observed (R2 < 0.2).

BPNDSRTM (A) as function of BPNDPI for thalamus and trauma/penumbra at 1 and 6 mo after TBI; BPNDSRTM (B) and BPNDPI (C) as function of K1/k2; and BPNDSRTM (D) as function of K1/k2 normalized to reference (cerebellum) K1/k2. Circled data points represent low BPNDSRTM (A) because of low K1/k2 ratio (B).
The results for early (R)-[11C]PK11195 scans in TBI patients are shown in Figure 3. In Figure 3A, BPNDSRTM for various trauma or penumbra regions is given as a function of the corresponding BPNDPI. In contrast to the late scans (Fig. 2A), no clear correlation between BPNDSRTM and BPNDPI was observed. In Figure 3B, both BPND measures are given as a function of K1/k2, and in Figure 3C, BPNDSRTM is shown as a function of K1/k2 normalized to that of the reference region. In the latter case, a high correlation (R2 = 0.85) was observed.
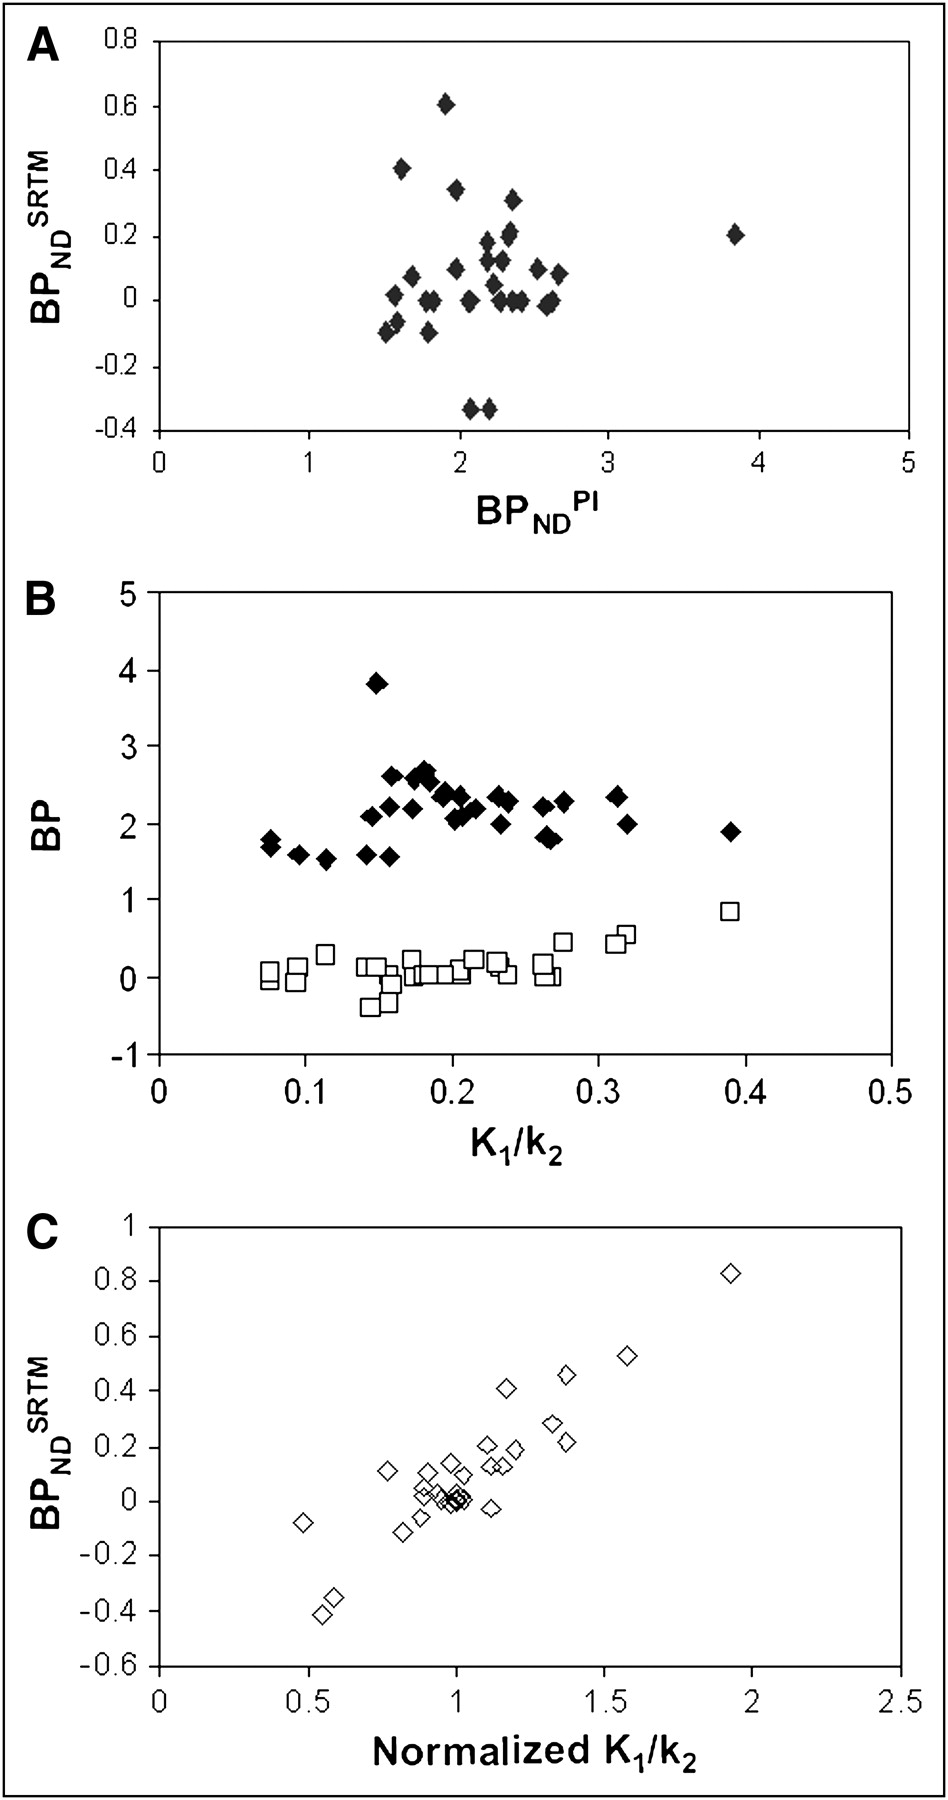
BPNDSRTM (A) as function of BPNDPI; BPNDSRTM (□) and BPNDPI (♦) (B) as function of K1/k2; and BPNDSRTM (C) as function of K1/k2 normalized to reference (cerebellum) K1/k2.
Simulations
The results of the simulation studies for both plasma and reference tissue input models are shown in Figure 4. Changing the K1/k2 ratio of the target region did not affect BPNDPI, indicating that changes in K1 or k2, and thus in K1/k2, are considered correctly. On the other hand, a change in the K1/k2 ratio of the target region relative to that of the reference VOI (indicated by the arrow) resulted in a corresponding bias in BPND estimates.
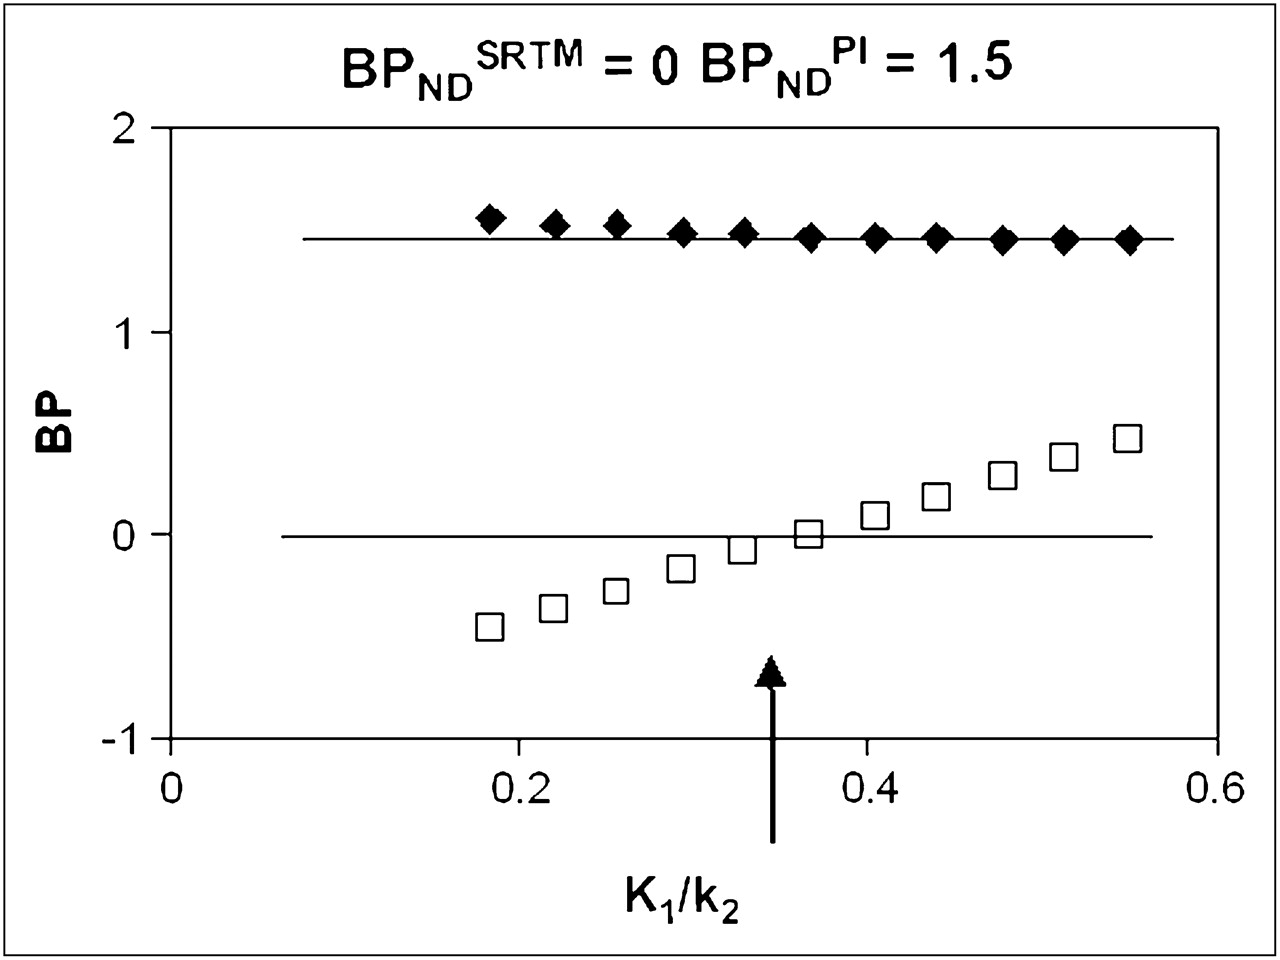
BPNDSRTM (□) and BPNDPI (♦) as function of K1/k2, with K1/k2 of reference tissue fixed to value indicated by arrow. Horizontal lines represent BPNDSRTM and BPNDPI values for case in which K1/k2 is same as that of reference tissue.
DISCUSSION
This study showed that BPNDSRTM overestimated specific (R)-[11C]PK11195 binding in scans obtained 7–10 d after TBI, especially in contusion areas. As such, an increase in BPNDSRTM early after TBI could be a false-positive finding that is due to BBB disruptions rather than microglial activation. Analysis using a plasma input model showed a global decrease in K1/k2 values in (R)-[11C]PK11195 scans obtained 7–10 d after TBI, compared with K1/k2 values in healthy volunteers. Moreover, (R)-[11C]PK11195 scans obtained 7–10 d after TBI showed more variability in K1/k2 than was seen in healthy controls. This increased variability of K1/k2 across the brain most likely reflects disruptions of the BBB, which would prohibit definition of an appropriate reference tissue. In contrast, the increase in BPND seen in patients at 1 and 6 mo after TBI is likely to reflect specific (R)-[11C]PK11195 binding, as it is associated with an increase in k3/k4 without an increase in K1/k2. Because the variability of K1/k2 across the brain was also similar to that in healthy subjects, SRTM seems to be a valid method for assessing activated microglia at 1 and 6 mo after TBI. Clearly, if early scans are involved, all longitudinal scans, even those beyond 1 mo after TBI, should also be analyzed with a plasma input model.
In line with many previous studies, total cerebellum was used as the reference tissue (1,4,6,9). Plasma input analysis revealed that cerebellar BPNDPI was 1.92 ± 0.23 and 1.50 ± 0.44 in early and late scans, respectively. In healthy controls, BPNDPI was 1.35 ± 0.29. These data indicate that activated microglia may indeed be present in cerebellum (P = 0.004) early (7–10 d) after TBI, whereas the difference from healthy controls is no longer significant (P = 0.23) for later (1–6 mo after TBI) studies. In other words, use of SRTM early after TBI is affected not only by BBB abnormalities but also possibly by the presence of activated microglia in the reference tissue. Thus, for early TBI scans, a plasma input function is needed for which arterial sampling is required. A drawback of arterial sampling is its invasiveness. In addition, arterial sampling is more labor-intensive and cannot always be successfully completed, especially in TBI patients.
Disruptions of the BBB are not unique to TBI. Indeed, BBB disruptions often are diagnosed in other disorders such as stroke, multiple sclerosis, hereditary cerebral hemorrhage with amyloidosis–Dutch type, cerebral amyloid angiopathy, and brain tumors. In addition, the results from the present study can be extrapolated to all cases of suspected BBB disruption. In those cases, reference tissue approaches, such as SRTM, cannot be used to assess specific binding.
CONCLUSION
In the acute or subacute phase after TBI, (R)-[11C]PK11195 studies should be analyzed using only plasma input models. At later stages, reference tissue models might also be valid for assessing activated microglia.
Acknowledgments
We thank the patients, their families, and the control subjects for volunteering for this study, and the personnel of the BV Cyclotron VU and staff of the Department of Nuclear Medicine and PET Research, VU University Medical Center, Amsterdam, for production of (R)-[11C]PK11195 and technical assistance. This work was made possible by research grant 9F01.21 from the Dutch Brain Foundation and NWO VIDI grant 016.066.09 from the Netherlands Organisation for Scientific Research.
Footnotes
-
COPYRIGHT © 2009 by the Society of Nuclear Medicine, Inc.
References
- Received for publication June 24, 2009.
- Accepted for publication August 20, 2009.


