


Abstract
The development of a successful PET or SPECT molecular imaging probe is a complex, time-consuming, and expensive process that suffers from high attrition. To address this problem, we have developed a biomathematical modeling approach that aims to predict the in vivo performance of radioligands directly from in silico/in vitro data. Methods: The method estimates the in vivo nondisplaceable and total uptake of a ligand in a target tissue using a standard input function and a 1-tissue-compartment model with a parsimonious parameter set (influx rate constant K1, efflux rate constant k2, and binding potential BPND) whose values are predicted from in silico/in vitro data including lipophilicity, molecular volume, free fraction in plasma and tissue, target density, affinity, perfusion, capillary surface area, and apparent aqueous volume in plasma and tissue. The coefficient of variation of the BPND (%COV[BPND]) metric, derived from Monte Carlo simulations, is used to estimate the in vivo performance of candidate compounds. A total of 28 compounds for 10 targets was evaluated using our method to predict their in vivo performance and validated against measured in vivo PET data in the Yorkshire/Danish Landrace pig. Results: The predicted K1, k2, and BPND values were generally consistent with the values estimated from in vivo PET data. The model resulted in small %COV[BPND] values for widely accepted good ligands such as 11C-flumazenil (2.02%) and 11C-raclopride (2.55%), whereas higher values resulted from poor ligands such as 11C-(R)-PK11195 (13.34%). Of 4 candidates for the GlyT1 transporter, the model selected 11C-GSK931145 (2.11%) as the most promising ligand, which was consistent with historical decisions made on the in vivo PET data. Conclusion: A biomathematical modeling approach has the potential to predict the in vivo performance of ligands from in silico/in vitro data and aid in the development of molecular imaging probes.
Molecular imaging of the central nervous system (CNS) with PET and SPECT is predicated on the availability of radioligands that bind to a particular receptor, transporter, or enzyme of interest. A successful in vivo imaging probe possesses a range of properties including high selectivity for the target of interest, the ability to be safely administered to humans at tracer doses, the ability to reach the target site, low nonspecific binding, suitable affinity such that a large enough specific-to-nonspecific signal exists, suitably reversible kinetics to facilitate quantitative analysis, and the ability to be radiolabeled. Given these numerous and sometimes conflicting characteristics, it is not surprising that the discovery and development process is challenging (1).
To date, the process usually concentrates on screening compounds according to lipophilicity, affinity, selectivity over assumed nearest pharmacology, target density, and labeling feasibility. Lipophilicity, estimated as logD, is assessed to determine the likelihood that a molecule will penetrate the blood–brain barrier (BBB); as a rule of thumb a value between 1 and 3 is chosen to maximize penetration while trying to minimize nonspecific binding (2). Compound affinity is used to determine whether the molecule binds avidly enough to the target to produce a measurable signal. The weakness of these approaches is that only some of the characteristics required are considered, with little deliberation given to the prediction of nonspecific binding and optimal kinetics. Even for the properties that are considered, there is little quantitative assessment of their likely impact on the in vivo outcome measures of interest. More recently, Patel et al. (3) have developed an in vitro no-wash autoradiography assay to predict whether a candidate compound has a suitable specific signal. However, the authors acknowledged that this assay is still somewhat simplistic and does not consider brain entry or the kinetics of the compound.
Currently, even with in silico/in vitro screening of putative tracers, followed by preclinical evaluation and translation to humans, the process is expensive and time-consuming and suffers from a large amount of attrition. Thus, the discovery and development of novel radioligands is still essentially progressing by trial and error, with success often based on empiricism and serendipity (4). Fowler (5) also highlighted this in a commentary in The Journal of Nuclear Medicine and suggested that more sophisticated approaches to prediction are required: “Poor predictability has been a root cause of the low yield of useful radiotracers relative to the number of labeled compounds that have been painstakingly synthesized and evaluated over the years.”
In this article, we introduce a biomathematical modeling approach that takes known physicochemical and pharmacological properties of candidate molecules to predict their in vivo performance. The idea was to develop a quantitative in silico method as a precursor to in vivo studies, aiming to provide increased confidence in candidate molecules before radiolabeling. Such an in silico screening tool would be ideally positioned to leverage large databases of compounds available in the pharmaceutical industry.
The biomathematical model incorporated quantitative components accounting for BBB penetration, specific binding, nonspecific binding, and radiotracer kinetics. These components were integrated within a tracer compartmental framework and parameterized using in silico/in vitro data enabling the simulation of in vivo datasets and the prediction of the outcome measure of interest. Here, we used the binding potential (BPND) as the outcome measure, which is defined, at equilibrium, as the ratio of specifically bound to nondisplaceable radioligand in tissue (6). Our approach estimated the BPND through Monte Carlo simulations and determined its magnitude and reproducibility metric as a measure of in vivo performance. Validation of the approach was investigated with a dataset of candidate radioligands (n = 28) for which there exists in silico/in vitro data and in vivo PET data acquired in the Yorkshire/Danish Landrace pig.
MATERIALS AND METHODS
The biomathematical modeling approach uses a 1-tissue-compartment model (1TCM) parameterized by in silico/in vitro data to predict the in vivo behavior of a radioligand (Fig. 1). The in vivo performance of candidate compounds was assessed through Monte Carlo simulations using the coefficient of variation of BPND (%COV[BPND]) metric. An in silico/in vitro/in vivo dataset was introduced, and the validation of the individual model components and their overall performance was investigated.

Overview of the biomathematical modeling approach.
The Biomathematical Model
The approach uses a 1TCM to approximate both the nondisplaceable and total uptake of a ligand in a target tissue. Thus, the assumption was that all compartments equilibrate rapidly. Though this may not always be the case, given the overall complexity of in vivo prediction, the assumption was reasonable and allowed for a parsimonious description in terms of just 3 parameters (influx rate constant K1, efflux rate constant k2, and BPND). These parameters were predicted from in silico/in vitro data to account for brain entry, specific or nonspecific binding, and kinetics. In conjunction with an appropriate plasma input function, the in vivo kinetics can be simulated and the behavior of the radioligand can be characterized.
The BPND was chosen as the primary outcome measure of interest, and the in vivo performance of the ligand was determined from its %COV[BPND].
To approximate the in vivo behavior of the ligand, the K1, k2, and BPND parameters predicted from in silico/in vitro data were used in conjunction with the 1TCM to generate noiseless time–activity curves for 90 min. Subsequently, 1,000 noisy realizations were generated with the variance of noise proportional to radioactivity divided by frame duration, and the 1TCM was fitted to both the nondisplaceable and the total tissue data to derive estimates of BPND as follows: Eq. 1where VT and VND are the volumes of distribution in the total and nondisplaceable compartments, respectively. This Monte Carlo simulation approach allows for the calculation of %COV[BPND]:
 Eq. 2where σ (BPND) is the SD, and μ (BPND) is the mean of the BPND estimates derived from the simulations. This metric is used to assess radioligand performance, with a smaller %COV[BPND] value indicating a better radioligand.
Models for the prediction of the parameter set (K1, k2, and BPND) were developed using the physicochemical and pharmacological properties of the ligand, the target density, and additional physiological parameters.
Prediction of K1
The influx rate constant K1 gives an index of the ease with which a compound can transfer from plasma into the brain. Here, the model developed by Renkin and Crone (7, 8) is used to predict the brain uptake, which defined K1 in terms of perfusion (f), permeability of the compound (P), and capillary surface area (S) using the following equation: Eq. 3where K1 and f are in units of mL/cm3/min, P is cm/min, and S is cm2/cm3 of brain. In this model, f and S are known physiological parameters (7,9). The permeability is the key property that determines the delivery of individual compounds across the BBB. We have used an in silico model to predict the permeability of candidate molecules from physicochemical properties (lipophilicity and molecular volume), assuming that the transport mechanism is passive diffusion. The model is a simplification of the permeability prediction model developed by Lanevskij et al. (10) and removes the flow limit and hydrogen bonding terms, combines ionization with lipophilicity using clogD (in silico logarithm of the octanol-water partition coefficient), keeps the McGowan volume term Vx (the actual volume of a mole when the molecules are not in motion [cm3mol−1/100] (11)), and replaces the bilinear function with a parabola. The model predicts the permeability as follows:
 Eq. 4
Eq. 4
The coefficient estimates of the model were determined using multilinear regression based on in vitro permeability data from 30 non–P-glycoprotein substrates, which were measured using the MDCK-mdr1 cell line (Madin-Darby canine kidney transfected with the multidrug resistance gene) (12). The model defines a parabolic relationship between permeability and lipophilicity and indicates an optimal clogD value of 2.3 (R2 = 0.58, P < 0.0001).
Prediction of k2
At equilibrium, under the assumption of passive diffusion, the free concentration of the compound will be the same either side of the BBB. The efflux rate constant k2 can then be predicted from the influx rate K1, the free fraction in plasma fP, and the free fraction in tissue fND, which are, respectively, the fraction of unbound ligand in plasma and tissue that are free for binding. fP and fND can be measured in vitro using equilibrium dialysis (12). The model also incorporates the apparent aqueous volume in plasma Vaq_P and in tissue Vaq_T to correct for the small volume that cannot be reached by solvent in plasma and tissue, respectively. Thus, it follows that at equilibrium, Eq. 5where CP and CND are the concentrations in plasma and nondisplaceable compartments, respectively. The volume of distribution of the nondisplaceable compartment is defined as follows:
 Eq. 6
Eq. 6
Thus, k2 can be predicted as: Eq. 7
Eq. 7
Prediction of BPND
BPND reflects the capacity of tissue for ligand-binding site interaction and includes terms for the target density (Bmax, concentration of binding sites), the equilibrium dissociation rate constant (KD), and the free fraction in tissue (fND). Bmax measures the target concentration of binding sites in units of fmol/mg of protein, fmol/mg of wet tissue, or nM. KD is the reciprocal of the affinity of the ligand for the receptor in units of nM. At tracer dose, the in vivo BPND is defined as: Eq. 8
Eq. 8
Thus, given the in vitro estimates of Bmax, KD, and fND, we can predict the in vivo BPND using Equation 8. Both Bmax and KD can be derived from in vitro homogenate saturation binding measurements by fitting the saturation binding data to a Michaelis–Menten equation. Ki, derived from competitive binding experiments in which the binding of a single concentration of labeled ligand in the presence of various concentrations of unlabeled ligand is measured, can be used as an estimate for KD if the ligand and the blocker are the same. As the unit of Bmax from the homogenate binding assay is generally in fmol/mg of protein, it can be converted to nM by assuming that the brain density is around 1 g wet weight/mL, and 1 fmol/mg of protein can be approximated by 0.05–0.1 fmol/mg of wet weight (13). In this way, we have refined our model for BPND prediction as: Eq. 9where
  is the Bmax measured from homogenate binding assays in units of fmol/mg of protein, and α is the conversion coefficient from protein to tissue in units of milligram of protein per milliliter of tissue.
Model Validation
The In Silico/In Vitro/In Vivo Validation Dataset
The performance of our approach is evaluated on a dataset containing 28 compounds for which the in silico/in vitro and in vivo data exist (Table 1). For each compound, the in silico parameters such as clogD and Vx were obtained from in-house in silico models. For in vitro data, the Ki of 23 of 28 molecules were measured in-house by competitive binding assays in human tissue at room temperature. The KD of N-methylspiperone (NMSP) and raclopride were measured in humans at 37°C and 23°C, respectively (14). KD values of FLB-457, R-(−)-rolipram, and S-(+)-rolipram were measured in rats at room temperature (15,16). Bmax values were obtained from the literature (9/10 targets) except for the Bmax of GlyT1 in the human cortex, which was measured in-house using homogenate binding assays. Among those obtained from literature, the density of 5-HT2c was measured from rabbit homogenate (17), the density of PDE4 was from rat homogenate (18), and the density of the other targets was measured in human homogenate (19–24) (one other exception is that the Bmax for D3 in human pallidum was determined using autoradiography (25) in the absence of any homogenate binding data). Free fractions fP and fND of all the molecules were measured in Yorkshire/Danish Landrace pig blood and brain tissue using equilibrium dialysis (12).
Predicting In Vivo Performance of Radioligands from In Silico/In Vitro Data
All 28 compounds were evaluated in preclinical PET studies in the Yorkshire/Danish Landrace pig (∼40 kg), at Aarhus University Hospital, in accordance with the Danish Animal Experimentation Act, under a license granted by the Danish Ministry of Justice. The animals were anesthetized by induction with ketamine and midazolam (both intramuscularly and intravenously) and maintained in deep anesthesia using isofluorane (1%−2%; Abbott) during scanning. Animals were placed supine in a Siemens ECAT EXACT HR tomograph (CTI), with the head immobilized in a custom-made head-holding device. For all scans, dynamic brain data were acquired in 3-dimensional mode for up to 90 min after the intravenous administration of the radiolabeled compound. Measured attenuation and scatter correction were applied, and the data were reconstructed using the reprojection algorithm (26). The resulting images had a spatial resolution of 5–7 mm in full width at half maximum (27). During the acquisition, 40 × 2 mL arterial blood samples were taken from the femoral artery to assay radioactivity in arterial plasma, and a subset of 17 were assayed for whole-blood radioactivity. Additional arterial samples (6 × 5 mL) were drawn throughout the scan to determine the fraction of unmetabolized tracer in plasma by high-performance liquid chromatography and γ-counting. Integrated PET images were formed and used to rigidly register all the PET data to a Landrace pig brain atlas. Time–activity curves were generated for relevant regions of interest. Plasma parent input functions were generated by interpolating the discrete plasma data using linear interpolation and multiplying this by the continuous parent fraction derived from fitting the discrete metabolite data to an exponential approach to a constant. 1- and 2-tissue-compartmental kinetic analyses (28) were applied to the time–activity curves to derive regional estimates of the influx rate constant (K1) and total and nondisplaceable volumes of distribution (VT and VND). VND was obtained either from a reference region or from a blocked scan. The least-squares fitting procedure included a fixed 5% blood volume and was performed with a Levenberg–Marquadt optimizer in Matlab (The MathWorks). The Akaike information criterion (29) was used as the model selection criterion to determine the most parsimonious kinetic model. k2 was calculated as K1/VND and BPND as VT/VND − 1.
Model Validation
First, the models to predict K1, k2, and BPND were validated individually; second, the impact of the input function was considered; and finally, the overall in vivo predictive performance of the biomathematical approach was evaluated.
The K1 values of the 28 compounds in the dataset were predicted using Equation 3, with permeability predicted using Equation 4 in conjunction with fixed values for perfusion (0.6 mL/cm3/min) (30) and capillary surface area (150 cm2/cm3 of brain) (12). As in vitro estimates of K1 were expected to be lower because they were estimated from an in vitro MDCK cell line, it was necessary to introduce a scaling factor to account for global in vitro/in vivo K1 differences of 3.43 (this was derived from a subset of the validation dataset [n = 13] for which there was high confidence of passive diffusion (31)). In vivo K1 values of the full set of compounds were quantified from the PET data and compared with their predicted values.
k2 values of the compounds were predicted using the predicted K1 values, the fP and fND estimates measured using equilibrium dialysis, and the apparent aqueous volumes in plasma and tissue (Vaq_P = 0.98 solvent/mL of plasma and Vaq_T = 0.9 solvent/mL of tissue). In vivo k2 values obtained from the PET data were compared with those predicted by the model.
Predicted BPND estimates in the validation dataset were obtained using the KD or Ki of the compound, their individual fND measurement, and Bmax from homogenate binding assays. To convert the unit of Bmax from fmol/mg of protein to nmol/L, we assumed that there was 0.1 milligram of protein per milligram of wet weight (α = 10 in Eq. 9). Predictions from in vitro assays were compared with the in vivo PET BPND estimates.
The impact of the plasma input function was also evaluated. The %COV[BPND] of the compounds in the dataset were calculated with 3 plasma input functions with different areas under the curve (AUCs), including a bolus input with fast clearance (INP1, AUC0–90 min = 131 kBq min/mL), a bolus input with moderate clearance (INP2, AUC0–90 min = 264 kBq min/mL), and a bolus-plus-infusion input (INP3, AUC0–90 min = 367 kBq min/mL). The in vivo PET K1, k2, and BPND values of the compounds were used, and the %COV[BPND] values were calculated for each input function.
Finally the overall performance of the modeling approach was assessed by estimating the %COV[BPND] values using a standard input function (INP2) and the K1, k2, and BPND values predicted by Equations 3, 7, and 9.
RESULTS
PET Data Analysis
PET data for 4 of the 28 compounds are shown in Figure 2, including examples displaying low brain penetration (Fig. 2B), high nonspecific binding (Fig. 2C), slow kinetics (Fig. 2D), and good specific binding and kinetics (Fig. 2E). The in vivo K1, k2, and BPND values estimated from the PET data for all 28 compounds are listed in Table 1.
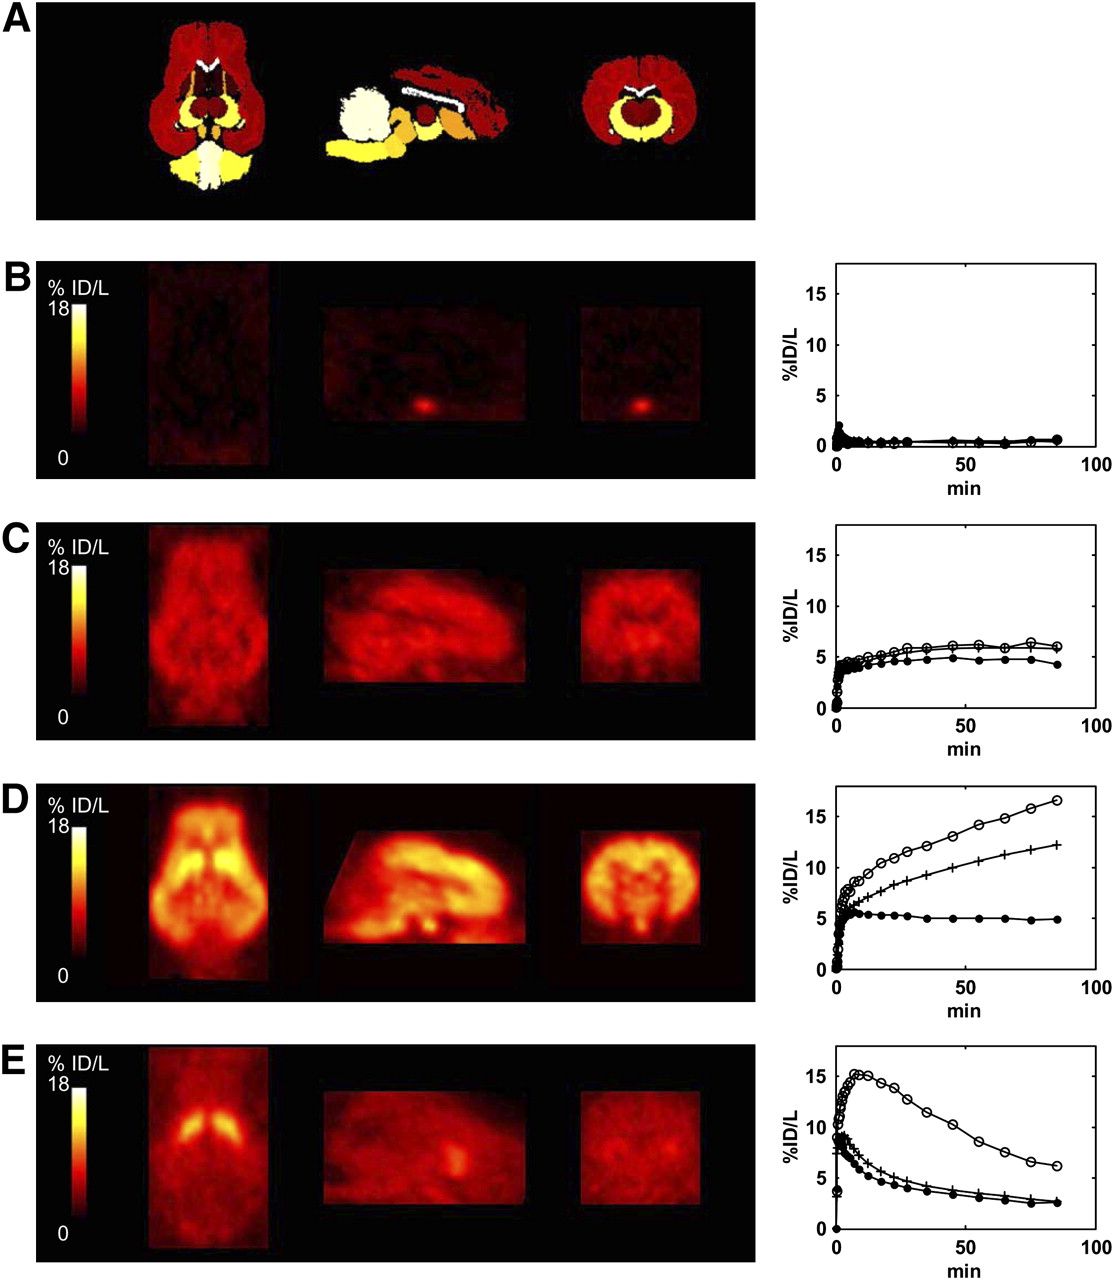
Coregistered Landrace pig brain atlas and PET images (transverse, coronal, and sagittal slices), with corresponding time–activity curves for striatum (○), frontal cortex (+), and cerebellum (•) for 4 candidate CNS radioligands. (A) Landrace pig brain atlas. (B) 11C-GSK00000A targeting serotonin 5-HT6 receptor. (C) 11C-GSK00000D targeting NK1 receptor. (D) 11C-GR205171 targeting NK1 receptor. (E) 11C-raclopride targeting D2 receptor. PET images are integral images over 90 min. %ID/L = percentage injected dose per liter.
Validation of K1 Prediction Model
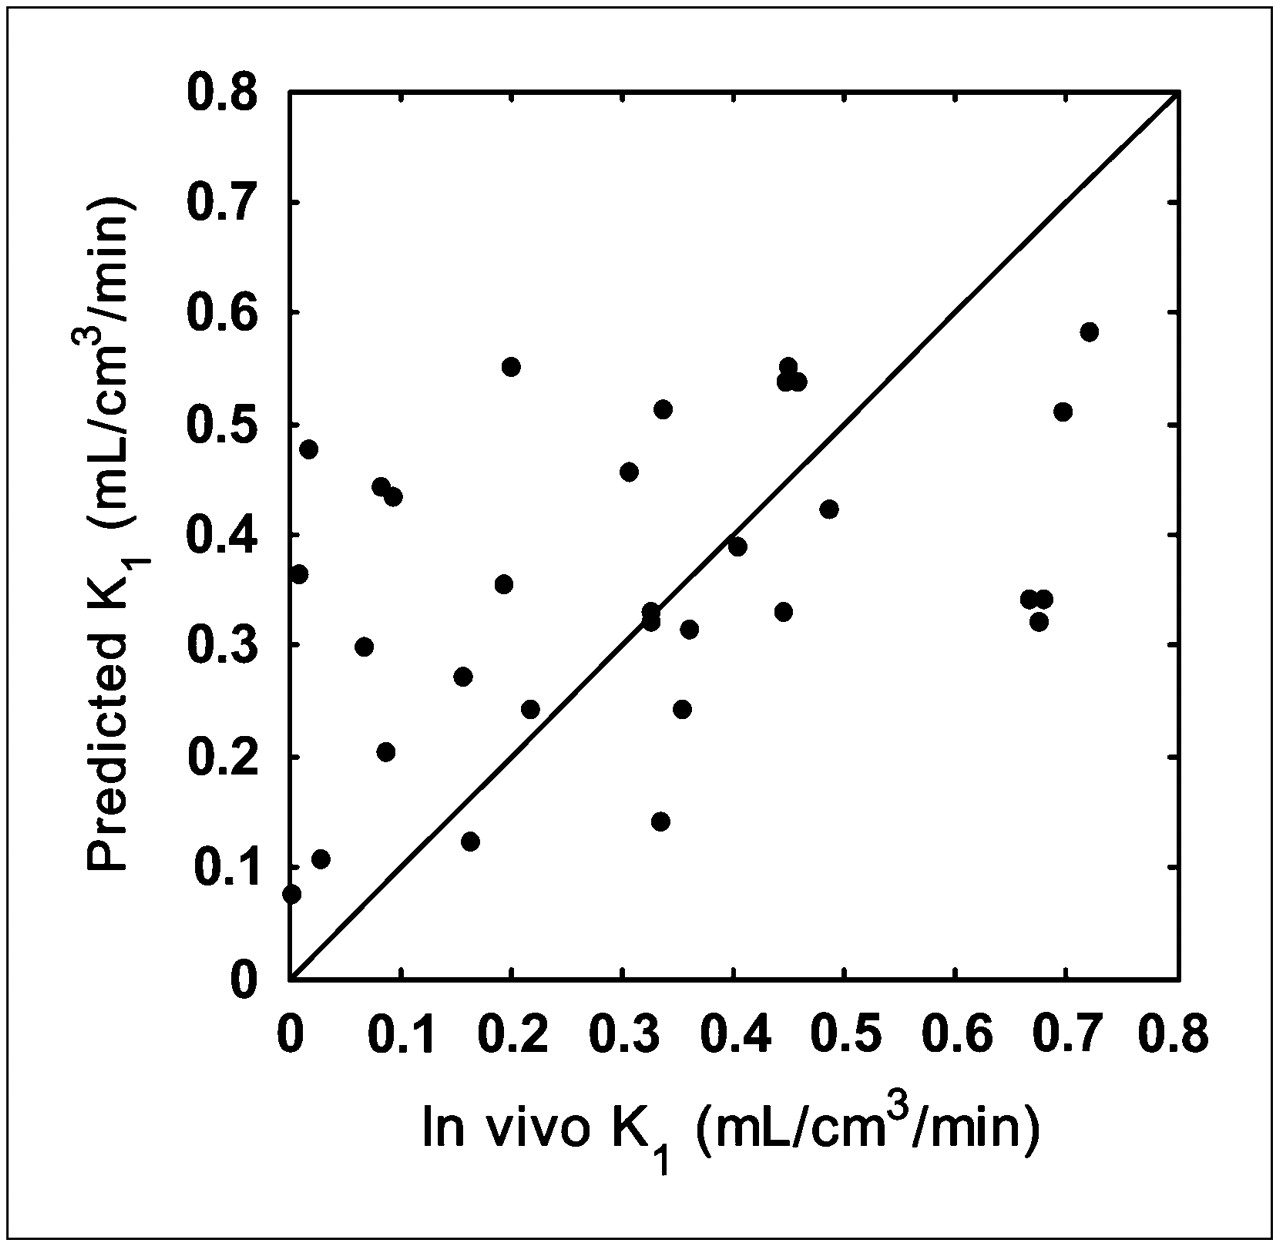
Scatter plots for the predicted and measured in vivo K1 are shown in Figure 3. The Pearson correlation coefficient was r = 0.402 (P = 0.025) and reflected a reasonably good correlation when considering the complexity of predicting in vivo brain penetration.

Relationship between predicted K1 values and those measured in vivo for validation dataset (r = 0.402, P = 0.025). Line of identity is shown.
Validation of k2 Prediction Model
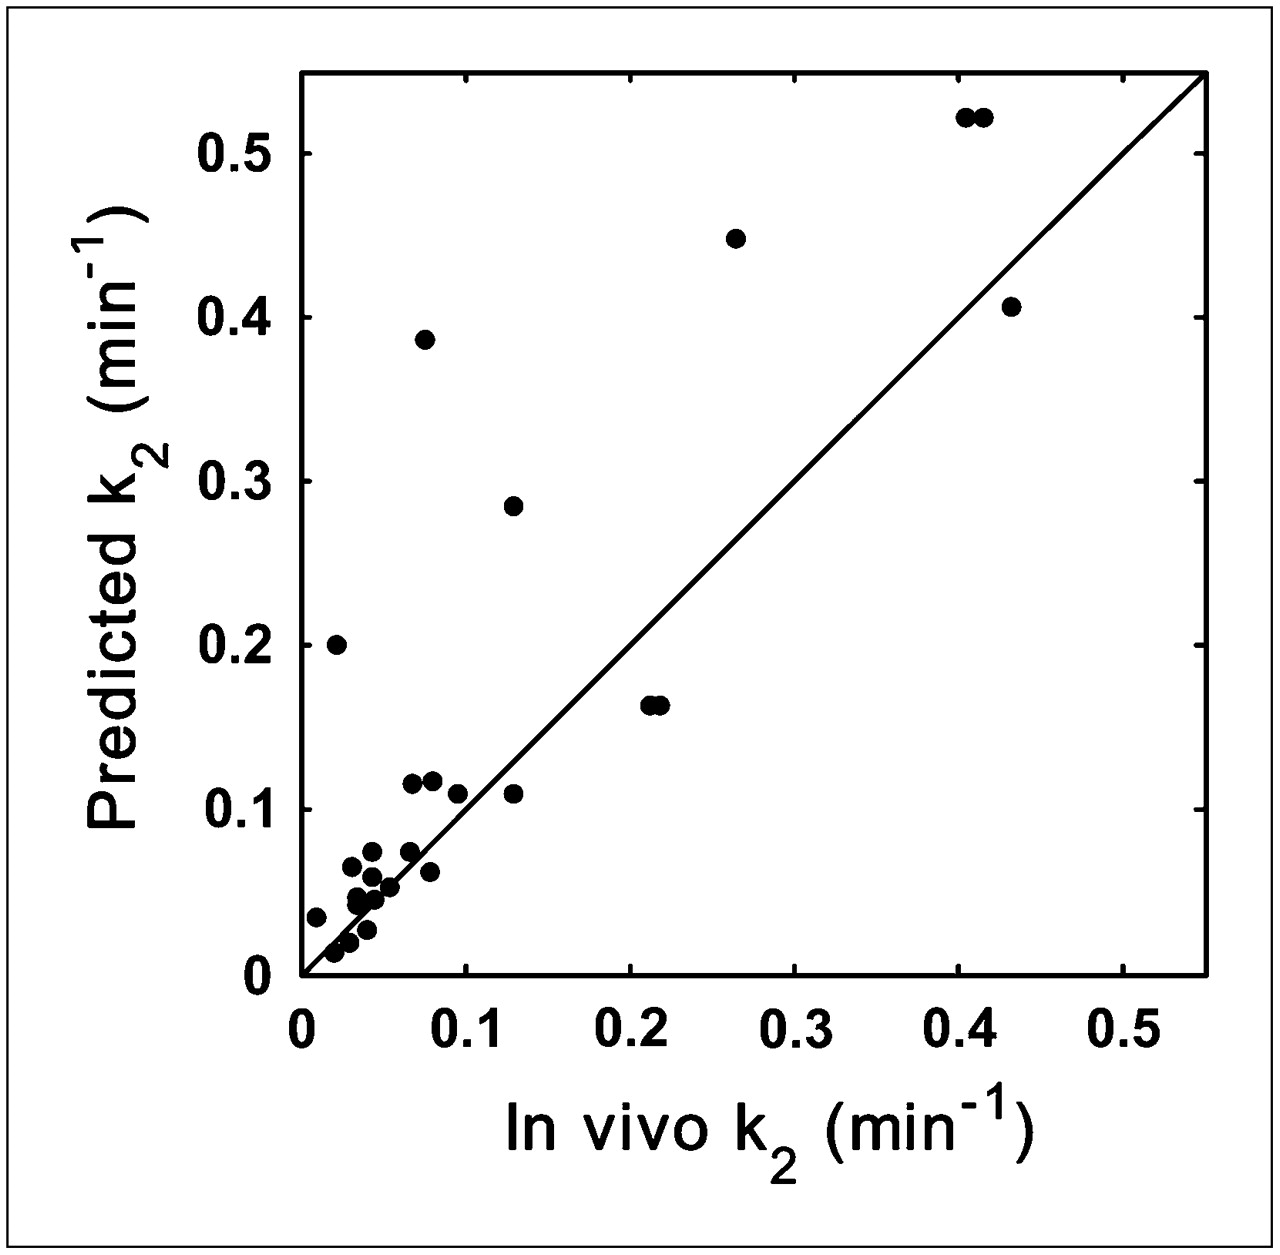
Scatter plots for the predicted and measured in vivo k2 values are shown in Figure 4. There was good correlation between the predicted and the in vivo k2 (r = 0.85, P < 0.0001). Three compounds that had nonquantifiable in vivo k2 (mostly because of low brain penetration) and 1 compound that had a large predicted k2 value (k2 = 5.75) driven by a small fp (Table 1) were omitted.

Relationship between predicted k2 values and those measured in vivo for validation dataset (r = 0.85, P < 0.0001). Line of identity is shown.
Validation of BPND Prediction Model
Scatter plots for the predicted and measured in vivo BPND are given in Figure 5. D3 and CRF1 data are omitted from the plot because Bmax for D3 was measured using autoradiography, and the in vivo BPND for CRF1 was not quantifiable (Table 1). Because BPND estimates of ligands can vary by 3 orders of magnitude, they are plotted using a log scale. It shows that BPND values predicted from in vitro Bmax, KD or Ki data are highly correlated with the measured in vivo BPND (r = 0.822, P < 0.0001).
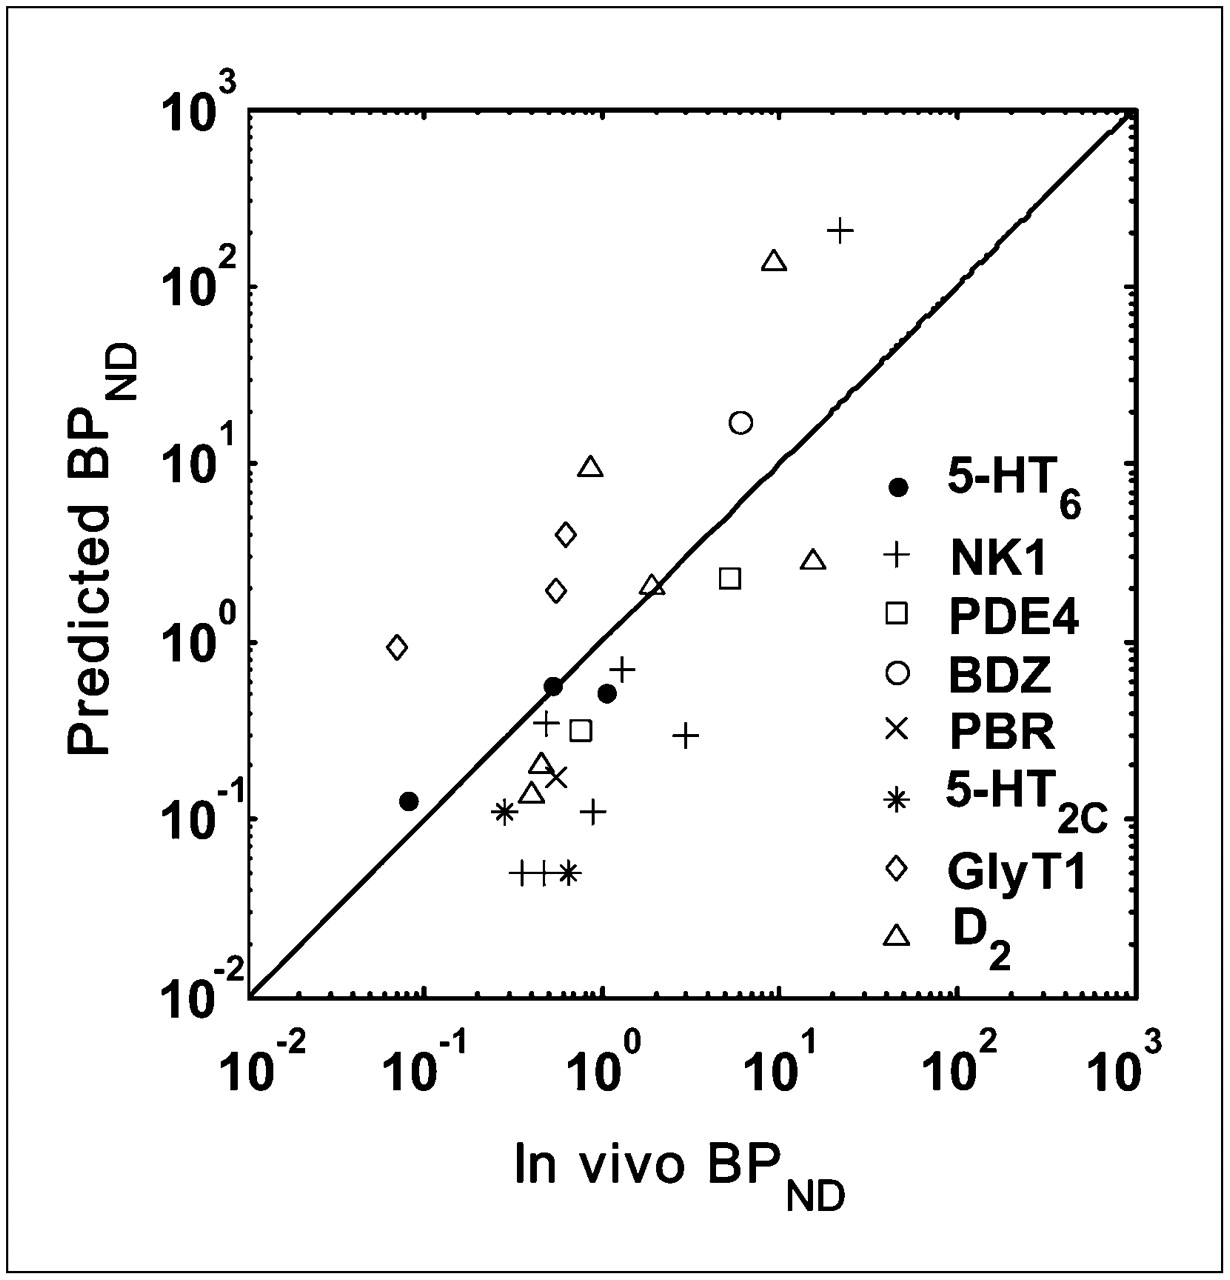
Relationship between predicted BPND values and those measured in vivo for 8 targets in validation dataset (r = 0.822, P < 0.0001). Line of identity is shown.
Evaluation of Impact of Input Functions
The impact of 3 different plasma input functions on the %COV[BPND] estimates was assessed. For all compounds in the dataset, increased plasma clearance rates decreased %COV[BPND] estimates (data not shown), which is consistent with faster kinetics yielding better quantification results. However, the magnitude of this effect was small, with values proportionally changing by less than 24% when the input function with the fastest clearance rate was compared with the bolus-plus-infusion input.
Overall Prediction of In Vivo Performance
The predicted %COV[BPND] values of 28 compounds using a standard input function are given in Table 1. The in vivo performance prediction shows that widely accepted good ligands such as 11C-flumazenil and 11C-raclopride had small %COV[BPND] values of 2.02% and 2.55%, respectively, whereas poor imaging probes were identified by a higher %COV[BPND] such as 11C-(R)-PK11195 (13.34%, low signal) and 11C-GR205171 (>100%, near-irreversible kinetics). For targets with multiple regions of interest at varying densities, the model predicts the performance of the radioligand for each region. For example, 11C-FLB-457 was rated by the model as a good D2 ligand in the thalamus (2.23%) but a poor D2 ligand in striatum (27.75%). Within a specific target, the model was able to rank the candidates according to their %COV[BPND] values, and the results were generally consistent with the historical decisions made by scientists after evaluation of the in vivo PET data of all the candidate compounds. For example, of 4 candidates for the GlyT1 transporter, the model selected 11C-GSK931145 (2.11%) as the best ligand.
DISCUSSION
Motivated by the limitations of current approaches to radioligand discovery and development, we have introduced a biomathematical modeling approach that uses in silico/in vitro data of candidate molecules to predict their in vivo performance. The model incorporates components accounting for BBB penetration, specific binding, nonspecific binding, and kinetics and derives a relevant outcome metric (%COV[BPND]) from Monte Carlo simulations as a measure of in vivo performance. This approach is able to select promising ligands from a set of candidates, consistent with the decisions made by scientists after the evaluation of in vivo PET data. In addition, the ranking of different radioligands across targets is generally consistent with their known performance; that is, 11C-flumazenil and 11C-raclopride are ideal whereas 11C-(R)-PK11195 and 11C-GR205171 are not.
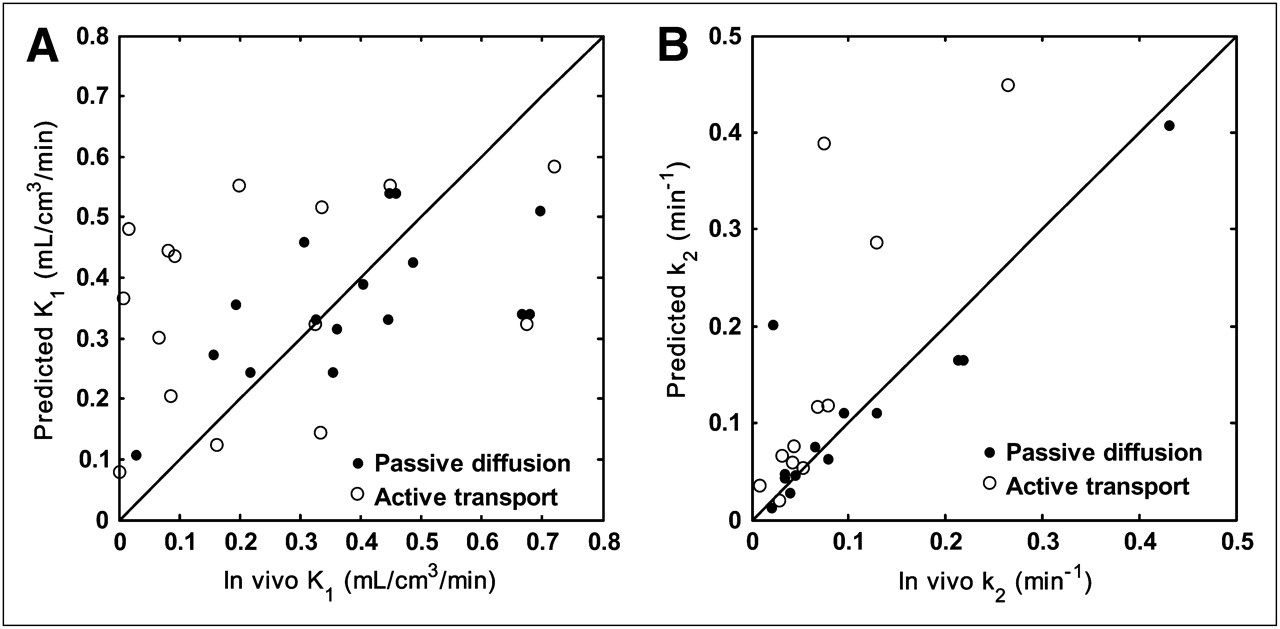
Nevertheless, given the complexity of radioligand design and in vivo biological systems, there are several limitations to our current model. For example, one of the weaknesses is that it assumes passive diffusion across the BBB. However, it is known that the endothelial membranes of the BBB contain several transport proteins that can actively transport compounds into the brain (e.g., transporters for amino acids and monocarboxylic acids) or efflux compounds from the brain (e.g., P-glycoprotein). Although several permeability models have been developed over the past few decades (10,32–34), none was able to accurately predict permeability for all the transport mechanisms because of the complexity of these active and facilitated transport systems in the BBB. We are aware that in our validation dataset there exist several compounds that are likely to cross the BBB actively, and these have been identified in a recent study combining equilibrium dialysis assays with in vivo PET data (31). To investigate this further, we excluded those compounds predicted to have active transport mechanisms and reassessed the correlation between the predicted and measured in vivo K1. The result showed that the correlation coefficient improved from 0.40 to 0.59 (Fig. 6A). Thus, if it were possible to add a model to predict active and passive transport, then the overall performance could be improved further.

Relationship between predicted and measured in vivo data partitioned according to likely passive diffusion and active transport status. (A) Relationship between predicted K1 values and those measured in vivo (r = 0.59, P = 0.017, active transport compounds excluded from correlation). (B) Relationship between predicted k2 values and those measured in vivo (r = 0.93, P < 0.0001, active transport compounds excluded from correlation). Line of identity is shown.
Similarly, because the prediction of k2 was based on the predicted K1 values under the assumption of passive diffusion, the correlation coefficient between the predicted and measured in vivo k2 was also improved from 0.85 to 0.93 (Fig. 6B) when we excluded those compounds predicted to have active transport mechanisms. In the validation of the model to predict k2, free fractions in plasma and tissue were measured using pig homogenate to be consistent with the in vivo PET data from pigs. Although the free fraction in tissue is generally constant across species (35), the free fraction in plasma can vary widely.
Species differences should be carefully considered, particularly in the prediction of BPND. Most of the homogenate-binding Bmax, KD, or Ki data used in our validation dataset were obtained in humans rather than in pigs, and these parameters may vary across species. Different in vitro assay conditions may also cause discrepancies between the predicted BPND values and those measured in vivo. First, the binding of ligands to their targets can be a temperature-dependent process, and ideally the incubation should be conducted at body temperature (37°C). In our validation dataset, however, the Ki values of most of the compounds were measured in human tissue at room temperature, which may lead to some discrepancy. Second, the difference in buffer may affect the final estimation as well. A physiological buffer (e.g., Tris-HCl or N-(2-hydroxyethyl)piperazine-N′-(2-ethanesulfonic acid) buffer at pH 7.4, with high concentration of Na+) should ideally be used to approximate the in vivo conditions. In addition, target density and affinity measured in the in vitro open cell environment using homogenate binding assays may be different from those estimated in vivo because of the complex in vivo environment that may involve target internalization and endogenous competition (e.g., D2 receptor (36)). Thus, care should be taken when using in vitro estimates to quantify the in vivo situation. For example, as shown in Table 1, there is a discrepancy between the prediction of NMSP in the striatum and actual in vivo experience. The predicted BPND value (2.86) is smaller than the in vivo value (15.4). This discrepancy could be explained by an underestimation of the affinity or the tissue free fraction. Another potential discrepancy between some of the predicted BPND values and those measured in vivo is due to the conversion coefficient from protein to wet weight α, which was assumed to be 10.
In addition, in our validation only the impact of clearance of the input function was considered, which was shown not to be critical on the overall outcome measure BPND and its associated performance metric (%COV[BPND]). Nevertheless, there are several factors that will lead to different plasma concentrations, and the ability to predict the plasma time course would further improve the accuracy of the biomathematical model. Prediction of the time course would require a prediction of the dosimetry profile and metabolism. Although predicting full dosimetry may be difficult, it may be possible to get some idea about metabolism through in silico/in vitro assays involving liver microsomes, for those compounds metabolized via the liver. The ability to predict metabolism has further consequences for the development of CNS radioligands because the production of radiolabeled lipophilic products that enter the brain may compromise radioligand quantification. Thus, if it were possible to screen out compounds that produce lipophilic metabolites, it would further reduce attrition in the development process.
Another limitation of our current approach is the lack of explicit selectivity screening. The model could easily be extended to take additional affinity (and associated Bmax) data from other targets to accordingly account for the selectivity of the radioligand. Finally, it would also be useful to capture information on radiolabeling feasibility of candidate molecules and include this in the overall prediction of success.
The approach discussed here has focused on CNS radioligand discovery and development. Nevertheless, this biomathematical framework could be generalized to develop radiotracers for disease understanding, diagnosis, and monitoring of therapies in other organs in addition to the brain. Appropriate modifications would necessitate an understanding of the underlying biological system and the desired outcome measure. For example, the development of a radiotracer for oncology applications in the body may require additional components to screen for metabolites and could choose an irreversible uptake rate constant as the outcome measure of interest.
CONCLUSION
A biomathematical modeling approach to CNS radioligand discovery and development has the potential to predict the in vivo performance of ligands from in silico/in vitro data before any in vivo work. This would enable us to target the right molecules for radiolabeling, efficiently leverage large compound databases, and significantly reduce the attrition in the development of successful CNS imaging probes.
Acknowledgments
We thank Laurent Martarello and Jan Passchier for many interesting and insightful discussions around radiochemistry, Cristian Salinas for guidance on the analysis of preclinical PET data, Graham Searle and Andri Tziortzi for discussions around data analysis, Mats Bergstrom and Christine Parker for discussions around in vitro assays of radioligand binding, Scott Summerfield for provision of the equilibrium dialysis data, Hugh Herdon for provision of GlyT1 data, and the Aarhus PET Centre staff for helping in the acquisition of all the in vivo PET data over a number of years of excellent collaboration. Software for performing the methodology presented in this paper may be freely obtained, for academic purposes, by emailing the author: qiguo0508{at}gmail.com. A portion of this work was funded by Biotechnology and Biological Sciences Research Council (U.K.) and GlaxoSmithKline.
Footnotes
-
COPYRIGHT © 2009 by the Society of Nuclear Medicine, Inc.
References
- Received for publication March 4, 2009.
- Accepted for publication May 21, 2009.


Jump to section
Related Articles
Cited By...
- The Use of Microdosing in the Development of Small Organic and Protein Therapeutics
- Prediction of the Clinical SUV Ratio in Amyloid PET Imaging Using a Biomathematic Modeling Approach Toward the Efficient Development of a Radioligand
- Possible overlapping time frames of acquisition and consolidation phases in object memory processes: a pharmacological approach
- Quantification of the Specific Translocator Protein Signal of 18F-PBR111 in Healthy Humans: A Genetic Polymorphism Effect on In Vivo Binding
- Radiosynthesis and Characterization of 11C-GSK215083 as a PET Radioligand for the 5-HT6 Receptor