


Abstract
Noninvasive imaging technologies have the potential to enhance the monitoring and improvement of adoptive therapy with tumor-targeted T lymphocytes. We established an imaging methodology for the assessment of spatial and temporal distributions of adoptively transferred genetically modified human T cells in vivo for treatment monitoring and prediction of tumor response in a systemic prostate cancer model. Methods: RM1 murine prostate carcinoma tumors transduced with human prostate-specific membrane antigen (hPSMA) and a Renilla luciferase reporter gene were established in SCID/beige mice. Human T lymphocytes were transduced with chimeric antigen receptors (CAR) specific for either hPSMA or human carcinoembryonic antigen (hCEA) and with a fusion reporter gene for herpes simplex virus type 1 thymidine kinase (HSV1tk) and green fluorescent protein, with or without click beetle red luciferase. The localization of adoptively transferred T cells in tumor-bearing mice was monitored with 2′-18F-fluoro-2′-deoxy-1-β-d-arabinofuranosyl-5-ethyluracil (18F-FEAU) small-animal PET and bioluminescence imaging (BLI). Results: Cotransduction of CAR-expressing T cells with the reporter gene did not affect CAR-mediated cytotoxicity. BLI of Renilla and click beetle red luciferase expression enabled concurrent imaging of adoptively transferred T cells and systemic tumors in the same animal. hPSMA-specific T lymphocytes persisted longer than control hCEA-targeted T cells in lung hPSMA-positive tumors, as indicated by both PET and BLI. Precise quantification of T-cell distributions at tumor sites by PET revealed that delayed tumor progression was positively correlated with the levels of 18F-FEAU accumulation in tumor foci in treated animals. Conclusion: Quantitative noninvasive monitoring of genetically engineered human T lymphocytes by PET provides spatial and temporal information on T-cell trafficking and persistence. PET may be useful for predicting tumor response and for guiding adoptive T-cell therapy.
Adoptive transfer of tumor-specific T cells into the tumor-bearing host is both a fundamental experimental approach for the study of tumor immunity and a potential therapy. Genetic strategies aim to enhance cellular antitumor immunity in cancer patients (1,2). Genetic reprogramming may be used to improve T-cell survival, augment T-cell expansion, and offset T-cell anergy and immunosuppression. Tumor-specific T cells can be generated by the transfer of genes that encode chimeric antigen receptors (CAR). Over the past decade, studies have demonstrated the in vivo efficacy of CAR-grafted and natural T-cell receptor–grafted lymphocytes against a wide variety of tumor antigens (3–11). This approach has been investigated in mouse models with human peripheral blood lymphocytes and patient-derived tumor cell lines as well as in clinical trials (12).
Prostate-specific membrane antigen (PSMA) is an attractive target molecule for immunotherapy in patients with advanced prostate cancer. Gade et al. recently reported successful targeting of human PSMA (hPSMA)–positive tumors with human T lymphocytes grafted with anti-hPSMA CAR in a mouse model (13). However, despite high hPSMA-specific cytotoxic potential, only 50% of animals with orthotopic prostate tumors and 30% of mice with systemic tumors were cured. Continuous monitoring of the spatial distribution and dynamics of T-cell trafficking and persistence at tumor sites should help lead to an understanding of the impact of genetically modified T cells on therapy outcome. Because treatment results largely depend on multiple dynamic cell interactions, the monitoring of T-cell immunotherapy must be performed in a physiologic context. Noninvasive imaging of adoptively transferred T cells enables the study of T-cell homing, survival, and persistence as well as the assessment and prediction of therapeutic efficacy.
Several groups have demonstrated the feasibility of in vivo monitoring of adoptively transferred antigen-specific T cells transduced to express a herpes simplex virus type 1 thymidine kinase (HSV1tk) reporter gene in animal models. Murine splenocytes expressing HSV1sr39tk were shown to traffic to locally implanted subcutaneous tumors by PET with 9-4-18F-fluoro-3-(hydroxymethyl)butylguanine (14–16). Human HSV1tk-transduced T lymphocytes targeting subcutaneous Epstein–Barr virus–positive and Wilms' tumor antigen–positive xenografts were successfully imaged by PET with 2′-fluoro-2′-deoxy-1-β-d-arabinofuranosyl-5-124I-iodouracil (17) and 2′-18F-fluoro-2′-deoxy-1-β-d-arabinofuranosyl-5-ethyluracil (18F-FEAU) (18), respectively. There have been no published data on nuclear reporter gene imaging of T cells targeting systemic tumors as a more clinically relevant cancer model.
In this study, we used a systemic prostate carcinoma model for repetitive monitoring of hPSMA-targeted T cells by PET and bioluminescence imaging (BLI). We show that quantitative PET can be used not only for monitoring the spatial and temporal distributions of CAR-bearing T cells but also for predicting T-lymphocyte efficacy and therapy outcome. Moreover, this is the first study in which both therapeutic and nuclear reporter genes have been successfully cointroduced and coexpressed in human peripheral blood T lymphocytes and shown to be fully functional in transduced cells.
MATERIALS AND METHODS
Retroviral Vectors
The SFG-nesHSV1tk/GFP retroviral vector, which carries the constitutively expressed HSV1tk/green fluorescent protein (GFP) reporter gene, was described previously (19). The SFG-nesHSV1tk/GFP/CBRluc (nTGCBR) retroviral vector was produced by subcloning click beetle red luciferase (CBRluc) complementary DNA (cDNA) from the pCBR basic vector (Promega) into the SFG-nesHSV1tk/GFP/firefly luciferase retroviral vector (20) by replacing the firefly luciferase gene. A dimeric form of red fluorescent protein (RFP), tDimer RFP cDNA (kindly provided by Dr. Roger Tsien, University of California, San Diego, CA), was fused in a single frame with synthetic Renilla luciferase (Rluc) cDNA (Promega) and subcloned into the SFG-nesHSV1tk/GFP retroviral vector, replacing nesHSV1tk/GFP cDNA. The resulting vector was named SFG-RFP/Renilla luciferase (RFP/Rluc). Retroviral vectors encoding the hPSMA-specific chimeric antigen receptor (Pz1) and the B7.1 costimulatory molecule were described previously (21). A retroviral vector encoding the carcinoembryonic antigen (CEA)–specific chimeric antigen receptor (BW431/26-scFv-Fc-CD3ζ; Cz1) was kindly provided by Dr. Hinrich Abken (Universität zu Köln, Cologne, Germany) (22). The bicistronic SFG-PIP retroviral vector carries the hPSMA and puromycin resistance genes (21). Human CEA (hCEA) cDNA (kindly provided by Dr. Jeffrey Schlom, National Institutes of Health, Bethesda, MD) and a neomycin resistance gene were subcloned into the SFG-PIP retroviral vector, replacing the hPSMA and puromycin resistance genes, respectively. The resulting vector was named SFG-CIN.
Cell Line Preparation and Maintenance
NIH3T3 fibroblasts and retroviral producer cell line PG13 (American Type Culture Collection) were cultured in Dulbecco's modified Eagle medium with a high glucose concentration and 10% fetal calf serum and supplemented with 2 mM l-glutamine (Invitrogen). NIH3T3 B7.1 (CD80)–positive cells were transduced with bicistronic vector SFG-PIP or SFG-CIN. Fresh viral supernatants from PG13 cells were used for T-cell transductions. Murine prostate carcinoma cell line RM1 was cultivated in Dulbecco's modified Eagle medium with a high glucose concentration and supplemented with sodium pyruvate at a concentration of 110 mg/L, 10% fetal bovine serum (Hyclone), and l-glutamine at a concentration of 2 mmol/L. RM1 cells were transduced with hPSMA and the RFP/Rluc reporter gene. After transduction, the cells were sorted on the basis of RFP expression, and hPSMA-expressing cells were selected with puromycin at a concentration of 3 μg/mL.
T-Cell Transduction and Expansion
Peripheral blood (100 mL) was drawn from healthy donors who gave informed consent. At 48 h after stimulation with phytohemagglutinin at a concentration of 2 μg/mL, T cells were transduced with the Pz1- or Cz1-encoding retroviral vector as described previously (13) in the presence of interleukin 2 (20 U/mL). On day 7, CAR-transduced T cells were selectively expanded by cocultivation with NIH3T3 target cells expressing B7.1. At 48 h after restimulation on hPSMA-positive NIH3T3 target cells (for Pz1-positive T cells) or hCEA-positive NIH3T3 target cells (for Cz1-positive T cells), T lymphocytes were transduced with retroviral vector SFG-nesHSV1tk/GFP or SFG-nTGCBR. During T-cell expansion, the medium was supplemented with interleukin 15 at a concentration of 10 ng/mL every 3 d.
Flow Cytometry
Pz1 and Cz1 CAR expression was detected with phycoerythrin-conjugated cross-reactive goat antimouse IgG (Calbiochem) and phycoerythrin-conjugated F(ab′)2 antihuman IgG1 (Southern Biotechnology), respectively. Antihuman antibodies against CD3, CD4, CD8, and CD80 (BD Biosciences) were used. hPSMA and hCEA were detected on tumor cells with antibody J591 (kindly provided by Dr. Neil Bander, Weill Medical College of Cornell University, New York, NY) and anti-hCEA antibody (anti-CD66 antibody; Pharmingen), respectively. Stained cells were processed with a FACScan (BD Biosciences) instrument and analyzed with Cell Quest software (BD Biosciences).
3H-FEAU Accumulation Assays In Vitro
Radiotracer accumulation assays were performed as described previously (23). The cells were seeded at a density of 2 × 10⁶ cells per milliliter in 75-cm3 tissue culture flasks (Nunc). The cells were harvested after various periods of incubation (30, 60, and 120 min) with [methyl-3H]FEAU at 3.7 kBq/mL (1.48 TBq/mmol) (Moravek Biochemicals) and assayed for radioactivity concentrations with a TriCarb 1600 β-spectrometer (Packard) by standard 3H channel counting techniques. The data were expressed as a harvested cell-to-medium concentration ratio: ([disintegrations per minute] per gram of cells per minute)/([disintegrations per minute] per milliliter of medium per minute). This ratio is a measure of HSV1tk reporter gene activity and correlates with independent measures of gene expression.
Target-Specific Cell Lysis Assay
The cytolytic activity of genetically modified T cells was assessed in a 4-h chromium release assay on the day of injection (13). Specific 51Cr release was calculated according to the following formula: percentage of specific lysis = [(cpm of experimental release – cpm of spontaneous release)/(cpm of maximum release – cpm of spontaneous release)] × 100.
Xenograft Tumor Model for Adoptive Immunotherapy
Immunodeficient 6- to 8-wk-old SCID/beige mice (Taconic) were used. For establishment of a lung tumor model for prostate cancer, mice were challenged with 10,000 RM1 murine prostate carcinoma cells expressing hPSMA and the RFP/Rluc reporter gene by tail vein injection. Human T lymphocytes transduced with a chimeric receptor specific for either hPSMA (Pz1) or hCEA (Cz1) and cotransduced with a reporter vector were adoptively transferred into tumor-bearing mice. A total of 20 × 106 CAR-positive, GFP-positive T lymphocytes were injected via the tail vein on 2 consecutive days. Nontreated tumor-bearing mice were used as negative controls.
BLI
BLI was performed with a Xenogen IVIS 200 Imaging System (Xenogen). Mice were anesthetized with 2% isoflurane and injected with either coelenterazine (Biotium; 10 μg per animal) for RM1 RFP/Rluc-positive tumor cell imaging or d-luciferin (Xenogen; 1,500 μg per animal) for imaging of CBRluc-transduced T cells. Coelenterazine was used as the initial substrate for imaging of RLuc expression. Imaging of CBRluc expression with d-luciferin was performed 5 h later, when the Rluc signal was no longer detectable in the animals. Whole-body images were obtained and analyzed by previously described protocols (24) with Living Image 2.50 software (Xenogen). The time of acquisition varied from 1 to 3 min. The mean number of photons per square centimeter per second per steradian in the region of interest (ROI) (lungs) was determined.
Micro-CT Imaging
Micro-CT imaging was performed with a MicroCAT II CT scanner (ImTek Inc.) as described previously (13). Images were reconstructed 3 dimensionally with the Feldkamp cone-beam filtered backprojection algorithm provided by the manufacturer. Total CT acquisition time was ∼10 min, and the spatial resolution was ∼250 μm. Visualization and analyses of CT images were performed with Amira software (Konrad-Zuse-Zentrum für Informationstechnik Berlin and Indeed Visual Concepts GmbH). Heart and blood vessel contrast was achieved via intravenous administration of Fenestra VC (Alerion Biomedical Inc.).
PET Imaging with 18F-FEAU
No-carrier-added 18F-FEAU was prepared as described previously (25). Mice were anesthetized with 2% isoflurane. PET was performed at 2 h after intravenous administration of 7.4 MBq (200 μCi) of 18F-FEAU per animal with a 3-dimensional (3D) small-animal R4 microPET scanner (Concorde Microsystems) (energy window of 350–750 keV and timing window of 6 ns) (26). The duration of the emission scans was 10 min, with ∼106 events per acquisition. The list-mode data were sorted into sinograms by Fourier rebinning and reconstructed with an ordered-subset expectation maximization iterative reconstruction algorithm without attenuation or scatter correction. Radioactivity concentrations in tumors (percentage injected dose per gram of tissue [%ID/g]) were measured from the PET images with ASIPro software (Concorde Microsystems) by use of a system calibration factor determined from an 18F-filled mouse-size phantom. Quantification of the specific signal above the background was performed by calculating the ratio of %ID/g in the ROI (lungs) to %ID/g in a background region (15). Micro-CT/small-animal PET fusion images were produced and analyzed with ASIPro software. Registration of the micro-CT and small-animal PET images was performed manually by use of a rigid transform derived by interactive rotation and translation of the 3D small-animal PET and micro-CT image sets with respect to one another.
Histologic Analysis
Histopathologic examination of the specimens was performed as described previously (27). For immunohistochemical analysis, lung tissues were preserved in 4% paraformaldehyde. For immunofluorescence analysis, freshly isolated tumor tissue was frozen in optimum cutting temperature compound (Sakura Finetek). The immunohistochemical reaction was carried out with paraffin-embedded specimens and the following monoclonal antibodies: anti-hPSMA 13d6 (kindly provided by Dr. P. Gregor, Memorial Sloan-Kettering Cancer Center [MSKCC]), anti-hCD8 (Dako), anti-GFP (Invitrogen), and secondary biotinylated horse antimouse IgG (BMK-2202; Vector). For immunofluorescence analysis, the specimens were incubated with mouse anti-hPSMA monoclonal antibody 7C12 (kindly provided by Dr. Polly Gregor) and anti-GFP rabbit polyclonal IgG (sc-8334; Santa Cruz Biotechnology) and then with secondary antimouse antibodies Alexa Fluor 555 and Alexa Fluor 488 (Invitrogen), respectively. Microscopy of live GFP and RFP fluorescence in selected animals was performed on the days of PET. For the visualization of nuclei, 4,6-diamidino-2-phenylindole was used. Immunofluorescence was assessed with a fluorescence microscope (Axioplan-2; Carl Zeiss Microimaging Inc.).
Statistics
Data were analyzed with GraphPad Prism (version 4) software (GraphPad Software). A Mann–Whitney test was applied for comparing 2 independent groups. P values of <0.05 were considered to be statistically significant. Survival analysis was performed with the Kaplan–Meier method, and curves were compared in a log-rank test. Linear regression analysis was used to fit the quantitative small-animal PET data to days after tumor cell injection.
RESULTS
Characterization of T Lymphocytes and Tumor Cells in Vitro
Cell surface expression of CAR, T-cell markers, and GFP fluorescence were assessed by fluorescence-activated cell sorting on the day of T-cell injection. The data are summarized in Supplemental Figures 1A and 1B (supplemental materials are available online only at http://jnm.snmjournals.org). For BLI T-cell experiments, 74% of Pz1-positive and 84% of Cz1-positive injected cells were GFP positive (CAR and nTGCBR positive) on the day of T-cell injection. For small-animal PET T-cell experiments, 74% of Pz1-positive and 87% of Cz1-injected cells were GFP positive (CAR and HSV1tk/GFP positive). CAR- and GFP-positive cells were predominantly positive for the CD8 T-cell marker. T lymphocytes transduced with Pz1 exhibited cytotoxicity against hPMSA-positive target cells but not against hCEA-positive target cells. In contrast, Cz1-grafted T cells were highly cytotoxic against hCEA-positive target cells but not against hPSMA-positive target cells. Cotransduction of T cells with reporter genes did not affect cytolytic activity against the corresponding targets (Supplemental Figs. 1C and 1D). The levels of 3H-FEAU accumulation in CAR- and HSV1tk/GFP-transduced T lymphocytes in vitro were comparable in both the Pz1-treated group and the Cz1-treated group and were sufficient for successful imaging with PET (Supplemental Fig. 1E). All RM1 tumor cells expressed hPSMA and RFP/Rluc on the day of injection (data not shown).
BLI of T-Cell Distribution and Persistence
RM1 tumor cells expressing hPSMA and RFP/Rluc were injected 7 d before T-cell adoptive transfer. Rluc expression was near background levels in both (Pz1-treated and Cz1-treated) groups on the day of T-cell injection. In vivo tracking of the adoptively transferred T cells, transduced with either Pz1 or Cz1 CAR and the nTGCBR reporter gene, was performed by BLI of CBRluc expression in T cells. Different substrates were used for the imaging of Rluc and CBRluc expression; therefore, we were able to image Rluc and CBRluc in the same animals on the same days without signal interference.
Dynamic BLI of T-cell localization and persistence and tumor progression in 2 representative animals from each group is shown in Figure 1. The highest signal intensity on the first day (+1) after T-cell injection was detected in the lungs, liver, and spleen in both groups. The bioluminescence signal intensity in the lungs gradually decreased by day +6 in both groups. However, the bioluminescence signal intensity in the lungs was significantly higher on days +1, +2, and +3 after T-cell injection in the Pz1-treated group than in the Cz1-treated group (P = 0.008, P = 0.031, and P = 0.008, respectively) (Fig. 2). We observed an increase in the bioluminescence signal intensity in the spleens in the Pz1-treated group on days +2 and +3 after T-cell injection, with a subsequent decline on day +6 (data not shown).
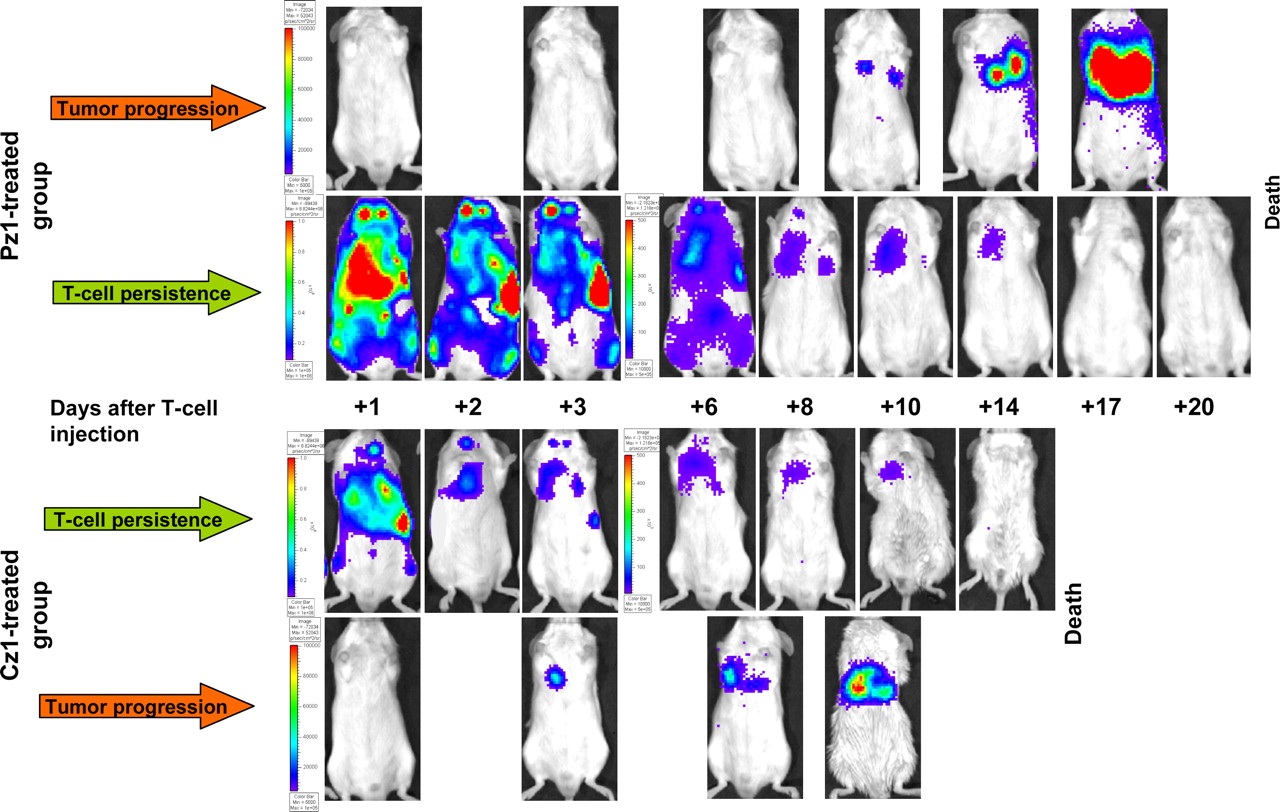
BLI of adoptively transferred T-cell persistence and tumor progression. T-cell distribution and persistence were imaged with CBRluc and d-luciferin. Tumor progression was imaged with Rluc and coelenterazine. Data for 2 representative animals from Pz1-treated and Cz1-treated groups are shown. Note different scales for assessment of T-cell bioluminescence signal intensities on days +1–3 and +6–20 after T-cell injection. Same scales were used for assessment of tumor BLI data.

Quantitative analysis by BLI of adoptively transferred T-cell persistence and tumor progression in individual animals. Solid lines represent bioluminescence signal intensity for T-cell BLI; dotted lines represent that for tumor BLI. (A) All animals in Pz1-treated group showed uniform decrease in bioluminescence signal from T cells with pronounced delay by day +3. Mouse 5 in Pz1-treated group showed early tumor progression, similar to that in Cz1-treated group. (B) In all animals in Cz1-treated group, T-cell bioluminescence signal decreased rapidly without any delay. ph = photons; sr = steradian.
As indicated by BLI of Rluc, tumor progression was faster in the Cz1-treated group than in the Pz1-treated group, but the difference did not reach statistical significance. We observed a significant survival advantage for the Pz1-treated group relative to the Cz1-treated group (P = 0.035) (Supplemental Fig. 2).
Quantitative Small-Animal PET Imaging of Genetically Modified T Lymphocytes
In another experiment, T cells transduced with either Pz1 or Cz1 CAR and the HSV1tk/GFP reporter gene were administered via tail vein injection 10 d after mice were challenged with hPSMA- and RFP/Rluc-positive RM1 cells. By that time, extensive tumors were detectable by BLI in all animals. A separate group of tumor-free animals was injected with Pz1- and HSV1tk/GFP-positive T cells. Small-animal PET imaging of 18F-FEAU accumulation was performed on the day of T-cell injection (day 0) and was repeated on days +3 and +6 thereafter. By calculating the ratio of the %ID/g for 18F-FEAU in the ROI (lungs) to the %ID/g in the region with background levels of radiotracer accumulation (muscle), we were able to avoid variability between images over time. The %ID/g values in the regions with background levels of tracer accumulation were comparable in all groups of animals at all time points (0.069 ± 0.032 [mean ± SD] %ID/g). T cells were detected diffusely in the lungs in both the Pz1-treated group and the Cz1-treated group on the day of T-lymphocyte injection (day 0) (Fig. 3A). On the day of T-cell injection, focus (lungs)-to-background ratios were comparable in both (Pz1-treated and Cz1-treated) groups (Fig. 3B). There was no 18F-FEAU accumulation in nontreated tumor-bearing mice (negative controls). In contrast, by day +3, we were able to detect distinct 18F-FEAU accumulation in the lungs only in tumor-bearing animals injected with hPSMA-specific T cells (Fig. 3A). The focus-to-background ratio was significantly higher in this group than in the group injected with hCEA-specific T lymphocytes (2.16 ± 0.32 vs. 1.16 ± 0.07; P = 0.024) (Fig. 3B). On day +6 after T-cell transfer, there was no 18F-FEAU accumulation in the lungs in either group. These results were confirmed in at least 2 independent experiments.
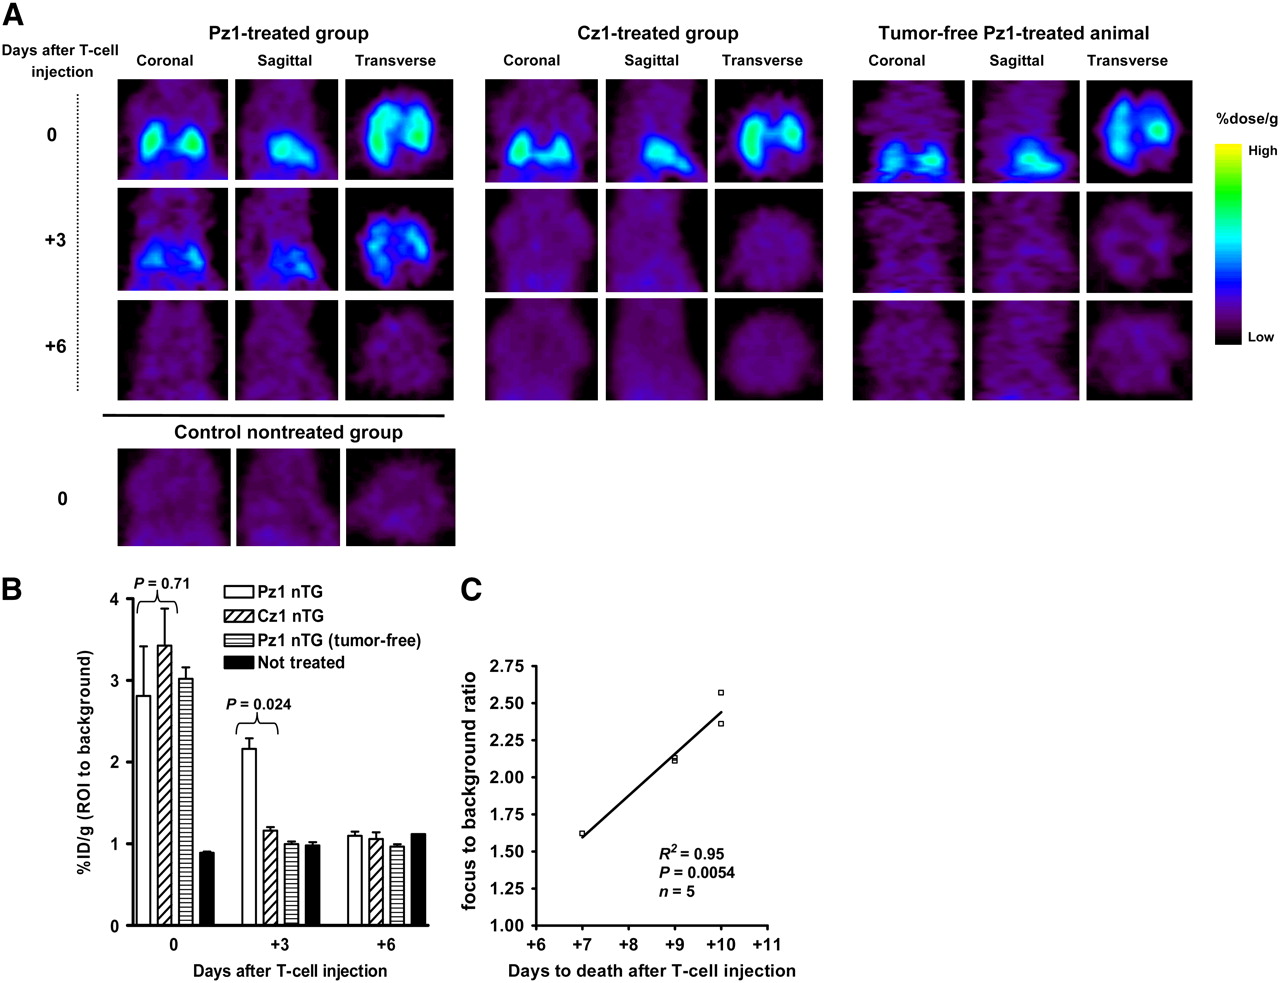
Small-animal PET imaging of 18F-FEAU accumulation at different time points after adoptive transfer of CAR-positive, HSV1tk/GFP-positive T lymphocytes. (A) Three mutually perpendicular projections for typical Pz1-treated, Cz1-treated, and nontreated tumor-bearing and Pz1-treated tumor-free animals are presented. On day of T-cell injection (day 0), highly intense small-animal PET signal clearly demonstrated presence of pooled T cells in lung areas of treated animals. By day +3, 18F-FEAU accumulation was detected only in Pz1-treated tumor-bearing animals. No radiotracer accumulation was detected on day +6. (B) Small-animal PET signal quantitation performed as described in Materials and Methods. Statistically significant differences in levels of 18F-FEAU accumulation between Pz1- and Cz1-treated tumor-bearing animals were observed on day +3. Columns represent means; bars represent SEMs. (C) Regression analysis of T-cell persistence in and overall survival of Pz1-treated tumor-bearing animals. Ratios of %ID/g in ROI to %ID/g in background for individual animals on day +3 were plotted against time to death. Nearly linear relationship (R2 = 0.95) between small-animal PET signal intensity and survival was revealed.
The levels of tumor progression, as assessed by BLI, differed between the animals and was inversely correlated with the levels of 18F-FEAU accumulation in the lungs on day +3 (Supplemental Fig. 3). A survival advantage was observed for the Pz1-treated group relative to the Cz1-treated group (P = 0.0136) (data not shown). A linear relationship between 18F-FEAU accumulation and time to death was observed for all animals in the Pz1-treated group (Fig. 3C).
Detailed Analysis of Small-Animal PET/Micro-CT Fusion Imaging
Micro-CT imaging with vasculature contrast enhancement revealed an established nodular pattern of tumor progression. A detailed analysis of small-animal PET/micro-CT coregistration was performed by estimating the levels of 18F-FEAU accumulation in the regions of intrathoracic tumors, large vessels, and lung parenchyma. The images of one representative animal from each tumor-bearing group on day +3 are shown in Figure 4. Higher levels of accumulation of 18F-FEAU were found by small-animal PET imaging at the sites corresponding to the tumor foci on micro-CT images for the Pz1-treated animal (Fig. 4A, boxes 1, 2, 4, and 5) but not in the lung parenchyma or vessels (Fig. 4A, boxes 3 and 6). To address whether T-cell accumulation was specific, we analyzed small-animal PET/micro-CT data from Cz1-treated and nontreated animals; no differences in the levels of 18F-FEAU accumulation in various thoracic regions were found in these animals (Figs. 4B and 4C). A quantitative analysis of 18F-FEAU accumulation is shown in Table 1.
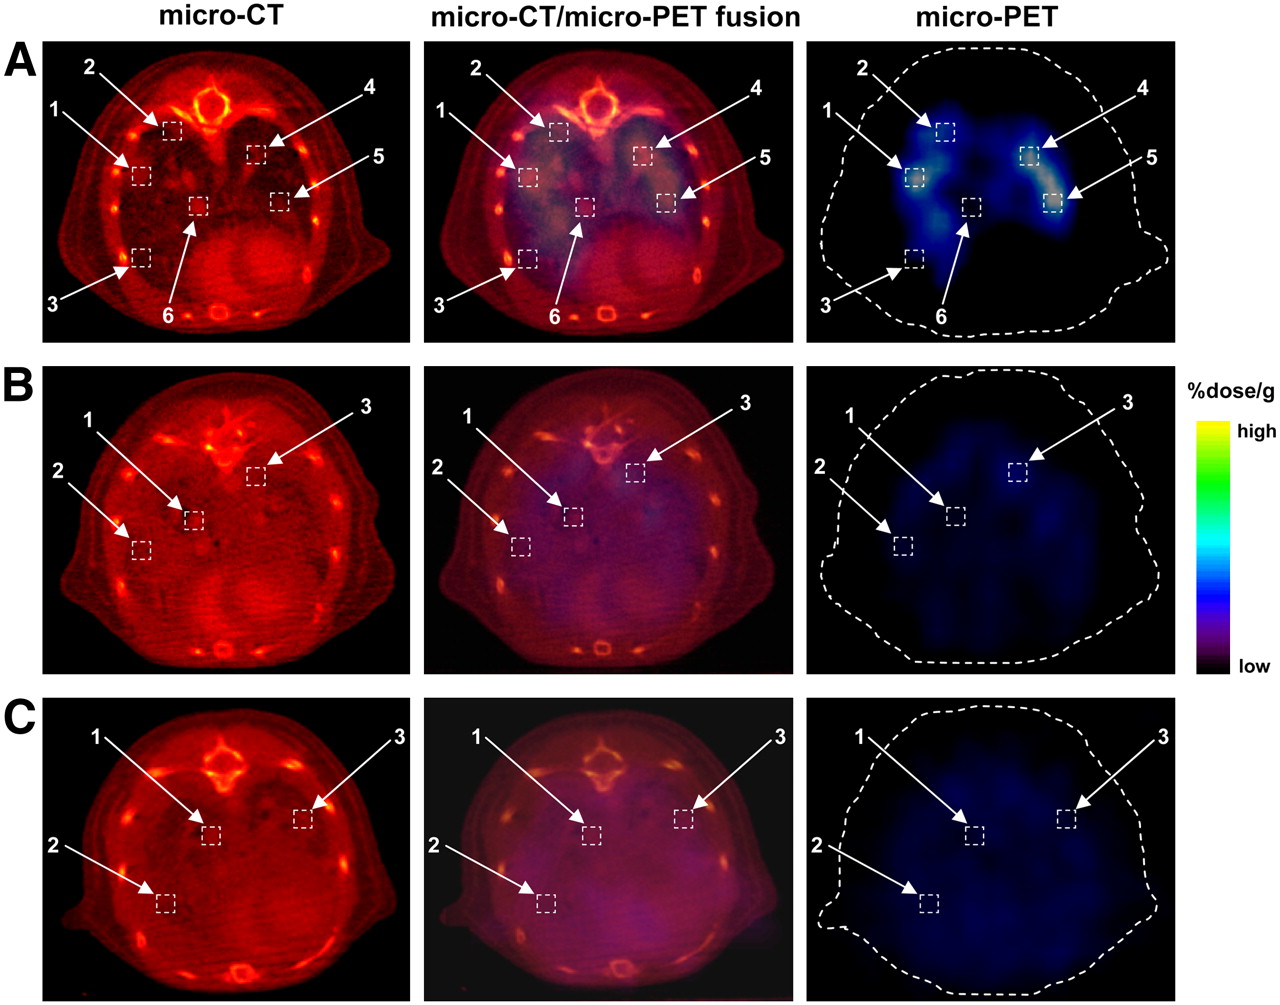
Small-animal PET/micro-CT fusion imaging and analysis. Analysis of colocalization of 18F-FEAU accumulation on small-animal PET images with tumor regions or thoracic structures (vessels and lung parenchyma) on micro-CT images is shown. One representative tumor-bearing animal each from Pz1-treated (A), Cz1-treated (B), and control nontreated (C) groups is shown. (A) In Pz1-treated animals, highest levels of 18F-FEAU accumulation were detected (boxes 1, 2, 4, and 5) in regions corresponding to tumor foci on micro-CT image. Lower signal intensity was observed in intact lung parenchyma and blood vessel zones (boxes 3 and 6, respectively). (B and C) In contrast, Cz1-treated (B) and nontreated (C) animals had low small-animal PET signal intensities (boxes 1, 2, and 3) in selected anatomic areas on micro-CT images. Heart and blood vessels were enhanced by vasculature contrast agent Fenestra VC. Quantitative analysis of 18F-FEAU accumulation is shown in Table 1.
Ratios of %ID/g in ROI to %ID/g in Background, as Calculated from Small-Animal PET Images
Histologic Analysis
The presence of hPMSA-positive tumors was revealed by immunohistochemical staining for all groups (except for the tumor-free group) in both experiments (BLI and small-animal PET). Tumor specimens taken postmortem from animals treated with Pz1-tranduced T cells contained GFP-positive cells, whereas no GFP-positive cells were found in specimens taken from nontreated animals or animals treated with Cz1-transduced T cells (Fig. 5). In addition, fluorescence microscopy revealed the localization of GFP-positive cells in RFP-positive tumors predominantly in animals treated with Pz1-transduced T cells on days +3 and +6 after T-cell injection (Supplemental Fig. 4). Immunohistochemical staining for human CD8 and GFP confirmed the presence of human GFP-positive T cells in lung tumors (Supplemental Fig. 5).
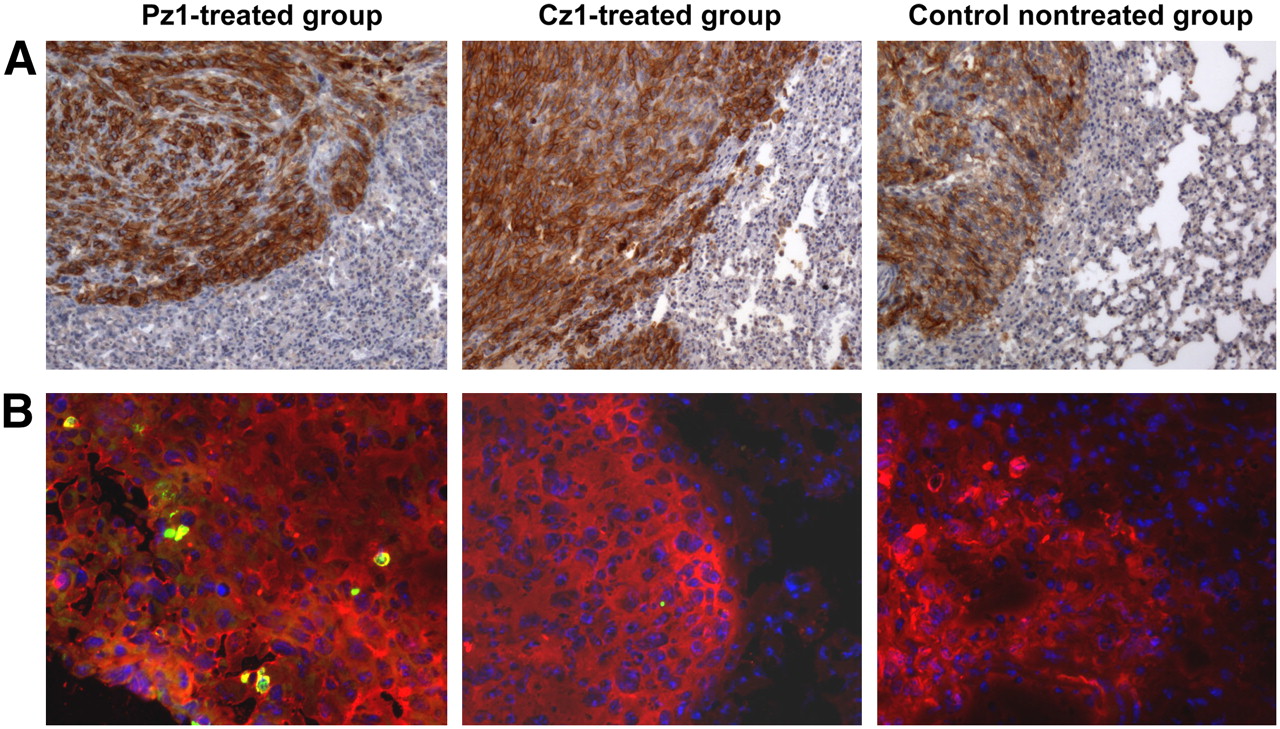
Histologic analysis of tumor specimens. (A) Anti-hPSMA antibody immunohistochemical staining revealed presence of hPSMA-positive tumor cells in lungs from representative Pz1-treated, Cz1-treated, and nontreated tumor-bearing animals in small-animal PET imaging experiment. Magnification, ×10. (B) Anti-GFP antibody was used for immunofluorescence microscopy of HSV1tk/GFP-expressing T cells (green) infiltrating hPSMA-positive tumors (red; stained with anti-hPSMA antibody). Nuclei were stained with 4,6-diamidino-2-phenylindole (blue). Magnification, ×20. Similar results were obtained in BLI experiment.
DISCUSSION
We and others previously demonstrated PET of adoptively transferred T lymphocytes using an HSV1tk reporter gene and in vivo labeling with short- and long-lived radiotracers. These studies demonstrated repetitive monitoring of antigen-specific mouse and human T cells targeting locally induced and subcutaneous tumors (14–18). In this study, we showed for the first time successful repetitive 18F-FEAU PET and BLI of CAR-grafted human T cells in a systemic prostate carcinoma model.
The immunotherapeutic efficiency of genetically modified T lymphocytes was recently shown in several animal tumor models (8,13,28–30). Gade et al. demonstrated successful eradication of hPSMA-positive RM1 murine prostate carcinoma tumors in lungs with human T lymphocytes transduced with anti-hPSMA CAR in a mouse model (13). It is noteworthy that RM1 is a very aggressive tumor, which forms nodules primarily in the lungs and later in the peripheral lymph nodes and which leads to the death of animals within 2–3 wk after tail vein inoculation of 5,000–10,000 tumor cells. In our initial experiments, we made numerous attempts to image Pz1-grafted T cells injected immediately after hPSMA-positive RM1 tumor cell administration, but we were not able to confirm the prolonged persistence of T cells in the lungs by small-animal PET. A short period of time between tumor cell inoculation and T-cell injection could result in the persistence of a small portion of injected T cells that engage tumor targets. In the experiments reported here, we explored the feasibility of imaging hPSMA-specific T cells targeting well-established hPSMA-positive lung tumors. The results of these experiments showed that in this systemic model, T cells persisted at tumor sites in an antigen-specific manner and had a substantial impact on animal survival.
The introduction of optical (28,30,31) or radionuclide-based (14,17) reporter genes into tumor and immune cells permits new insights into the biology of tumor–immune cell interactions with excellent temporal and spatial characteristics. Our study is the first to combine both therapeutic (CAR) and PET components through the use of genetic modifications of primary human T lymphocytes. We showed that the cotransduction of CAR-expressing T cells with a nuclear reporter gene did not impair CAR-mediated cytotoxicity and allowed for reliable PET of T lymphocytes during the course of adoptive immunotherapy. This approach potentially can be translated into clinical practice to permit the noninvasive monitoring of adoptive cell therapies with genetically modified T lymphocytes.
In our initial experiments, we used CBRluc to track the migration and persistence of genetically modified human T lymphocytes grafted with anti-hPSMA or anti-hCEA CAR. Tumor progression was monitored by Rluc BLI in the same animals. We were able to demonstrate a sustained Pz1-positive T-cell bioluminescence signal in lung tumors that was significantly higher on days +1–3 after T-cell injection than it was in the Cz1-treated control animals. We observed a transient accumulation of T cells in the spleen on days +1–3 and a subsequent decline by day +6 in the Pz1-treated animals. This latter observation may imply a possible redistribution of human T cells in a xenogeneic environment, the mechanisms for which are yet to be elucidated.
We were not able to correlate T-cell bioluminescence signal intensity in each animal with tumor progression and overall survival under these conditions. We found that despite reliable optical imaging of tumor progression, BLI failed to assess small differences in T-cell dynamics between individual animals. Two-dimensional imaging does not allow for precise quantitative analysis of T-cell persistence because of a high degree of variation in bioluminescence signal intensity that substantially depends on lymphocyte localization (such as depth or distribution in a tissue volume), tissue attenuation, and nonequivalent animal body positioning during different imaging sessions. Nevertheless, BLI still can be used as a cost-effective and high-throughput imaging method for the longitudinal assessment of T-cell distributions in vivo.
In contrast to photon emission, γ-arrays are not substantially influenced by tissue thickness, localization of cells in the ROI, or the position of the animal. To circumvent this limitation of BLI, we took advantage of the HSV1tk nuclear reporter gene for in vivo labeling of T cells with 18F-FEAU and quantitative PET. This thymidine-based, short-lived (18F half-life, ∼2 h) radiotracer is suitable for high-contrast repetitive PET because of its fast clearance and low background accumulation in normal, nontransduced tissues (25,32). According to the studies of Zanzonico et al., HSV1tk-transduced T cells can be labeled to at least 1,300 cGy without any loss of target cell cytotoxicity or specificity (33); this value is approximately 17 times greater than the total absorbed dose estimate based on cell-level dosimetry for the 18F-FEAU study performed (Pat Zanzonico, written communication, 2006). Therefore, HSV1tk reporter gene imaging with 18F-FEAU can be safely incorporated into immunotherapy protocols with CAR for patients with disseminated prostate cancer.
Our experiments were mainly focused on quantitative small-animal PET imaging of T-cell localization and persistence. Small-animal PET data indicated that in our model, only antigen-specific lymphocytes could persist for up to 3 d at tumor-positive sites, a finding that was confirmed by histologic analysis (Supplemental Fig. 4). 18F-FEAU accumulation on day +3 was negatively correlated with tumor bioluminescence signal intensities on day +6 in each animal in the Pz1-treated group (Supplemental Fig. 3). A nearly linear relationship was observed between 18F-FEAU accumulation on day +3 and overall survival in individual animals in the Pz1-treated group (Fig. 3C). These findings confirmed that nuclear imaging techniques allow for quantitative measurements of genetically modified T-cell localization and persistence at tumor sites over time and can be used for the prediction of tumor response and therapy outcome.
We did not anticipate any long-term remissions in our studies, because the treatment was applied to animals with a large tumor burden. It is important that the first generation of CAR (without costimulatory motifs) was used in this study. The rapid decline in PET signal intensities can be explained by the lack of costimulation and exogenous cytokine support required for prolonged T-cell survival (8,34). Therefore, we observed only a delay in tumor progression and not complete tumor rejection.
Modern radiologic examination requires precise colocalization of anatomic imaging and functional imaging. PET/CT is routine clinical practice in many medical centers. We showed the feasibility of multimodality imaging for 3D colocalization of tumor sites and reporter gene–expressing, CAR-positive T lymphocytes in our systemic tumor model. Detailed analysis showed that the localization of CAR-positive tumor-specific T cells corresponded to the areas of established tumors but not to normal lung tissue or vessel structures. PET allowed for precise quantitation of T-cell distributions at tumor sites. This key feature makes PET the method of choice for the noninvasive monitoring of adoptive immunotherapy with tumor-targeted genetically modified T lymphocytes in cancer patients.
CONCLUSION
We conclude that quantitative noninvasive monitoring of genetically modified human T lymphocytes by 18F-FEAU PET of HSV1tk reporter gene expression in a systemic tumor model is feasible. This imaging methodology potentially can be translated into clinical practice to provide spatial and temporal information on CAR-positive T-cell trafficking and persistence, as well as for treatment monitoring and the prediction of tumor response and therapy outcome.
Acknowledgments
We thank Dr. Ronald Finn, Dr. Pat Zanzonico, Bradley Beattie, Victoriya Zakhaleva (MSKCC), and Dmitry Pankov for their expert technical assistance. We thank Juri Gelovani (M.D. Anderson Cancer Center) for his long-term support. This work was supported by NIH grants P50 CA86438-01, P01 CA59350, and R01 CA102352; Mr. William H. Goodwin and Mrs. Alice Goodwin; the Commonwealth Cancer Foundation for Research; and the Experimental Therapeutics Center of Memorial Sloan-Kettering Cancer Center.
Footnotes
-
COPYRIGHT © 2008 by the Society of Nuclear Medicine, Inc.
References
- Received for publication September 17, 2007.
- Accepted for publication April 1, 2008.


Jump to section
Related Articles
Cited By...
- Dendritic cells accelerate CAR T cells in irradiated tumors through chimeric synapses
- Nanoparticles That Reshape the Tumor Milieu Create a Therapeutic Window for Effective T-cell Therapy in Solid Malignancies
- Immuno-PET Imaging of Engineered Human T Cells in Tumors
- Dynamic imaging for CAR-T-cell therapy
- Comparative Analysis of T Cell Imaging with Human Nuclear Reporter Genes
- Molecular Imaging with Bioluminescence and PET Reveals Viral Oncolysis Kinetics and Tumor Viability
- A New Pyrimidine-Specific Reporter Gene: A Mutated Human Deoxycytidine Kinase Suitable for PET During Treatment with Acycloguanosine-Based Cytotoxic Drugs
- Redirecting T-cell specificity by introducing a tumor-specific chimeric antigen receptor
- Nuclear Imaging of Cancer Cell Therapies