


Abstract
This study aimed to assess the ability of global and local systolic parameters measured with gated blood-pool SPECT (GBPS) to diagnose and characterize the severity of diffuse or localized arrhythmogenic right ventricular dysplasia (ARVD). Methods: Fifty-nine subjects with symptomatic ventricular arrhythmias were prospectively included in the study. With the International Society and Federation of Cardiology criteria for ARVD as a gold standard, these subjects were classified as subjects without ARVD (21 control subjects) and patients with localized ARVD (16 patients) or diffuse ARVD (22 patients). Right ventricular volumes, right ventricular ejection fractions (EF), the SD of local EF (σ-EF), and the SD of the local times of end systole (σ-TES) were computed from GBPS data and compared among the groups in the study population. Results: σ-EF did not differ between control subjects and patients with diffuse or localized ARVD. Right ventricular EF and volumes differed between patients with diffuse ARVD and control subjects, with similar areas under the receiver-operating-characteristic curves, but right ventricular EF and volumes failed to differentiate patients with localized ARVD. In contrast, σ-TES differed between patients with diffuse or localized ARVD and control subjects. Regression analysis showed that the systolic parameter most strongly associated with the diagnosis of ARVD was σ-TES. The probabilities of a randomly chosen patient in the diffuse ARVD group and of a randomly chosen patient in the localized ARVD group having σ-TES values greater than that of a randomly chosen control subject were 98.5% and 96.7%, respectively. For the diagnosis of localized ARVD, a threshold of 80 ms for σ-TES corresponded to sensitivity, specificity, and positive and negative predictive values of 100%, 81%, 80%, and 100%, respectively. Conclusion: With GBPS, both diffuse ARVD and localized ARVD can be accurately diagnosed by computing σ-TES for all of the pixels on the surface of the right ventricle.
- arrhythmogenic right ventricular dysplasia
- tomographic gated blood-pool ventriculography
- time of end systole
- phase analysis
- time–activity curve
In the last decade, software packages dedicated to the segmentation of gated blood-pool SPECT (GBPS) acquisitions have been developed and validated, making possible the widespread clinical use of this technique (1–16). However, in routine clinical settings, the time–activity curve that characterizes the wall motion at the scale of a single voxel on the surface of a ventricle involves the variation of limited activity and is thus affected by relatively large error from the random Poisson noise. In a recent study, an optimal 3-dimensional method for the generation of ventricular time–activity curves was described (17). Compared with the usual multiharmonic Fourier fits of the acquired data (18–21), this template-based method facilitates a more robust and refined analysis of ventricular time–activity curves for each voxel or group of voxels on the surface of a segmented ventricle, including the evaluation of local ejection fractions (EF) and local times of end systole (TES) (17).
Recent clinical studies showing that sudden death is often the first manifestation of arrhythmogenic right ventricular dysplasia (ARVD) have highlighted the need for the early diagnosis of this genetically determined heart muscle disease, which leads to ventricular arrhythmias and progressive right ventricular failure (22,23). The gold standard for this diagnosis is based on the presence of mixed criteria established by the International Society and Federation of Cardiology (task force criteria) (24). Most of the functional parameters used to diagnose ARVD can be measured by planar radionuclide angiography (25,26). However, some limitations that are inherent to the overlap of vascular and cardiac structures during planar acquisitions make it difficult to analyze the right ventricle (RV) (25). GBPS can overcome these limitations, but only a few studies have evaluated GBPS in ARVD (27–29), and none of them has taken advantage of recent advances in the processing of such studies.
Therefore, this study aimed to assess the role of GBPS, combined with a model for extracting local time–activity curves from noisy data, in the diagnosis of diffuse or localized ARVD.
MATERIALS AND METHODS
Patients
Fifty-nine patients (13 women and 46 men; age [mean ± SD], 47 ± 14 y; range, 20–78 y) referred to the cardiology department of a university hospital for the initial assessment of symptomatic ventricular arrhythmias were prospectively included in the study. Patients were eligible when they met the following inclusion criteria: documented symptomatic and recurrent paroxysmal ventricular arrhythmias originating from the RV and either sustained or nonsustained ventricular tachycardia of greater than 120 beats per minute lasting more than 30 s or polymorphic or repetitive right ventricular premature contractions associated with syncope or faintness.
Exclusion criteria included left ventricular abnormalities, such as ischemic and valvular disease, and any left ventricular cardiomyopathy. Ethical approval was obtained from the Ethics Committee of Bichat University Hospital. All patients underwent genetic analysis, electrocardiography, echocardiography, planar radionuclide angiography, and cardiac MRI (25). When planar radionuclide angiography or cardiac MRI results were abnormal, patients underwent x-ray angiography. According to the results of these examinations, patients were assigned to 1 of 3 groups with the task force criteria for ARVD (24). The first group was composed of patients who did not meet the task force criteria for ARVD and for whom the diagnosis of benign ventricular arrhythmias was made. Twenty-one patients (5 women and 16 men; mean age, 46 ± 13 y; range, 22–72 y) were assigned to this “control group.” This group represents a population of patients for whom ARVD was suspected in routine clinical settings and finally disproved. The second and third groups were composed of patients fitting the task force criteria for the diagnosis of ARVD (2 major criteria, 1 major and 2 minor criteria, or 4 minor criteria). The patients with ARVD and 1 or 2 limited dyskinetic segments separated by normal segments were assigned to the second group. Sixteen patients (4 women and 12 men; mean age, 53 ± 16 y; range, 24–78 y) were assigned to this “localized ARVD group.” The third group comprised patients with global involvement of the RV (dilation and hypokinesia) associated with typical aspects of localized right ventricular dyskinesia (akinetic or dyskinetic bulges). Twenty-two patients (4 women and 18 men; mean age, 44 ± 13 y; range, 20–69 y) were assigned to this “diffuse ARVD group.” Last, GBPS studies of a group of 20 healthy subjects were also analyzed.
Tomographic Gated Blood-Pool Ventriculography
Patients were injected with 740–925 MBq (20–25 mCi) of in vivo labeled erythrocyte solution. Data were acquired by use of a dual-head γ-camera (Sopha DST; GE Healthcare) in a 90° configuration with low-energy high-resolution parallel-hole collimators. Tomographic gated blood-pool scintigraphy was performed with the following acquisition parameters: 5.6° per step (16 steps over 90° per head) for 180°, 40-s acquisition per step, 10% R-R interval acceptance window, 16 gated intervals, 64 × 64 (pixel size: 6.8 mm). With these acquisition parameters, the examination time was 11 min for patients with regular pacing.
GBPS Processing
The projection data underwent compensation for scatter (30) and were backprojected with a depth-dependent deblurring filter (31). The watershed-based segmentation of the reconstructed slices and the count-based derivation of global right ventricular EF and volumes were performed with in-house software whose description and validation are described elsewhere (2,3). For less than 10% of the segmented slices, oversegmentations were detected by a physician and corrected automatically with the outlines derived from adjacent slices (2).
For each voxel on the surface of the segmented RV, 16 time samples of the corresponding local time–activity curve were computed, the activity of the samples being calculated as the sum of the activity of all of the voxels belonging to a radius traced between the surface voxel and a fixed count-based center of mass of the RV at end diastole, as described by Vilain et al. (32).
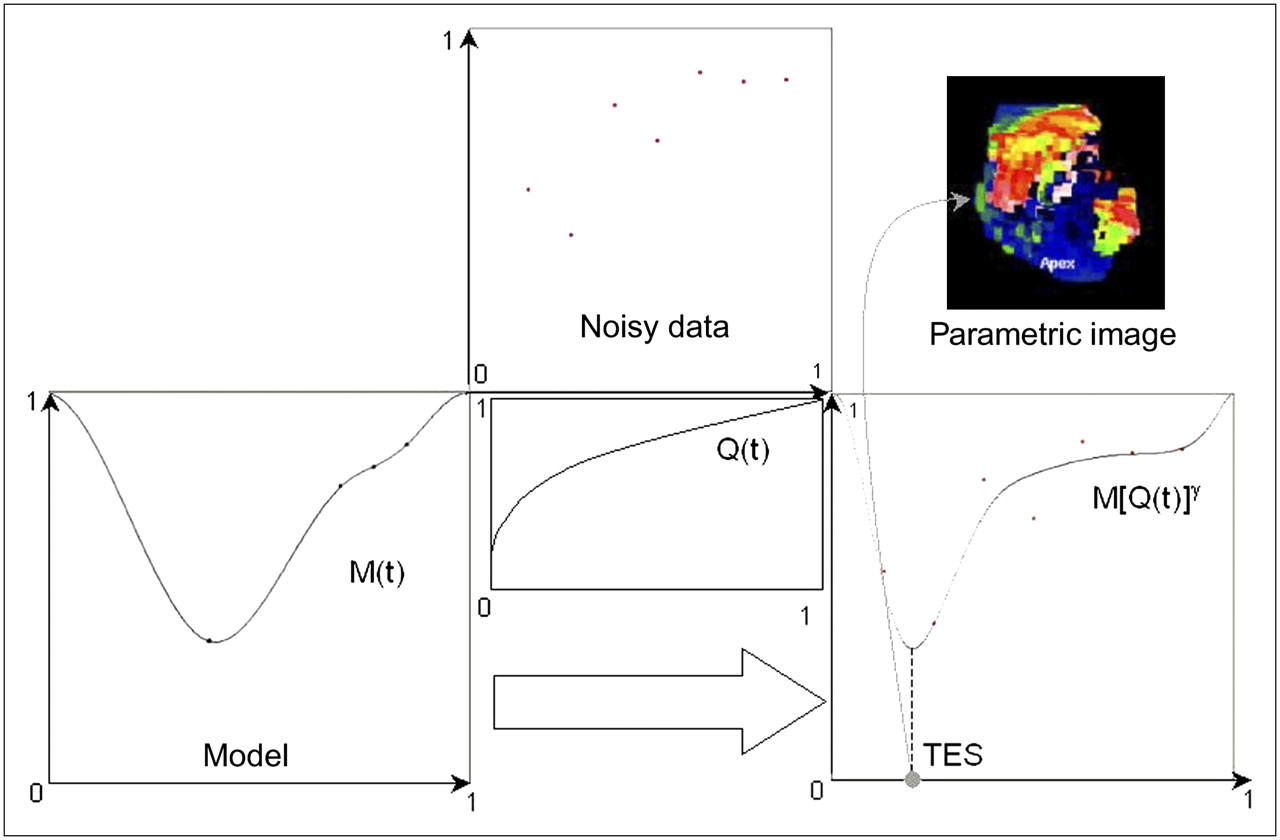
To derive local systolic parameters for each voxel on the RV surface, the noisy time samples of each local time–activity curve were fitted by a smooth deformation D(t) of an ideal analytic model M(t) (17) by computing D(t) = M[Q(t)]γ, where Q(t) is a polynomial function and γ is a real number that depends on the acquired samples only (Fig. 1). The principles of the algorithm are as follows. A first estimate of the parameter γ is assessed with a periodic spline interpolation of the noisy local time–activity curve, A(ti). Next, function Q(t) is computed for the systolic and diastolic phases with a polynomial least-squares approximation of the set of points (ti, t′i), such that M(t′i)γ = A(ti), i = 1,…,16. The polynomial approximation Q(t) is then used to adjust the value of the parameter γ. A more complete description and validation of the algorithm can be found in the article by Caderas de Kerleau et al. (17). Assessments of EF and TES that characterized the wall motion at the scale of a single voxel on the surface of the RV were thus derived from each local noise-free reshaped time–activity curve D(t). Last, the histograms, the SD of local EF (σ-EF), and the SD of local TES (σ-TES) were computed over all of the pixels belonging to the surface of the RV.

Illustration of deformation of the analytic model of time–activity curve M(t) with polynomial function Q(t) to fit acquired noisy data (red dots) and produce 3-dimensional parametric image of local TES.
Statistical Analysis
The mean ± SD characterizes the distributions of the parameters for the 3 different groups. Statistical significance was defined as a P value of less than 0.05. Continuous data were compared with a paired Student t test or a paired Wilcoxon test, as appropriate.
A receiver-operating-characteristic (ROC) curve analysis was performed to quantify the usefulness of right ventricular EF, right ventricular end-diastolic volume (EDV), right ventricular end-systolic volume (ESV), σ-EF, and σ-TES in the diagnosis of diffuse ARVD and localized ARVD versus benign arrhythmias. The accuracy of these systolic parameters for the diagnosis of ARVD was assessed with a nonparametric comparison of the areas under the ROC curves (33–36). The threshold values of the parameters that succeeded in differentiating patients with diffuse or localized ARVD from control subjects were chosen to maximize Youden's index (37), and the sensitivities and specificities of these tests were computed. Last, Spearman correlation coefficients were measured for the parameters that succeeded in classifying ARVD patients and control subjects, and a logistic regression analysis was performed to assess which factors were independently linked to the diagnosis of localized or diffuse ARVD versus benign arrhythmias.
RESULTS
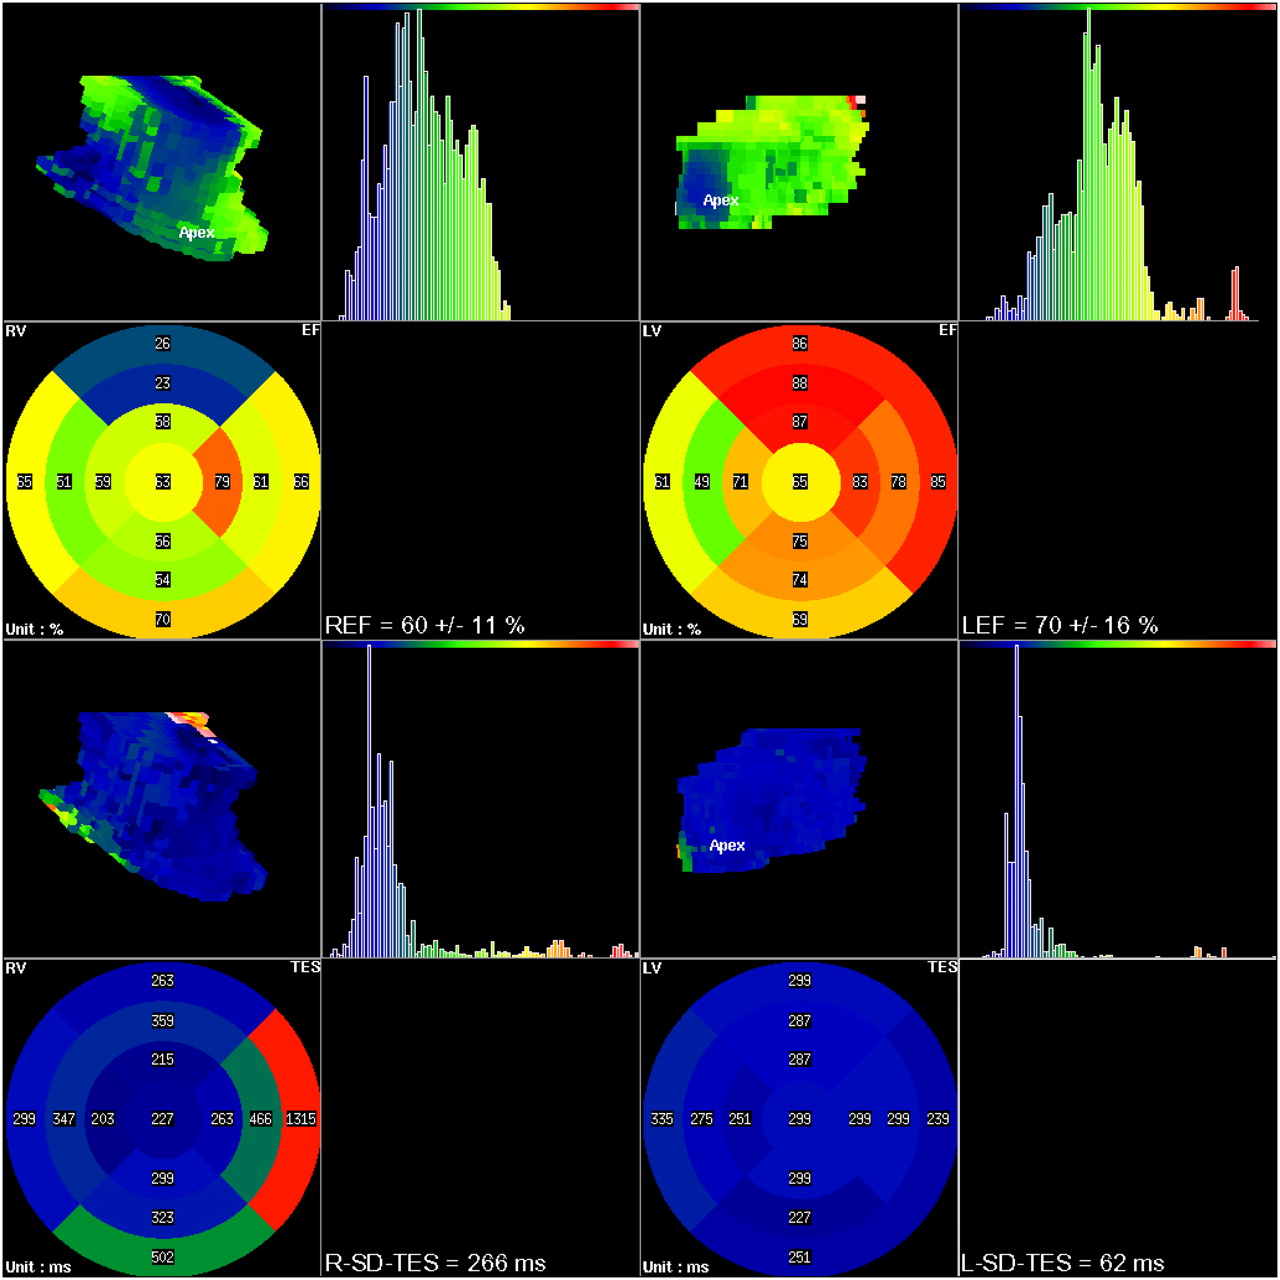
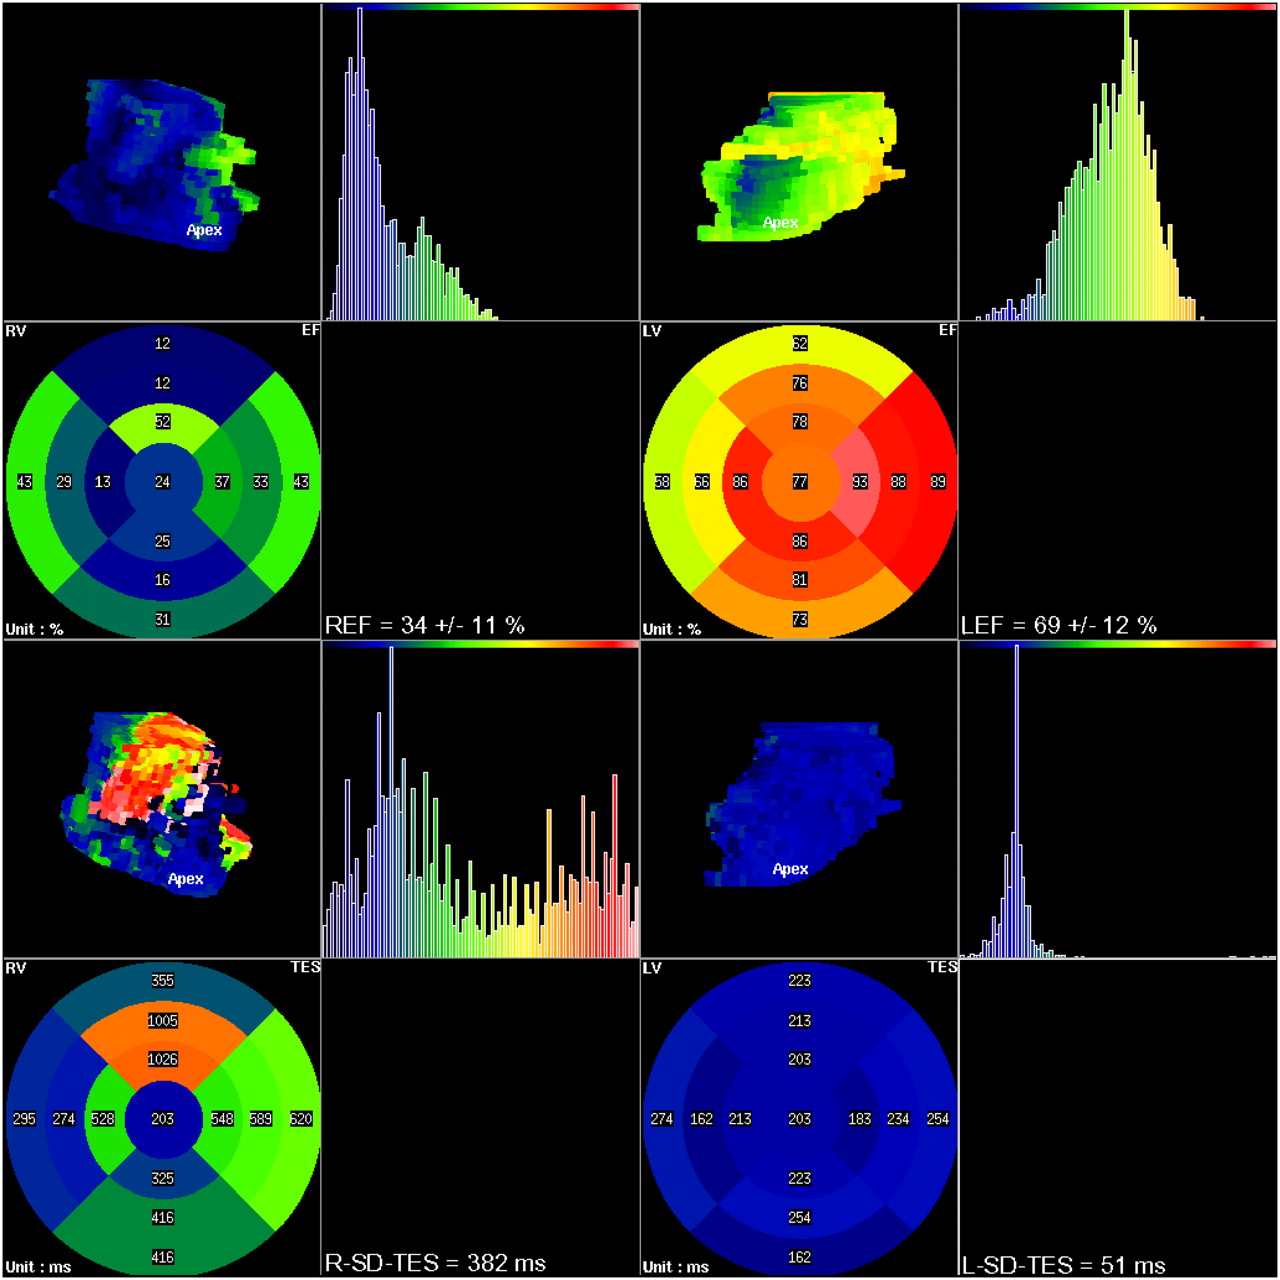
Figures 2, 3, and 4 show examples of images for a control subject, a patient with localized ARVD, and a patient with diffuse ARVD, respectively. The color scale used for the histograms, the bull's-eye polar maps, and the 3-dimensional rendering represent EF or TES. For the control subject, the histograms of TES were well centered on a mean value for both ventricles, and the EF were normal (Fig. 2). For the patient with localized ARVD, global EF were normal, but there was an increase in σ-TES for the RV only (Fig. 3). Last, for the patient with diffuse ARVD, σ-TES and the histograms of TES were obviously altered for the RV, for which the EF were decreased, whereas the functional parameters of the left ventricle remained normal.

Local EF (top 2 rows) and local TES (bottom 2 rows) assessed for control subject. First 2 columns concern RV, and last 2 columns concern left ventricle. LEF and REF = mean ± SD of left and right ventricular EF, respectively; L-SD-TES and R-SD-TES = σ-TES measured for left ventricle and RV, respectively.
Local EF (top 2 rows) and local TES (bottom 2 rows) assessed for patient with localized ARVD. First 2 columns concern RV, and last 2 columns concern left ventricle. LEF and REF = mean ± SD of left and right ventricular EF, respectively; L-SD-TES and R-SD-TES = σ-TES measured for left ventricle and RV, respectively.

Local EF (top 2 rows) and local TES (bottom 2 rows) assessed for patient with diffuse ARVD. First 2 columns concern RV, and last 2 columns concern left ventricle. LEF and REF = mean ± SD of left and right ventricular EF, respectively; L-SD-TES and R-SD-TES = σ-TES measured for left ventricle and RV, respectively.
Right ventricular systolic measurements were not different for patients with benign ventricular arrhythmias (control subjects) and the 20 healthy subjects (P = 0.05 for ESV; P = 0.12 for EDV; P = 0.21 for global EF; P = 0.77 for σ-EF; P = 0.11 for σ-TES).
For the control subjects and the patients with localized or diffuse ARVD, global right ventricular parameters, such as EF or volumes, and local right ventricular parameters, such as σ-EF or σ-TES, are shown in Table 1. When measured for the left ventricle, none of these parameters differed among the 3 groups (P < 0.0001); therefore, left ventricular measurements are shown in Figures 2–4⇑⇑ just for illustration and will not be considered further.
Right Ventricular EF and Volumes, σ-EF, and σ-TES for 3 Groups Studied*
Diagnosis of Diffuse ARVD
Global right ventricular measurements (EF, EDV, and ESV) and σ-TES in patients with diffuse ARVD were different from those in control subjects (P ≤ 0.0001). In contrast, σ-EF was not useful for differentiating control subjects from patients with diffuse ARVD (P = 0.1). For the discrimination of patients with diffuse ARVD from control subjects, there was no difference in the areas under the ROC curves computed for right ventricular EF, EDV, ESV, or σ-TES (P = 0.09). Table 2 shows the thresholds that maximized Youden's index (37) and the corresponding sensitivity, specificity, and positive and negative predictive values for differentiating patients with diffuse ARVD from control subjects in the study population. The regression analysis showed that σ-TES was the parameter most strongly associated with the diagnosis of diffuse ARVD versus benign arrhythmias. Other global systolic parameters were not considered by the regression analysis because they provided highly correlated additive information, with Spearman correlation coefficients ranging from 0.59 to 0.89 for 2 of the 4 systolic parameters of interest (EF, EDV, ESV, and σ-TES; P < 0.0001). The regression analysis showed that the probability of a randomly chosen patient in the diffuse ARVD group having a σ-TES value greater than that of a randomly chosen control subject was 98.5%.
Sensitivity, Specificity, Positive Predictive Value (PPV), and Negative Predictive Value (NPV) of Right Ventricular EF, Volumes, and σ-TES for Diagnosis of Diffuse ARVD in Patients with Symptomatic Ventricular Arrhythmias
Diagnosis of Localized ARVD
Global systolic parameters (EF, EDV, and ESV) and σ-EF in patients with localized ARVD were not different from those in control subjects (P = 0.08–0.31 for global systolic parameters and P = 0.1 for σ-EF). In contrast, σ-TES was the only measurement that differed in patients with localized ARVD and control subjects (P < 0.0001). The regression analysis confirmed this finding, indicating that the probability of a randomly chosen patient in the localized ARVD group having a σ-TES value greater than that of a randomly chosen control subject was 96.7%.
For the diagnosis of localized ARVD, the threshold for σ-TES that maximized Youden's index (37) was 80 ms. This threshold corresponded to a sensitivity and a specificity of 100% (95% confidence interval: 79%–100%) and 81% (95% confidence interval: 58%–95%), respectively. The corresponding positive and negative predictive values for our population of patients with symptomatic ventricular arrhythmias were 80% (95% confidence interval: 56%–94%) and 100% (95% confidence interval: 80%–100%), respectively.
DISCUSSION
Sudden death is often the first manifestation of ARVD, highlighting the need to improve the rate of early diagnosis. However, the development in physicians of a greater awareness of ARVD may be impeded by the relative rarity of a disease that manifests with a broad spectrum of clinical presentations (38). As a consequence, there is a need to develop standardized sensitive criteria that do not require highly specialized physicians and that may be used both for the diagnosis of ARVD in its early stages (39) and for risk stratification for cardiovascular death, which is known to be associated with right ventricular failure (40).
With σ-TES in the RV computed from the first 3 harmonics of the time–activity curves, it was demonstrated that planar rest radionuclide ventriculography provides information similar to that of x-ray angiography for the diagnosis of ARVD (25). In that study, the authors emphasized the limitations of this technique, including the difficulties of exploring the inferoapical wall, a long acquisition time, and the need for a trained nuclear medicine physician to process and perform a visual analysis of the data, with no quantitative analysis of the surface of the RV that is involved in the disease. Last, this reference study compared planar radionuclide ventriculography and right ventricular x-ray angiography, a major technique used in the diagnosis of ARVD but one that cannot be regarded as a gold standard for this diagnosis.
Through analysis of GBPS right ventricular slices as planar acquisitions, it has been demonstrated that the SD of the first harmonic-phase histogram may be used for screening patients with right ventricular arrhythmias (27–29), but the localized or diffuse character of the ARVD in the patients studied in these investigations was not considered.
In the last decade, segmentation software packages have been validated (1–16), and optimized methods for the extraction of local time–activity curves from GBPS segmented studies have been described (32). An algorithm for extracting local systolic parameters more accurately than with the usual multiharmonic fits has also been proposed (17). The present article is the first clinical validation study that incorporates these 3 methodologic improvements and then evaluates the resulting methodology by comparison with task force criteria for the diagnosis of ARVD (24).
Right ventricular EF and volumes assessed from GBPS data succeeded in differentiating patients with diffuse ARVD from control subjects with high sensitivity and specificity. However, because the diagnosis of diffuse ARVD may be relatively easy, the interest of GBPS may be more in the assessment of prognosis (40). In contrast, localized ARVD could not be identified with right ventricular EF or volumes. This result is consistent with the lack of sensitivity of each of these criteria, whatever the imaging modality used (39). σ-EF on the surface of the RV was not useful in diagnosing localized or diffuse ARVD. This negative result may be attributable to the fact that the decrease in global right ventricular EF in ARVD is mainly attributable to the lack of synchronization in right ventricular wall motion rather than to the heterogeneity of the local EF measured for all of the voxels on the surface of the RV.
The present study demonstrated that, of all of the systolic parameters tested, σ-TES for all of the pixels on the surface of the RV was the only systolic measurement that differentiated control subjects from patients with localized ARVD. This result is consistent with previous findings (25). Moreover, the automatic assessment of local TES provided by the software used in the present study allows direct quantification of the surface of the RV that is involved in the arrhythmia without requiring any specific skill on the part of the nuclear medicine physician who analyzes the data.
Further clinical studies are now needed to evaluate the exact interest of GBPS global and local systolic measurements in the long-term follow-up of patients with symptomatic ventricular arrhythmias and no left ventricular disease.
CONCLUSION
The main result of the present study was that, for a population of patients with symptomatic ventricular arrhythmias, σ-TES for all of the pixels on the surface of the RV was the only systolic measurement derived from GBPS that differentiated control subjects from patients with diffuse ARVD and from patients with localized ARVD in the same way as the task force mixed noninvasive criteria.
Footnotes
-
COPYRIGHT © 2007 by the Society of Nuclear Medicine, Inc.
References
- Received for publication February 22, 2007.
- Accepted for publication May 16, 2007.


