


Abstract
Blood-pool (BP)–gated SPECT should be able to detect regional left ventricular (LV) dysfunction, as the modality is fully 3-dimensional and capable of resolving all cardiac chambers. This study investigates the hypothesis that LV segments that have abnormal regional wall motion (WM) on a cardiac MRI scan also have abnormal BP regional ejection fraction (EF) as computed by fully automated quantitation (AQ) of BP data. Methods: A total of 34 patients evaluated for coronary artery disease who underwent visual assessment of WM by review of BP cines and cardiac MRI evaluations were included in this retrospective investigation. Cardiac MRI values for these patients were compared with an institutional database of cardiac MRI values for an age-matched cohort of 10 healthy volunteers. An AQ algorithm segmented the LV BPs on the BP tomograms and subdivided volumes into 17 subregions. Count-versus-time curves were fit to third-order Fourier series for each LV subvolume to compute regional EFs. For cardiac MRI data, endocardial and epicardial drawings were performed manually for 60° samples of 11–13 short-axis tomograms spanning the entire heart, from which regional WM values were computed and rebinned into 17 conventional LV segments. Results: Global EF ranged from 12% to 75% on AQ and from 14% to 75% on cardiac MRI (Pearson correlation coefficient = 0.95, P < 0.0001). Differences were not significant between BP AQ and cardiac MRI in identifying the 12 patients with a global EF less than 35% (McNemar difference, 3%; P = 1.0) and the 19 patients with an EF less than 50% (difference, 3%; P = 1.0). BP AQ was more accurate than was visual assessment for identifying LV segments with abnormal cardiac MRI WM (receiver-operating-characteristic areas, 88% vs. 80%, P < 0.0001) and was more accurate for the left circumflex than for the left anterior descending coronary artery territories (95% vs. 86%, P = 0.01). Differences were not significant between BP AQ and cardiac MRI WM for discriminating normal from abnormal LV segments (McNemar difference, 3.2%; P = 0.14). Conclusion: AQ BP-gated SPECT assessment of regional and global LV WM agrees with independent cardiac MRI calculations and is superior to visual analysis for detecting regional WM abnormalities.
Left ventricular (LV) global function and ejection fraction (EF) have long been recognized as the parameters most closely related to cardiac prognosis (1). Assessment of regional wall motion (WM) is also important in diagnosing ischemic heart disease and localizing the site and extent of myocardial damage (2). Clinically, LV regional function is most frequently assessed by visual analysis of echocardiographic or radionuclide WM studies (3). However, these techniques may have some constraints in accuracy due to inherent technical issues. Echocardiographic studies may be limited by the inability to define endocardium and adequately visualize the apex (4). Gated SPECT perfusion imaging studies may be difficult to interpret because of areas of marked hypoperfusion (5). Planar gated blood-pool (BP) studies present challenges because of overlapping structures and limitations in visualizing the true inferior and posterior wall segments (6). Consequently, a routinely available modality that permits automated, accurate, and reproducible measurements of ventricular global and regional function would be a useful diagnostic tool.
Gated BP imaging has been performed with tomographic techniques, and software is now available that permits quantitation of global and regional ventricular function from BP-gated tomograms (7). We have previously demonstrated a close correlation between left and right global ventricular function determined by cardiac MRI and an operator-assisted, semiautomated algorithm for BP calculations (8,9). Recently, an operator-independent, fully automated quantitation (AQ) algorithm for evaluating BP regional ventricular function has become available. In this study, we investigated the correlation between global and regional LV function measurements by gated BP SPECT imaging analyzed by fully AQ algorithms and global and regional function indices derived from gated cardiac MRI data. We also sought to determine the extent to which regional WM abnormalities detected by BP AQ agreed with expert visual WM assessment and how both of these compared with regional WM abnormalities determined by cardiac MRI.
MATERIALS AND METHODS
Patients
The study population consisted of 34 individuals (25 men and 9 women; mean age, 55 ± 13 y). All subjects were recruited from the inpatient and outpatient population at St. Francis Hospital and were in sinus rhythm at the time of both BP and cardiac MRI studies.
All of the subjects were being evaluated for various cardiac symptoms, including dyspnea on exertion and chest pain, and underwent gated SPECT BP studies and cardiac MRI. Twenty-four patients had a history of congestive heart failure, 17 had prior myocardial infarction, 29 had hypertension, and 8 had diabetes. Resting heart rates were 61 ± 13 beats per minute.
Normal limits for LV global and regional EF by BP AQ have been previously established (40 subjects, 20 men; age, 50 ± 16 y for all subjects) (7). For the cardiac MRI normal limits, 10 age- and sex-matched controls (5 men; age, 57 ± 8 y for all subjects) were selected from an established institutional database of normal global and regional cardiac MRI values. These values were based on cardiac MRI results obtained in healthy volunteers who had no history or evidence of cardiac disease on physical examination or electrocardiography (ECG) and who had normal results on rest and stress gated cardiac MRI myocardial perfusion studies.
This retrospective investigation was approved by the Institutional Review Board. All data were handled in compliance with the Health Insurance Portability and Accountability Act of 1996.
Cardiac MRI Data Acquisition
Cardiac MRI data were collected on a 1.5-T scanner (Sonata; Siemens Medical Solutions, Inc.). Breath-hold TrueFISP cine cardiac MRI was used (10), because this method produces images with a superior signal-to-noise ratio.
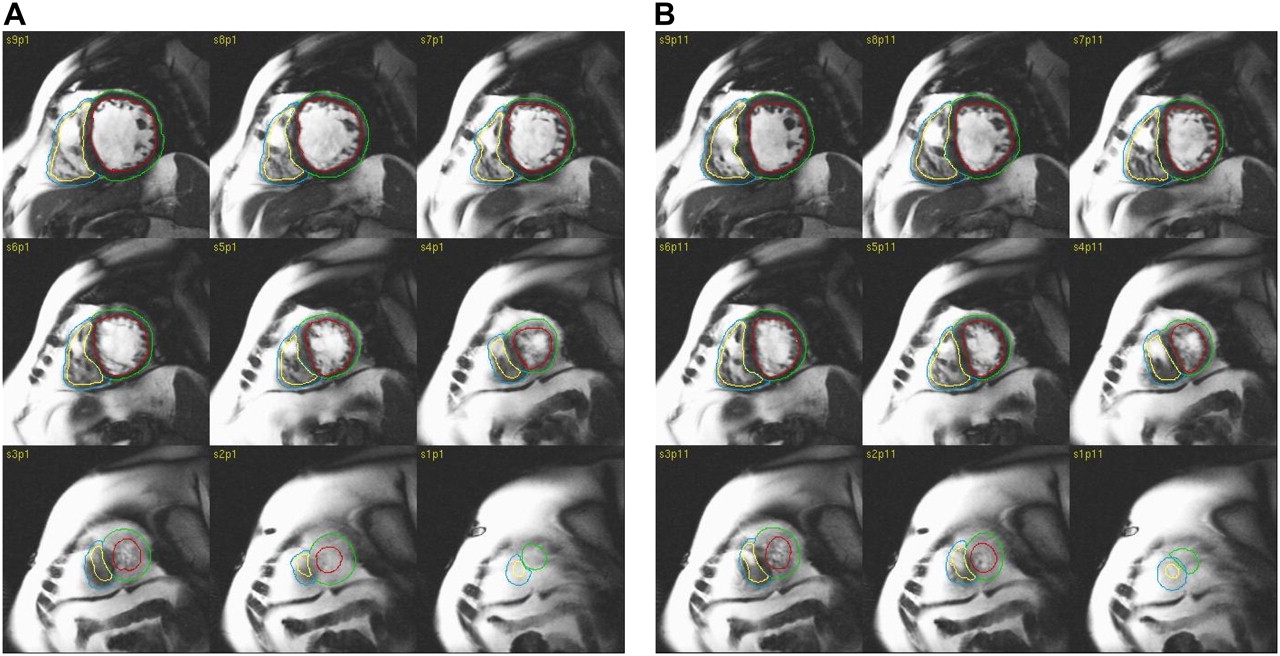
Multiplane localizers identified cardiac position and intrinsic LV long and short axes using standard iterative scouting techniques. Contiguous ECG-gated, breath-hold, segmented k-space TrueFISP images were obtained in the LV short-axis plane over the cardiac cycle with 128 × 256 matrices, using a field of view of 30–40 cm2, depending on the patient's chest size. ECG gating was prospective. For the segmented technique, partial k-space data were acquired for each of the frames per heartbeat and then combined into a whole-frame image over several heartbeats. Image slice thickness was 8 mm, and temporal resolution was 40 ms or less, depending on the heart rate. Breath-hold duration was 10–16 s per image sequence. During 1 breath-hold, 2 contiguous planes were acquired. To minimize slice-position variations, data were always acquired during the patient's end expiration. Imaging extended from above the bifurcation of the main pulmonary artery to the apex of the heart over 11–13 tomographic sections (Fig. 1). Total data acquisition time was less than 30 min.

MR images of 75-y-old male patient with history of congestive heart failure and hypertension with severe LV and RV dysfunction and abnormal LV EF (23%) at ED (A) and ES (B). Manually drawn epicardial and endocardial outlines are superimposed on images.
Cardiac MRI Calculations
Images were examined manually by 1 trained MRI analyst using commercially available software (MASS; Medis, Inc.). Each set of drawings was reviewed by 1 separate MRI expert. Slice cavity volume was determined as the product of slice thickness and cavity area, and ventricular volume was determined as the sum of slice cavity volumes. Cardiac MRI EF was computed from end-diastolic and end-systolic volumes. Using endocardial and epicardial manual drawings performed for 60° samples of short-axis cines over 11–13 tomographic slices, we computed regional cardiac MRI radial WM by MASS algorithms as the difference between end-diastolic and end-systolic endocardial radii, in millimeters. Cardiac MRI percentage wall thickening (WT) was computed as the percentage change in radial wall thickness from end-diastole (ED) to end-systole (ES). Cardiac MRI radial wall velocity (WV) was estimated as π*MW/(TED–ES), in units of centimeters per second, where TED–ES = time from ED to ES in units of seconds. This formula was derived by assuming that wall location at ED is the maximum of a cosine function for which wall location at ES is a minimum and taking the derivative of the cosine to obtain WV. All 66–78 cardiac MRI regional values then were resampled into segments corresponding to the conventional LV 17-segment model by weighted averaging, with weights determined by the percentage overlap of surface areas of the 17 segments as projected onto surface areas of the original 66–78 locations.
BP Image Acquisition
99mTc-pertechnetate (925 MBq [25 mCi]) was injected 30 min after an injection of 5 mg of stannous pyrophosphate. Data were acquired using dual-detector γ-cameras (Forte or Vertex; ADAC Inc.) equipped with low-energy, high-resolution collimators. Data were collected at 64 projections over a 180° circular arc and 64 × 64 tomograms (pixel size, 4.6 mm), acquired for 20 s/projection for 15–16 min. Tomograms were acquired at 16 frames per R-R interval, using an R-wave window of ±20% of mean preacquisition heart rate (11).
Spatial smoothing before reconstruction was performed using Butterworth filtering (cutoff, 0.35 cycles/cm; power, 5.0) for gated tomograms, followed by ramp filtering in the transaxial plane. Filtered images were backprojected to form transaxial slices, which were reoriented into short-axis sections by manually choosing approximate LV symmetry axes, using standard software. Reconstruction limiting regions and angles were chosen to ensure that the entirety of both ventricles, as well as the atria and the main pulmonary artery, were included in the field of view of reoriented images. Input tomograms to BP software were reoriented manually to achieve optimal separation of right ventricular (RV) and LV activity seen in tomographic short-axis views.
BP Visual Assessment
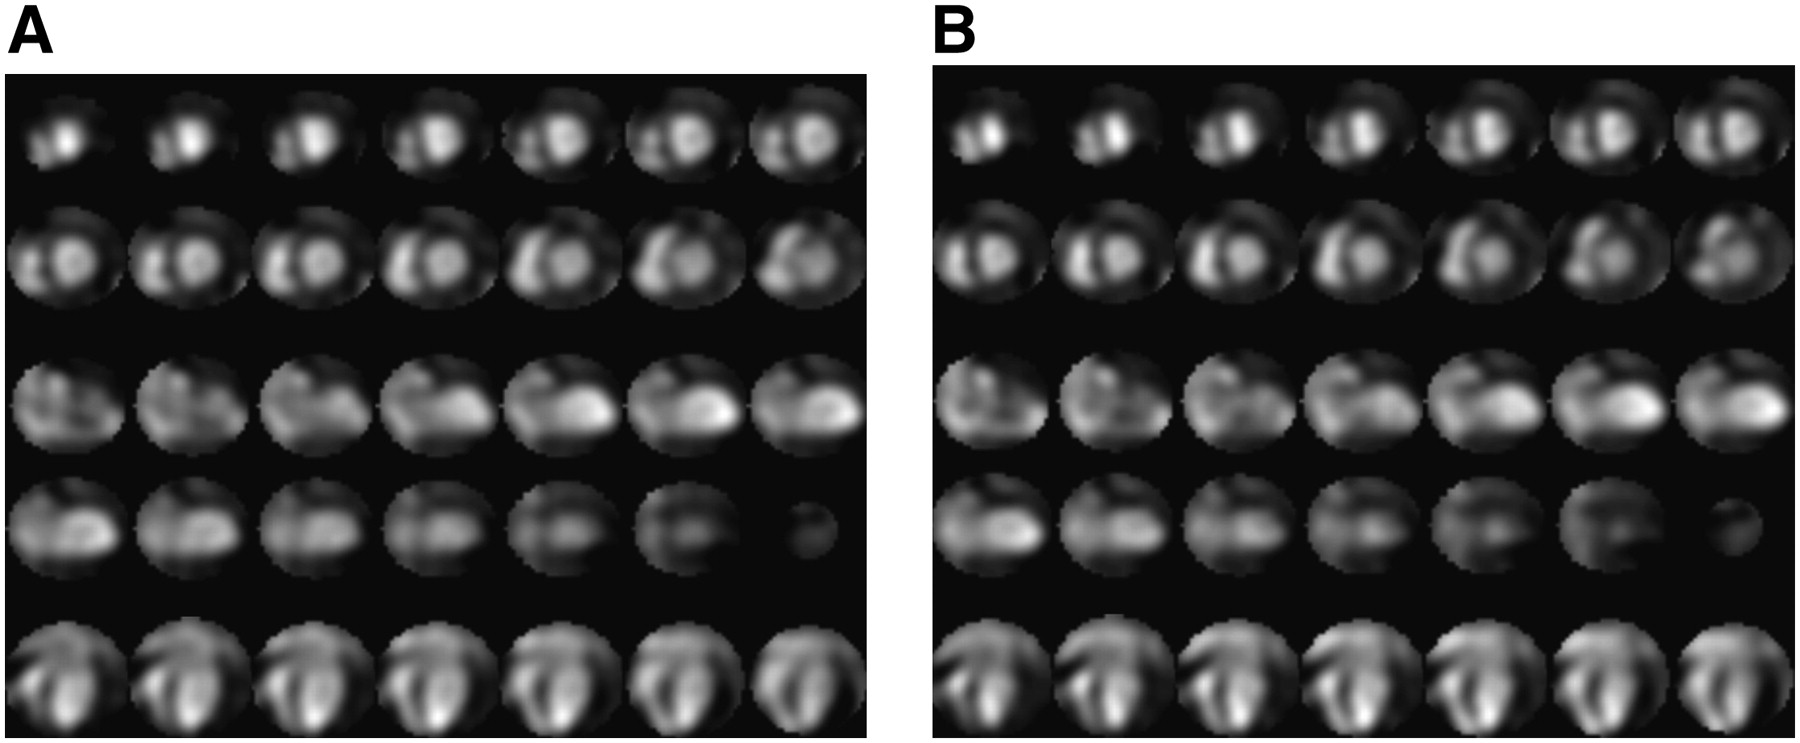
Independent visual assessment of LV global and regional WM was performed by 1 experienced nuclear cardiologist, without knowledge of BP AQ or cardiac MRI calculations or any other clinical test results. BP visual assessment was performed with cines displayed simultaneously in orthogonal views without superimposed computed outlines (Fig. 2). LV WM for each of the 17 segments was graded on a 5-point scale (0, normal; 1, mildly hypokinetic; 2, moderately hypokinetic; 3, akinetic; and 4, dyskinetic). On the basis of a segment judged to be at least moderately hypokinetic, BP regional visual assessment readings also were dichotomized.

Screens of cines used to visually analyze BP-gated SPECT regional WM abnormalities for same patient in Figure 1 at ED (A) and ES (B).
On a separate occasion, the same observer, unaware of previous assessments and all other measurements, repeated visual assessments so that there were 2 sets of visual readings (initial visual assessment of BP-gated SPECT WM and second independent visual assessment of BP-gated SPECT WM). Reading sessions were separated by more than 1 mo to avoid recall bias.
BP Image Processing
Previously described BP algorithms (8) were modified to include new regional function subroutines written in interactive data language (RSI, Inc.) and executed on standard desktop personal computers running Windows operating systems (Microsoft Corp.) (7). Maximum-count sites in likely ventricular volumes identified LV mid-chamber locations. Valve planes were generated by a combination of shape information incorporated with phase information. Volumes were computed from the number of voxels greater than 50% of maximum LV volumetric counts, and EF was computed from count changes in areas with counts greater than 35% of maximum LV volumetric counts.
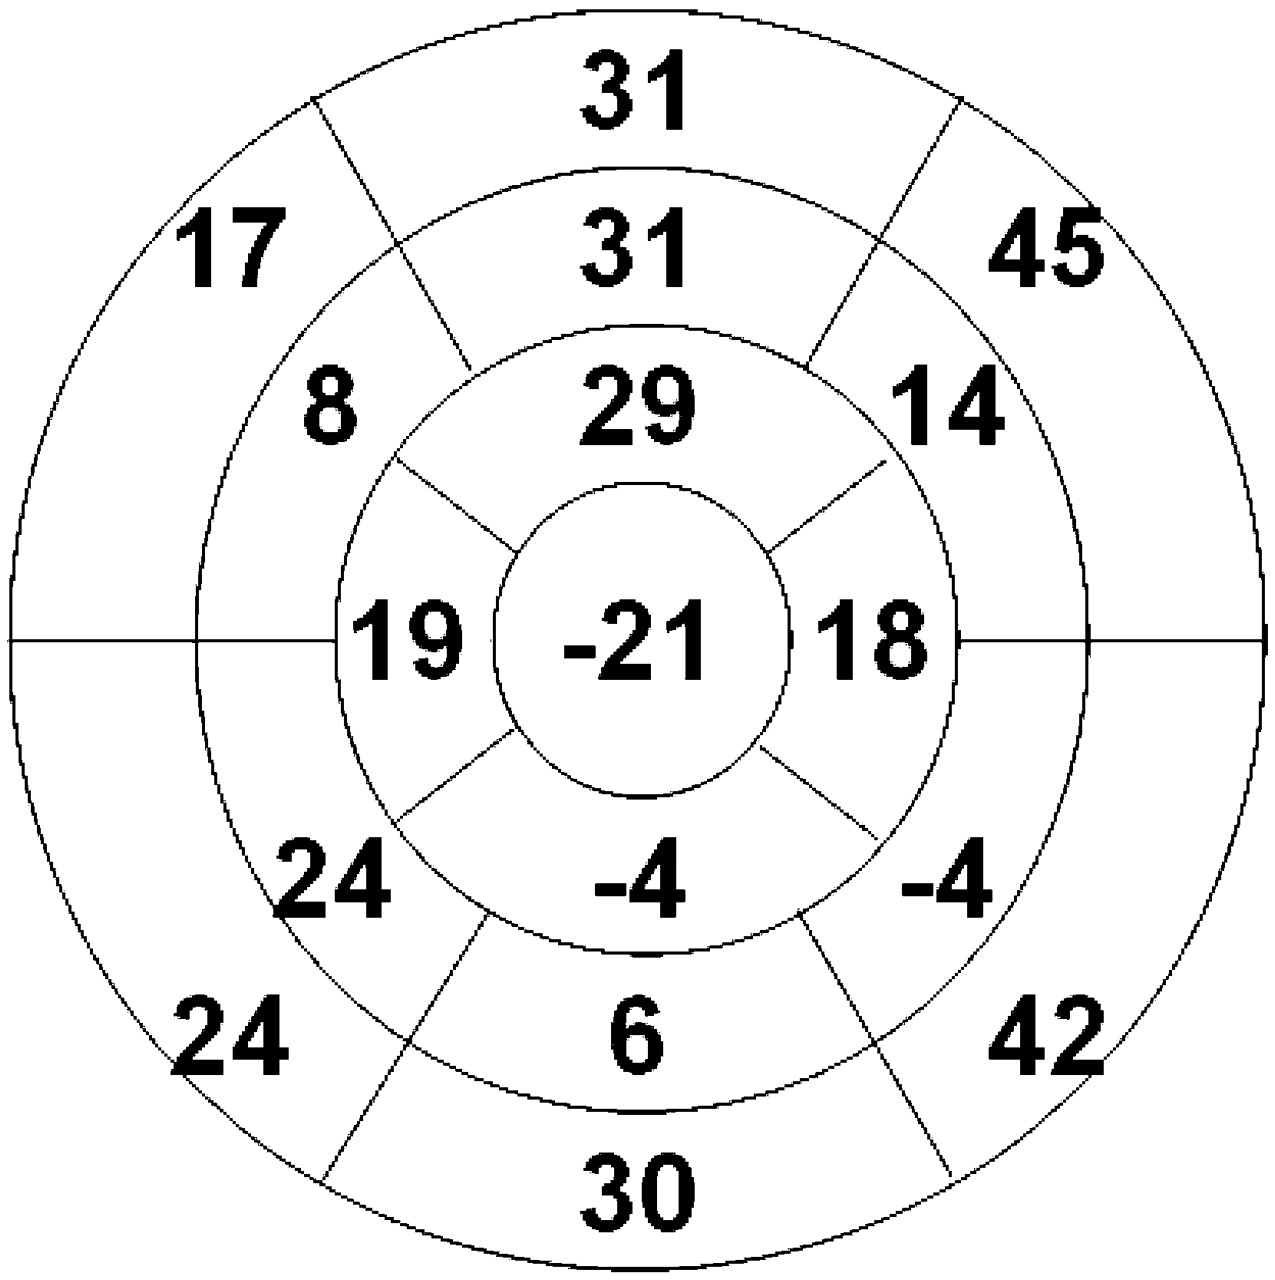
For each segment of the R-R interval, RV and LV volumes were divided into 17 subvolumes. The counts of each subvolume were fit to third-order Fourier harmonics, using a moving frame of reference (12). Each of the 17 LV segments corresponded to the conventional LV mapping (Fig. 3) (13). Regional EFs were calculated from the count changes from ED to ES for each of the 17 subvolumes.

Polar map of BP-gated SPECT LV regional EF (percentage) for patient in Figure 1.
All BP data were processed by AQ, with no operator interventions. Results of all numeric calculations were exported by the algorithms automatically to Excel (Microsoft) spreadsheets for subsequent statistical analysis.
Statistics
Statistical analyses were performed using commercially available software (Medcalc, version 7.5.0.0.; Medcalc Software, Inc.). Values are reported as mean ± SD. Frequencies and percentages were used to characterize categoric variables. One-way ANOVA was used to determine whether variations were significant among the 17 LV territories for WM, WT, or WV values for controls. Paired t tests were used to test the hypothesis that mean values were not different between BP AQ and cardiac MRI computations. Correlation between continuous variables was determined using linear regression, which generated Pearson correlation coefficients (r). Bland–Altman analyses of measurement differences plotted versus mean values were used to assess biases, trends, and limits of agreement. Using dichotomous cardiac MRI WM, WT, and WV abnormality scores as the reference standards, we performed receiver-operating-characteristic analyses of BP AQ and BP visual assessment to correctly identify which LV segments were abnormal for all LV segments and for segments in the left circumflex (LCX), left anterior descending (LAD), and right coronary artery (RCA) territories. Agreement between methods for identifying which LV segments were abnormal was determined using the κ-statistic (14). The McNemar test was used to determine whether differences were significant for paired proportions of normal versus abnormal findings for BP AQ versus cardiac MRI in identifying patients with global EF less than 35% (15) and patients with EF less than 50%. The McNemar test also was used to determine whether differences were significant for categorizing LV segments as abnormal by BP AQ and BP visual assessment versus cardiac MRI, for all segments and for segments subgrouped by coronary territory. A P value of less than 0.05 was considered to be statistically significant. All statistical tests were 2-tailed.
RESULTS
Global Parameters
Algorithms were run for BP data for all 34 subjects. BP global and regional calculations took less than 1 min per patient. Manual endocardial and epicardial drawings for cardiac MRI global and regional calculations required about 1 h per patient.
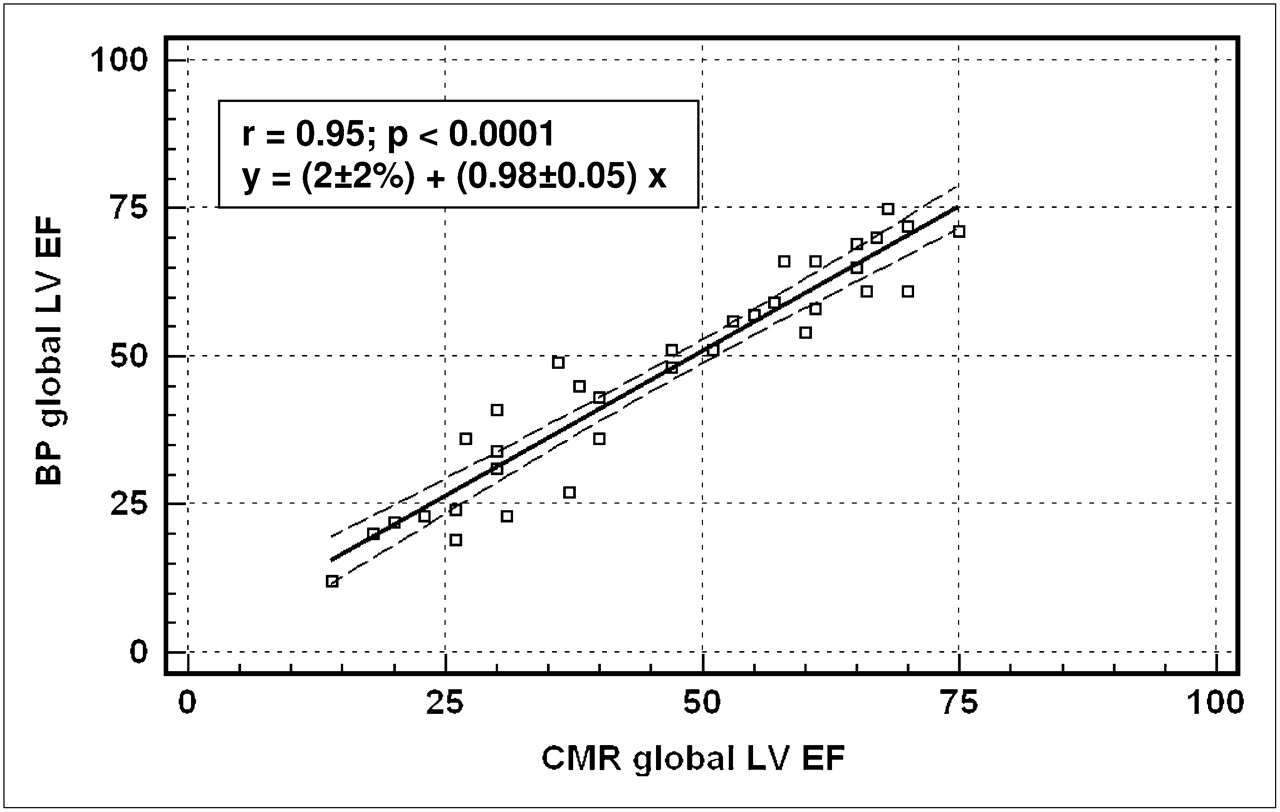
Cardiac MRI global EF was significantly different between controls and study subjects (58% ± 7% vs. 46% ± 18%, P = 0.04), as was end-systolic volume (59 ± 22 mL vs. 121 ± 81 mL, P = 0.02). LV global EF ranged from 12% to 75% for AQ and from 14% to 75% for cardiac MRI. AQ EF was similar to cardiac MRI EF (47% ± 18% vs. 46% ± 18%, P = 0.30). Correlation was significant for AQ versus cardiac MRI EF (P < 0.0001) (Fig. 4). Bland–Altman analysis showed that EF differences did not correlate with EF means (P = 0.64), with no bias (P = 0.95) or trend (P = 0.64), and with limits of agreement of −9.8% to 11.7%. End-diastolic and end-systolic volumes ranged from 28 to 499 mL for AQ and from 35 to 525 mL for cardiac MRI. Volumes were similar for BP and cardiac MRI (152 ± 86 mL vs. 160 ± 90 mL, P = 0.11) and correlated as r = 0.87 (P < 0.0001). Bland–Altman volume differences were uncorrelated versus mean values (P = 0.45), with no bias (P = 0.93) or trend (P = 0.45) and limits of agreement of −97 to 80 mL. Agreement between BP AQ and cardiac MRI was “very good” (14), with no significant disagreements for identifying the patients with EF less than 50% and less than 35% (Table 1) (15).

BP measurement of global LV EF vs. cardiac MRI–quantified global LV EF. CMR = cardiac MRI.
Strength of Agreement and Significance of Differences of BP AQ with Cardiac MRI in Identifying Patients with Abnormally Low Global EF
Regional LV Parameters
Cardiac MRI regional values were different between controls and patients for WM (6.5 ± 1.7 mm vs. 5.0 ± 2.8 mm, P < 0.0001), WT (53% ± 26% vs. 33% ± 30%, P < 0.0001), and WV (3.4 ± 1.3 cm/s vs. 2.6 ± 2.8 cm/s, P < 0.0001). Variations among cardiac MRI values were significant (ANOVA, P < 0.05) for WM, WT, and WV when all 17 segments were included and when only the 3 septalmost territories were examined, but variations were not significant when the 3 septalmost territories were excluded. These variations reflect the methodologic difficulties involved in drawing cardiac MRI LV contours in the vicinity of the LV outflow tract. Therefore, the 3 septalmost segments were excluded from all subsequent analyses comparing cardiac MRI, BP AQ, and visual assessment BP measurements. Cardiac MRI lower limits of normal were 3.2 mm for WM; on that basis, there were 141 segments with abnormal WM and 335 segments with normal WM.
Receiver-operating-characteristic analysis showed that accuracy of BP AQ for predicting abnormal WM was greater than the accuracy of BP visual readings (P = 0.0001) (Table 2; Fig. 5A). AQ was significantly more accurate for LCX than for LAD or RCA territories (P = 0.0002) and significantly more accurate than visual readings for LCX and RCA territories (P = 0.01–0.002) (Table 2; Fig. 5). Accuracy of AQ to predict abnormal WM was not influenced by the severity of LV dysfunction. The accuracy for all territories for all subjects (88% ± 2%) was similar to the accuracy for the subgroup with global EF less than 50% (89% ± 2%, P = 0.78) and similar to the accuracy for the subgroup with global EF less than 35% (87% ± 2%, P = 0.78). AQ was more accurate for predicting abnormal WM than for predicting abnormal WT (P = 0.002) and was more accurate than visual assessment for predicting abnormal WT for the LCX territory (Table 2). AQ for predicting abnormal WV was higher than the accuracy of visual readings, with highest accuracy versus WV for LCX territories (Table 2).
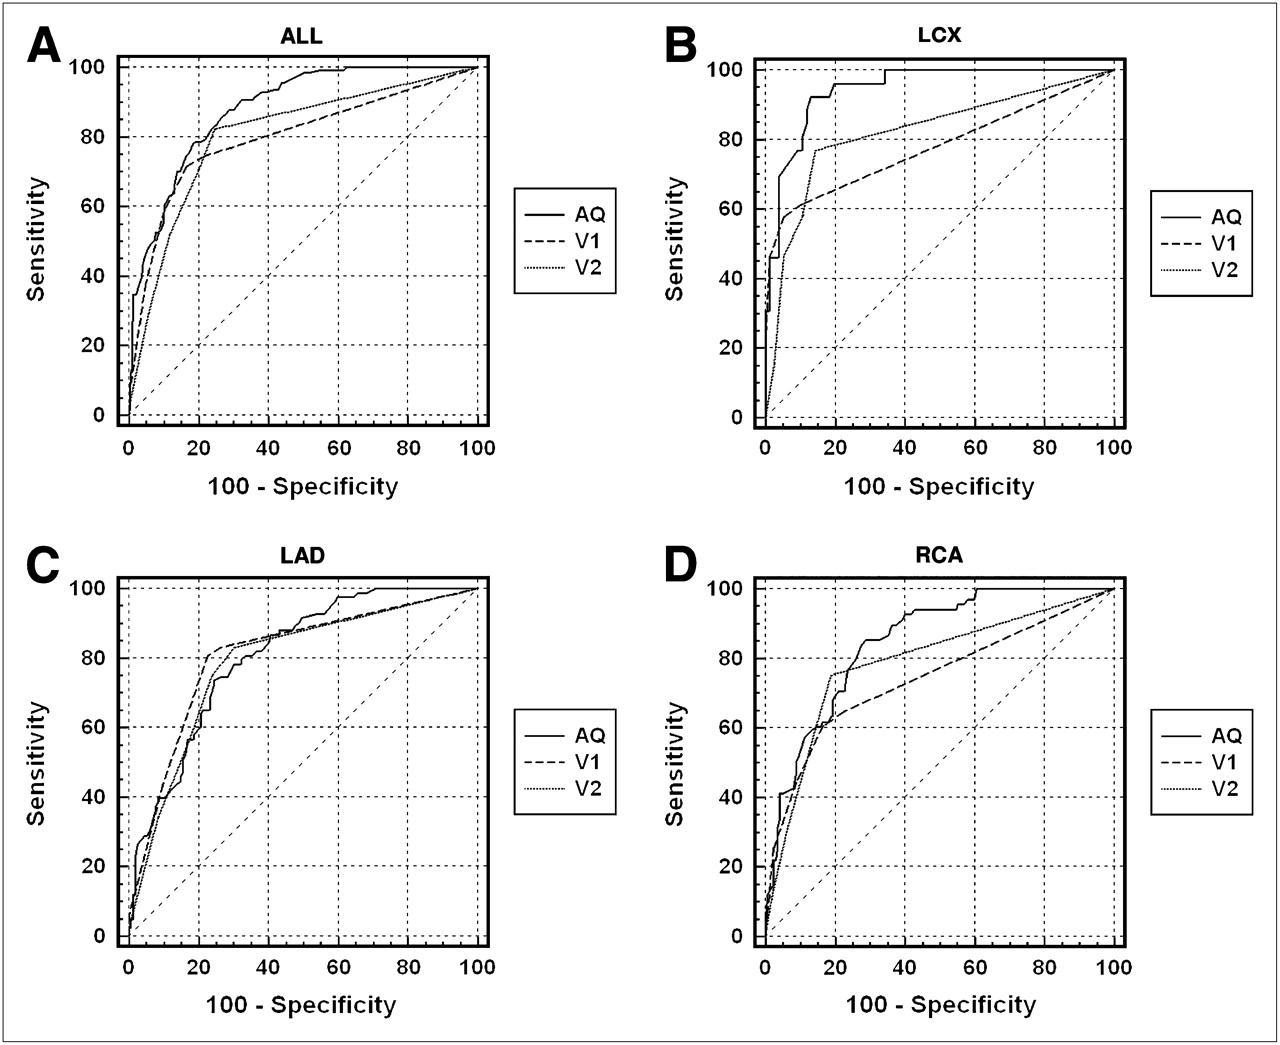
Receiver-operating-characteristic curves to predict LV segments with abnormal WM as seen on cardiac MRI, for AQ BP-gated SPECT EF, initial visual assessment (V1), and second visual assessment (V2) for all territories (A) and for LCX (B), LAD (C), and RCA (D) territories only.
Accuracy (Receiver-Operating-Characteristic Curve Area) of Segment-by-Segment Identification, Grouped by Coronary Territory
Agreement with cardiac MRI was “moderate to good” for BP AQ for identifying segments with abnormal WM, with no significant disagreements. Agreement was only “moderate” for visual assessment, with significant RCA disagreements (Table 3) (14).
Strength of Agreement and Significance of Differences Between BP AQ and BP Visual Assessment with Cardiac MRI in Identifying Territories with Abnormal WM
McNemar differences for identifying abnormal segments were not significant for AQ versus WM (P = 0.14) or AQ versus WV (P = 0.30) but were significant for WT versus WM (P < 0.0001), AQ versus WT (P < 0.0001), AQ versus visual assessment (P = 0.001), initial visual assessment versus second visual assessment (P = 0.003), visual assessment versus WM (P < 0.0001), and visual assessment versus WV (P = 0.0001). For detecting paradoxical apical WM, explicitly, AQ disagreements from WM were not significant (McNemar difference, 3%, P = 1.0).
Measurement Reproducibility
The BP global and regional calculations of this investigation were totally automated; consequently, these calculations were perfectly reproducible. Interobserver agreement of repeated BP visual assessment readings for all territories was “moderate to good,” with no significant differences (Table 4) (14).
Strength of Agreement and Significance of Differences Between BP Initial Visual Assessment and BP Second Visual Assessment in Identifying Territories with Abnormal WM
DISCUSSION
Our investigation demonstrates that a fully AQ method of computing global and regional LV function from SPECT-gated BP studies yields results that are in close agreement with those provided by cardiac MRI. Because cardiac MRI is considered the most reliable standard for assessment of LV function—because of its superior 3-dimensional spatial resolution, tissue contrast, and time resolution (16)—our study serves to validate BP AQ methodology for analysis of LV function.
SPECT-gated BP imaging has significant advantages over other techniques for determining LV function. Like cardiac MRI, BP SPECT is fully 3-dimensional and thus displays all LV segments, providing unambiguous separation of cardiac chambers (6,17,18). Noncardiac structures such as the aorta do not overlap or contribute to time-varying counts in BP tomograms. The calculation of EF is fully count-based and—unlike echocardiography, ventriculography, and perfusion imaging—does not depend on geometric assumptions of ventricular shape (8). Because counts are attenuated equally in diastole and systole, attenuation has a negligible effect on EFs in planar multigated radionuclide angiography (MUGA) data (19). This negligible effect should apply equally to global and regional EFs determined from tomographic MUGA studies. BP SPECT counts are greater than those obtained in gated myocardial perfusion studies, so that signal-to-noise ratio is relatively favorable.
Validation studies of BP tomography usually have concentrated on global LV function, comparing tomographic BP EF with planar BP EF (20,21) or with first-pass radionuclide studies (22). A few reports have compared BP with cardiac MRI measurements (8,9). Accurate and reproducible measurement of global LV EF is critical to the management of coronary disease and heart failure, chiefly because of the importance of this parameter as a marker of cardiac morbidity and mortality (23). An LV EF less than or equal to 50% is accepted as a threshold defining subnormal cardiac function and the point at which patients with 3-vessel coronary artery disease may derive prognostic benefit from coronary intervention. Patients with heart failure with LV EF less than or equal to 35% benefit from implantation of an automated defibrillator or biventricular pacemaker (15). Our data demonstrate that BP AQ identifies patients with these threshold LV EFs with a high degree of accuracy. This technique would thus serve as a valuable means for precisely defining LV global function in patients who might be candidates for these interventions.
Several studies have reported analyses of regional WM by BP-gated SPECT. Most have documented differences between healthy subjects and narrowly defined groups of patients who are not healthy, such as those with arrhythmogenic RV dysplasia (24) or candidates for resynchronization therapy (25). Only 2 studies have compared regional BP calculations against a second independent imaging modality. These reports used operator-dependent BP-gated SPECT algorithms, rather than a fully automated one such as we used. The concept of regional EF originally was developed in conjunction with planar MUGA calculations and was later extended to BP tomography (26). Detection of abnormal regional EF on BP SPECT has been shown to agree well with regional WM assessed by biplane radiographic contrast angiograms (12). RV regional phase delays detected by BP SPECT have been shown to agree with readers' qualitative impressions of RV WM abnormalities seen on biplane radiographic angiograms in patients with arrhythmogenic RV cardiomyopathy (27). Data comparing the assessment of regional WM using quantitative BP gated SPECT with cardiac MRI are, however, lacking. The counts used to compute regional EFs are the same counts used to compute global EF, but validating global EFs does not prove directly that regional EFs are correct. That is particularly true of new totally automated algorithms, such as those evaluated here, so that direct validation with another imaging technology, such as cardiac MRI, is indispensable.
When interventions are performed on vessels supplying segments with marked WM abnormalities, or hibernating myocardium, it is important to document the benefit by serial WM analyses. For example, deterioration of regional WM after coronary artery bypass graft is associated with adverse prognosis (2), and detection of deteriorated regional WM could be used in the future to determine the need for repeated coronary artery bypass graft. So, assessment of regional LV function also has become important, as we try to assess the results of intervention on cardiac function. Our data suggest that BP AQ is well suited for this, because it is accurate in all coronary territories, is quantitative, and is reproducible.
The high degree of correlation of AQ BP to cardiac MRI is likely due to the simplicity of the BP-modeling assumptions. The BP approach we used measures count changes in each of the 17 subvolumes due to blood volume changes in those 3D regions. Consequently, a cardiac MRI finding of a hypokinetic endocardial wall corresponds to a volume bounded by the same endocardial wall that changes less than normal, for which regional EF is abnormally low. Whereas cardiac MRI measures endocardial wall locations with a spatial resolution superior to that of SPECT, the BP approach reported here is insensitive to errors in locating walls so long as the outlines are sufficiently large to encompass the majority of LV counts.
There are limitations to the current study. The cardiac MRI mean radial WV value of 3.4 ± 1.3 cm/s in our controls was lower than that reported in the cardiac MRI literature (28). However, the mean age of 57 y for our control population is substantially older than that of previous investigations in which WV values were determined for subjects in their mid-20s (28). Although there are no data on radial WV values for older subjects, our choice of controls was well matched in age to our patient population.
Limits of agreement were wide between BP AQ and cardiac MRI global EF values. Nonetheless, correlation was high between BP AQ and cardiac MRI global and regional EFs, with no significant differences. The agreement between BP AQ and cardiac MRI for identifying patients with an EF less than 35% and less than 50% implies that BP AQ and cardiac MRI are interchangeable for the purpose of decisions on therapeutic interventions based on global EF. This interchangeability is desirable because, although cardiac MRI is the standard for quantifying LV EF and volumes, it is not widely available, requires considerable expertise, and involves laborious, time-consuming data processing. In contrast, the AQ BP algorithms are rapid and entirely automatic.
Although our study demonstrates a close correlation between global and regional WM assessed by AQ BP and cardiac MRI, the study serves as a preliminary report, with a limited number of patients. The results need to be validated further in a larger number of patients with a greater frequency of severe dysfunction.
CONCLUSION
AQ assessment of regional WM showed a good correlation with visual assessment of BP tomographic cines and quantitative cardiac MRI in this investigation, suggesting that this technique may be a clinically useful tool for assessing both global and regional LV function.
Acknowledgments
We thank Brian Becker for assistance in the collection and processing of nuclear image data; William Schapiro and Michael Passick for assistance in the collection and processing of cardiac MRI data; and Jing Han for expert advice in the statistical analysis of all data. This work received material support from the Saint Francis Cardiac Research Foundation. Kenneth Nichols shares in royalties for the BP-SPECT algorithms.
Footnotes
-
COPYRIGHT © 2009 by the Society of Nuclear Medicine, Inc.
References
- Received for publication July 17, 2008.
- Accepted for publication September 8, 2008.


Jump to section
Related Articles
Cited By...
- No citing articles found.