


Abstract
Myocardial perfusion imaging plays an important role in clinical management of coronary artery disease, but the most commonly used radionuclides significantly underestimate the severity of coronary artery stenosis. The objective of this study was to evaluate the potential clinical utility of the PET compound 18F-fluorobenzyl triphenyl phosphonium (18F-FBnTP) and characterize its capacity to assess the severity of coronary artery stenosis in a canine model in vivo and ex vivo. Methods: 18F-FBnTP myocardial uptake was measured in 17 dogs with various degrees of stenosis of the left anterior descending (LAD) or circumflex (LCx) coronary arteries during adenosine vasodilation, using dynamic PET and γ-well counting. True myocardial blood flow in ischemic (IS) and nonischemic (NIS) beds of the left ventricle was determined with radioactive microspheres. 18F-FBnTP and 99mTc-tetrofosmin activities were compared in 8 dogs ex vivo. Results: The quantitative assessment of the perfusion defect was significantly (P < 0.03) more accurate with 18F-FBnTP than with 99mTc-tetrofosmin, in mild (IS/NIS; 0.72 ± 0.08, 0.93 ± 0.07, respectively, mean ± SE) and severe stenosis (0.42 ± 0.05, 0.64 ± 0.08, respectively), compared with microsphere flow (mild, 0.43 ± 0.06; severe, 0.22 ± 0.04). The IS/NIS ratio of both radionuclides correlated linearly with microsphere flow disparity with a similar slope. Flow defect contrast was 2.7 times greater for 18F-FBnTP than for 99mTc-tetrofosmin, as inferred from the regression line intercept (0.14 vs. 0.38, respectively). The 18F-FBnTP PET IS/NIS ratio (mild, 0.70 ± 0.04; severe, 0.46 ± 0.02), did not differ statistically (P ≥ 0.330) from that measured ex vivo. A nearly identical qualitative and quantitative estimate of stenosis severity was obtained by early, short (5–15-min) and delayed, prolonged (30–60-min) 18F-FBnTP PET scans. The stenotic area measured by PET was 16% smaller than that defined by tissue staining. Conclusion: 18F-FBnTP PET is a promising new technology for rapid noninvasive detection and assessment of perfusion defect severity in the myocardium.
Myocardial perfusion SPECT is an excellent tool for risk stratification in coronary artery disease (CAD), thus effectively guiding decisions regarding revascularization (1). Currently, the SPECT radionuclide 201Tl and the technetium complexes 99mTc-sestamibi and 99mTc-tetrofosmin are the mainstay of myocardial perfusion imaging (MPI) tests. SPECT MPI has relatively high sensitivity in detecting flow defect (averaged 87%) but lower specificity (averaged 75%) (2). Two important factors affect the accuracy of the diagnostic test: uncorrected nonuniform attenuation and photon scatter from extracardiac structures with relatively intense uptake, particularity the liver (3,4). Attenuation artifacts are frequent in 2 large groups of patients, women and obese subjects (5). Attenuation-compensation techniques in SPECT still leave room for improvement, when compared with PET, and may enhance photon scatter from liver (6). In some cases with fixed perfusion defect, electrocardiographically gated SPECT could help to discern attenuation artifact (7). In view of the growing need for noninvasive cardiac imaging, a perfusion tracer with a more favorable organ biodistribution and better image uniformity may have an important impact on CAD management.
PET provides a technology with the ability to perform nonuniform attenuation correction as well as better spatial and temporal resolution than SPECT. Better temporal resolution improves the counting rate and, consequently, image quality. To date, despite these important advantages, PET is rarely used to assess myocardial perfusion clinically. 15O-Water and 13N-ammonia are excellent PET perfusion tracers and may provide a good quantitative estimate of coronary blood flow (8,9). However, the use of 15O-water and 13N-ammonia has been limited to a small number of medical centers with an on-site cyclotron because of their short half-lives. 82Rb, produced by generator, is the most frequently used PET perfusion tracer in the clinical setting (10). However, 82Rb has a lower extraction fraction than 15O-water and 13N-ammonia, has less-than-optimal photon energy, is expensive, and its very short half-life (78 s) necessitates the introduction of relatively high doses, resulting in a high fraction of dead times and randoms and, consequently, noisy images (11). A PET perfusion agent labeled with a longer-life positron emitter, such as 18F, may overcome some of these limitations. In addition, because of the smaller positron energy and, therefore, smaller propagation distance until annihilation, a 18F-tagged agent would also have better spatial resolution than 82Rb (11).
To address this need, we developed a series of 18F-labeled phosphonium cations (12). To date, 18F-fluorobenzyl triphenyl phosphonium (18F-FBnTP) demonstrated the best imaging characteristics. Like the technetium complexes 99mTc-sestamibi and 99mTc-tetrofosmin, it targets mitochondria via a membrane potential-dependent mechanism (13). 18F-FBnTP is a metabolically stable agent with minimal defluorination, demonstrating excellent characteristics as a cardiac imaging agent in healthy dogs, documented by dynamic PET (14). It has a fast and extensive accumulation and prolonged retention in the myocardium, a rapid decline of activity to very low values in the lungs and blood pool, and a liver uptake lower than heart activity. Importantly, 18F-FBnTP demonstrated uniform distribution throughout the entire myocardium with a covariance of 6%–8% in the septum-to-lateral wall axis as well as the base-to-apex axis. The fast distribution kinetics of 18F-FBnTP made high-contrast, uniform images possible by using short (10 min) scans, acquired early (5 min) after administration.
The objective of this study was to characterize the ability of 18F-FBnTP to detect and assess the magnitude of coronary flow disparity and the size of the risk area in dogs with acute coronary artery stenosis of various degrees of severity. 18F-FBnTP myocardial regional activity was measured ex vivo by direct tissue counting and in vivo by dynamic PET. 18F-FBnTP myocardial regional uptake was compared ex vivo with that of 99mTc-tetrofosmin.
MATERIALS AND METHODS
Dog Preparation
Seventeen adult mongrel dogs of either sex, weighing 20–30 kg, were anesthetized with thiopental sodium (20 mg/kg), intubated, and ventilated on a respirator (Harvard Apparatus). Anesthesia was maintained by isoflurane (2.5%), administered by a Draeger anesthesia machine. When the animals were transported to or from the imaging laboratory, they were respirated with an Ambu-bag (NWMedical Solutions). The following vital signs were continuously monitored, recorded approximately every 15 min and maintained at physiologic level throughout the study: systolic blood pressure (BP), diastolic BP, heart rate, Spo2 (oxygen saturation as measured by pulse oximetry), Spco2 (carbon dioxide saturation as measured by pulse oximetry), respiratory rate and volume, temperature, and anesthesia level. Two femoral arteries, one femoral vein, the right jugular vein, and the right carotid artery were cannulated with 9-French sheaths. A 6-French pig-tailed catheter was placed, using fluoroscopic guidance, in the left ventricle by way of one of the femoral artery sheaths for the injection of radioactive microspheres. The other femoral artery sheath was used to collect blood for a microsphere reference blood-flow sample. The venous sheaths were used for tracer, drug, and fluid injections.
The left anterior descending (LAD) coronary artery or the left circumflex (LCx) coronary artery was dissected free 1–2 cm from origin, a cuff occluder was placed around the artery, and a Doppler ultrasonic flow probe was placed just proximal to the occluder. All procedures were approved by the Johns Hopkins Institutional Animal Care and Use Committee, and conformed to the American Heart Association Guidelines for the Use of Animals in Research.
Experimental Protocols
Protocol 1: Assessment of Perfusion Defect by Direct Tissue Counting.
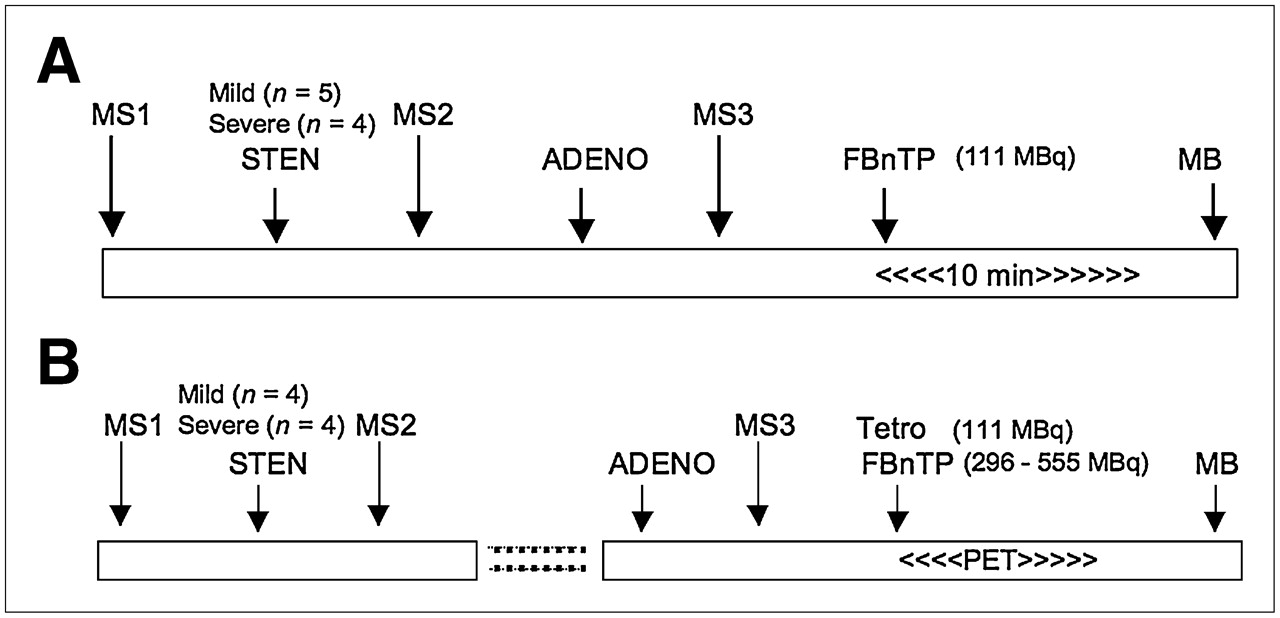
The experimental protocol is depicted in Figure 1A. During the baseline period, before stenosis was created, radioactive microspheres (MS1) were administered to measure baseline blood flow as described. Next, the coronary artery was partially occluded. Severity of occlusion was assessed by the magnitude of the reactive hyperemic (RH) response. The RH response of the occluded vessel was determined by snaring of the occluder for 10 s and then releasing the snare to produce a RH response to this transient vessel occlusion. Angiographic validation was not performed. To produce a “severe stenosis” the snare was adjusted to completely abolish the hyperemic response to this transient vessel occlusion, without affecting baseline flow. A “mild stenosis” was defined as an approximate 50% reduction in the RH response. After stenosis was established, a second set of microspheres (MS2) was administered. Next, adenosine infusion was begun at a rate of 0.14 mg/kg/min. At maximal adenosine effect (identified as maximal blood flow by the flow probe), 111 MBq (3 mCi) of 18F-FBnTP were administered by intravenous bolus injection, simultaneously with a third set of microspheres (MS3). Ten minutes later, the stenotic vessel was occluded completely and Monastral blue dye (0.5 mL/kg) was injected into the left atrium to demarcate the area at risk (absence of blue staining). Dogs were euthanized by elevating the isoflurane anesthesia (10%) and dissecting the heart. The heart was sliced into five 1- to 1.5-cm-thick rings, which were prepared for γ-well counting as described.

Experimental protocols. MS = microspheres; STEN = stenosis; ADENO = adenosine; MB = Monastral blue; Tetro = tetrofosmin.
Protocol 2: Assessment of Perfusion Defect by Dynamic PET and Direct Tissue Counting.
Stenosis was established in the LAD (n = 4) or LCx (n = 4) coronary artery. The experimental protocol is depicted in Figure 1B. After stenosis was established and MS1 and MS2 microspheres were administered, as described in protocol 1, the dogs were attached to a cradle in a prone position and transferred to the PET suite. The dogs were positioned on the scanner bed so that the heart was centered in the scanner field of view (FOV), aided by repeated 1-min transmission scans, using a 68Ge/68Ga source. PET images were acquired on a GE Healthcare Advance scanner (35 axial slices, 4.25-mm thick, 14.4-cm axial FOV). A 10-min transmission scan was performed for subsequent attenuation correction. Next, adenosine was administered at a rate of 0.25 mg/kg/min. At peak blood flow, a dynamic PET scan was started together with the simultaneous injection of microspheres into the left atrium and intravenous administration of a mixture of 296–555 MBq (8–15 mCi) 18F-FBnTP and 111 MBq (3 mCi) 99mTc-tetrofosmin. Because of the shorter half-life, 18F-FBnTP was given in a larger dose than 99mTc-tetrofosmin—to compensate for the radioactivity decay—taking place during the time interval between tracer injection and the γ-well counting. The scan duration was 5 s × 24, 60 s × 5, 120 s × 4, and 300 s × 9, for a total time 60 min. At completion of the imaging procedures, Monastral blue was injected and the heart was removed and sliced into 1- to 1.5-cm-thick rings, which were prepared for radioactivity counting as outlined below. The dosing of adenosine in protocol 2 was adopted from an experimental protocol of other laboratories (16) to allow comparison with results of the present study.
Image and Data Analysis
Image Processing.
PET scans were corrected for radioactivity decay as well as for attenuation by using the acquired transmission scan. To prevent error due to misregistration of the transmission and emission scans, dogs were strapped to the scanner bed, anesthetized, and continuously monitored for possible movement. Image reconstruction was accomplished by filtered ordered-subset expectation maximization (OSEM, 2 iterations, 18 subsets) using a 26 × 26 cm FOV, 256 × 256-pixel matrix, and 2 × 2 × 4.25 mm voxel size. Reformatting oblique slices to vertical and horizontal long-axis and transverse short-axis images was performed on an Xeleris Functional Imaging workstation (GE Healthcare). Short-axis slices (4-mm3 voxel) were used to generate polar maps. Circumferential activity profiles were generated by radial sampling of maximum values on short-axis images summed over a preselected postinjection time interval. Twenty-four sectors (15° each), beginning at the intersection of the right ventricular wall, the interventricular septum, and the left ventricular (LV) anterior wall, were placed in a counterclockwise direction on the short-axis slices from base to apex. Time–activity curves were generated using the region-of-interest (ROI) method. ROIs (4 × 4 mm) were positioned at the center of the LV wall on the short-axis images summed over the 30- to 60-min time interval. Four ROIs were placed on each quadrant; a single ROI was placed in the middle of the LV chamber. The ROI template was transferred to the serial images of the corresponding short-axis slice, and time–activity curves were generated. Image processing was performed using an Analyze package (Mayo Clinic Analyze; Mayo Clinic, Rochester, MN).
Quantification of Regional Myocardial Blood Flow with Microspheres, 18F-FBnTP, and 99mTc-Tetrofosmin Activities.
Measurements of regional coronary flow were obtained at preselected times by injecting microspheres into the LV, while simultaneously collecting reference blood from a femoral artery catheter. For each measurement, 2 million 15-μm spheres (Perkin Elmer Co.) labeled with 57Co, 113Sn, 103 Ru, 95Nb, or 46Sc were administered, while a reference blood sample was obtained from an aortic catheter, at a rate of 2.16 mL/min, for 130 s, starting 10 s before injection of the microspheres.
The Monastral blue–stained LV slices were photographed and traced on a plastic transparency to indicate slice borders and outline the risk and normal regions. Each ring was sectioned radially into multiple radial pieces, and each in turn was sectioned into epicardial and endocardial halves. The location of each transmural wedge was recorded on the transparency. This allowed, later on, correlation of the activity measured ex vivo and in vivo from overlapping regions in an accurate manner. Each piece was weighed and counted in a γ-counter for 10 min. 18F activity was counted immediately after dissection; technetium activity was counted 24 h after dissection, and microsphere activities were counted 72 h thereafter. Tissue counts were corrected for decay, background, and isotope spillover. Transmural activity was calculated as the average of corresponding epicardial and endocardial samples. Coronary blood flow was calculated as previously described (15).
The ischemic-to-nonischemic (IS/NIS) activity ratio was calculated for the 3 midventricular rings. The representative activity of 18F-FBnTP, 99mTc-tetrofosmin, and microspheres in the stenotic area was calculated as the mean activity counted in 2 successive transmural tissue samples, collected from the stenotic zone, and demonstrated the lowest microsphere flow at the time adenosine was injected. Similarly, the representative activity of the normal bed was calculated as the mean of 2 transmural tissue samples demonstrating the highest microsphere flow during adenosine injection.
Quantitation of the IS/NIS activity ratio on the 18F-FBnTP PET images was obtained by selecting short-axis images visually corresponding to the basal aspect of the 3 midventricular anatomic slices, based on measuring the inner and outer ring diameters, and the anatomic indices, the RV−LV junctures, and the papillary muscle, which were easily visualized on short-axis PET images of all dogs. Monastral blue−stained myocardial tissue sections were about 1-cm thick. Because of the geometry of the ischemic zone, the size of the Monastral blue−negative area is not necessarily the same on the basal and the apical faces of individual slices. Therefore, matching of PET and tissue slices was accomplished while tissue slices were placed with their basal side facing up. Next, a histogram of the circumferential activity profile of the selected short-axis PET images was generated, using radial sampling, 24 sectors, 15° each. The mean value of sectors in regions, corresponding to the stenotic and normal regions on Monastral blue−stained slices, was computed.
Determination of Risk Area Size.
Size of the risk area on individual Monastral blue−stained myocardial sections and coplanar short-axis PET images was calculated using digital planimetry (GTCO Digitizing Tablet) as a fraction of the total slice area. PET images and anatomic myocardial slices were matched as described.
Statistical Analysis
Differences between means within a group of dogs were assessed by repeated-measures ANOVA, and post hoc comparisons were made using the Scheffé test. Paired Student t tests with values of P ≤ 0.05 were considered significant. Groups of dogs were compared by 1-way ANOVA. Linear regression analyses were performed using Spearman linear regression. Statistical analysis was performed using a STATA package (StataCorp.).
RESULTS
Hemodynamics
Hemodynamics were monitored continuously and remained stable throughout the study (Table 1). There was no significant difference in hemodynamics measures between dogs in protocols 1 and 2; therefore, data were pooled.
Hemodynamic Parameters
Microsphere Blood Flow
Mean absolute transmural blood flow in the stenotic and normal beds before and after stenosis, as well as during administration of adenosine at a rate of 0.14 mg/kg/min (protocol 1) or 0.25 mg/kg/min (protocol 2), is shown in (Table 2). “Baseline” and “Stenosis” values represent data pooled from protocol 1 and 2 dogs.
Blood Flow Measured by Microspheres
Comparison Between 18F-FBnTP and 99mTc-Tetrofosmin Activities
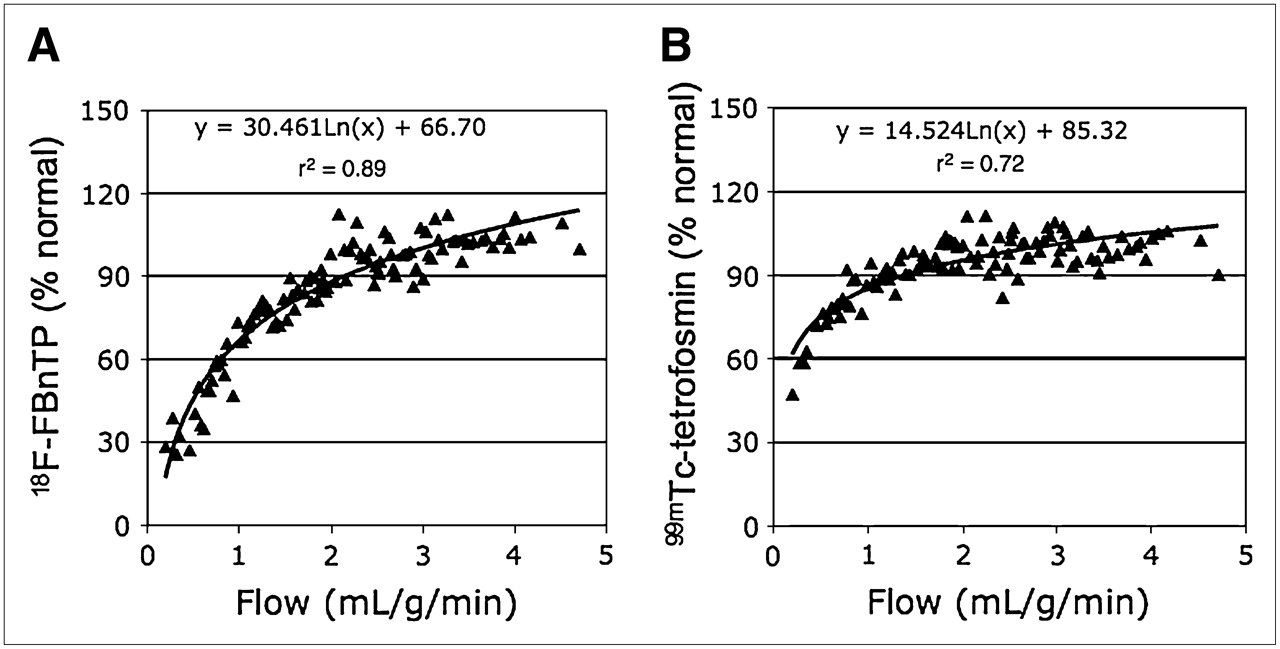
Figure 2 depicts the myocardial activities of 18F-FBnTP and 99mTc-tetrofosmin, versus microsphere flow, in endocardial and epicardial samples from dogs with either severe or mild stenosis during adenosine vasodilation. Tracer activity is normalized to the mean activity in the normal bed. At low flow rates (<0.5 mL/g/min), 18F-FBnTP approached zero values faster than 99mTc-tetrofosmin. The myocardial activity of both tracers plateaued as flow increased. However, the upslope of radioactivity in the range of flow rates ≥ 1.5 mL/g/min was greater for 18F-FBnTP (0.075) than that for 99mTc-tetrofosmin (0.013).

Normalized 18F-FBnTP (A) and 99mTc-tetrofosmin (B) activities plotted as a function of microsphere flow during adenosine infusion from endocardial and epicardial samples of dogs with mild-to-severe stenosis. Both tracers overestimate and underestimate blood flow rates in the low and the high range, respectively, but 18F-FBnTP contrast between low and high flow rates is greater than that of 99mTc-tetrofosmin. For the sake of visual clarity, data per dog were sorted according to microsphere flow, and each point represents the mean of 4 neighboring values.
The IS/NIS activity ratio was calculated for 18F-FBnTP, 99mTc-tetrofosmin, and microsphere flow during adenosine infusion at 0.25 mg/mL/kg in the mild and severe stenosis groups (Fig. 3A). In both groups of dogs, the 18F-FBnTP estimate of the flow defect (IS/NIS ratio: mild, 0.72 ± 0.08; severe, 0.42 ± 0.05) was significantly (P ≤ 0.03) more accurate than that of 99mTc-tetrofosmin (mild, 0.93 ± 0.07; severe, 0.64 ± 0.08) but was significantly lower (P < 0.05) than the microsphere flow defect count ratio (mild, 0.43 ± 0.06; severe, 0.22 ± 0.04). Similar relationships were observed when adenosine was administered at the clinical dose (0.14 mg/kg/min) in the severe stenosis group (18F-FBnTP, 0.63 ± 0.05; microsphere, 0.32 ± 0.04) and the mild stenosis group (18F-FBnTP, 0.80 ± 0.03; microsphere, 0.59 ± 0.06) (Fig. 3B).
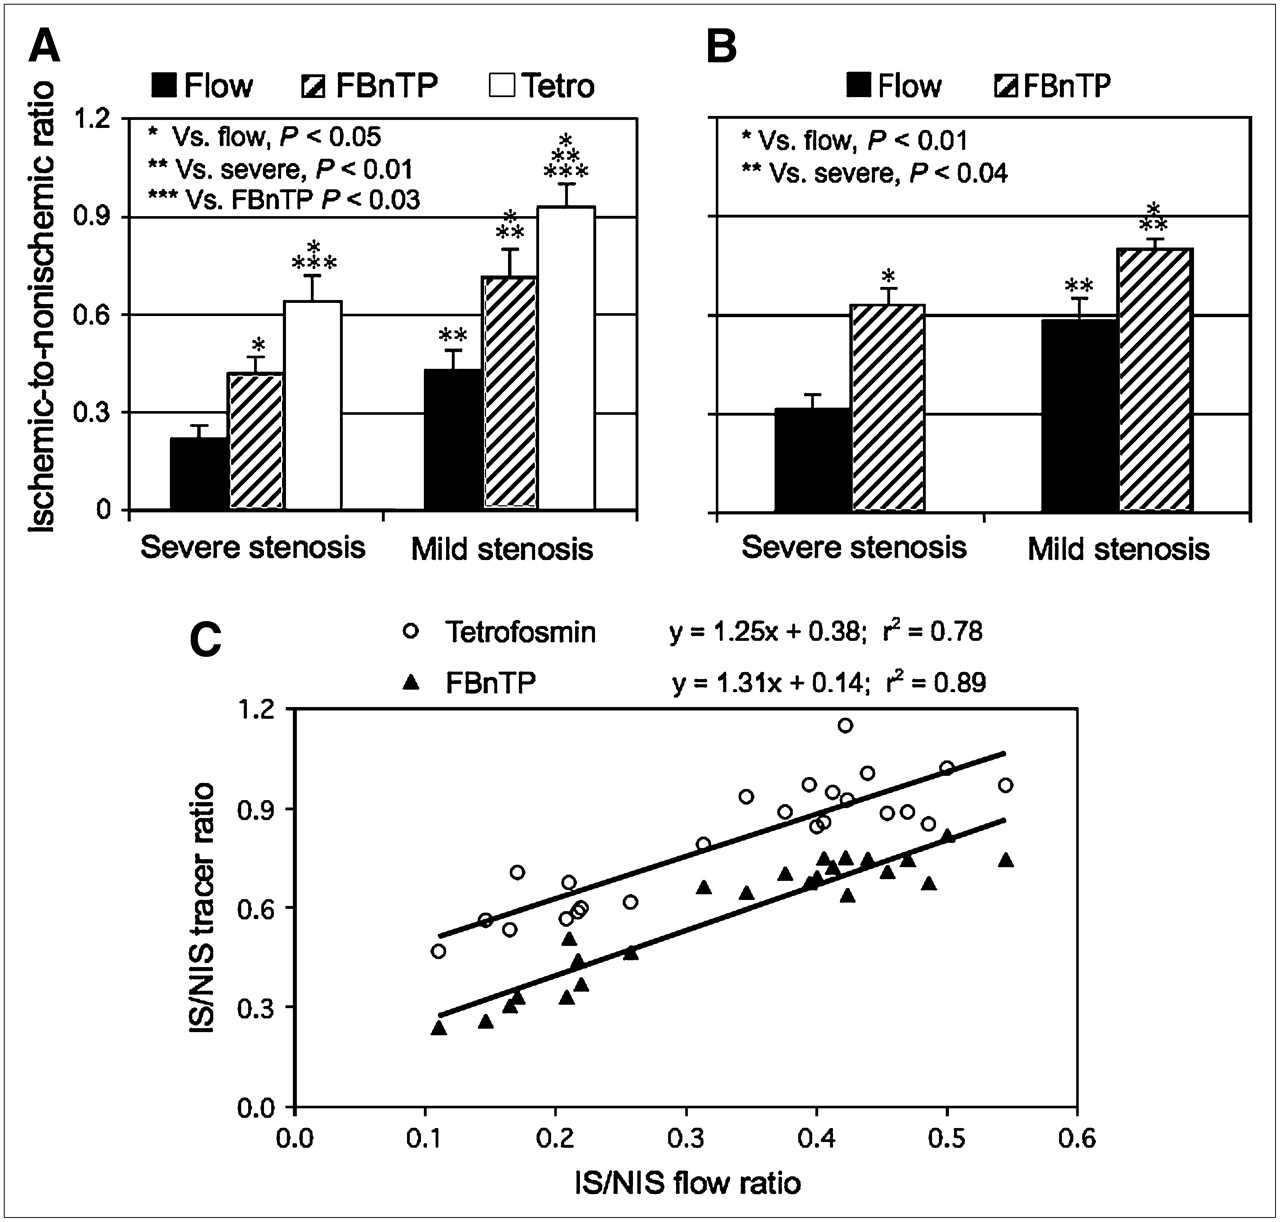
Mean IS/NIS activity ratio of microsphere flow and 18F-FBnTP and 99mTc-tetrofosmin (Tetro) activities in dogs with severe and mild stenosis during adenosine administration at a rate of 0.25 mg/kg/min (A) and 0.14 mg/kg/min (B). 18F-FBnTP provides a significantly more accurate estimate of defect severity than 99mTc-tetrofosmin, as compared with the microsphere flow defect count ratio. 18F-FBnTP maintains a similar relationship with microsphere defect flow during administration of adenosine in clinical and supraclinical doses. (C) 18F-FBnTP and 99mTc-tetrofosmin versus microsphere flow activities expressed as IS/NIS activity ratio calculated for individual myocardial sections (3 per dog) in dogs with various degrees of stenosis (n = 8). Flow defect contrast is 2.7 times greater for 18F-FBnTP than that for 99mTc-tetrofosmin, as inferred from the curve intercepts (0.14 and 0.38, respectively).
To further characterize the difference between 18F-FBnTP and 99mTc-tetrofosmin, the IS/NIS ratios of 18F-FBnTP and 99mTc-tetrofosmin, calculated for individual myocardial sections (3 sections per dog; 8 dogs), were correlated with the microsphere flow ratio during adenosine infusion (Fig. 3C). 18F-FBnTP and 99mTc-tetrofosmin demonstrated a good linear correlation versus microsphere flow, with a similar slope (1.25 vs. 1.31, respectively). Because the regression lines were nearly parallel, the difference between the 2 tracers can be reliably estimated by the intercept, which was much smaller for 18F-FBnTP than for 99mTc-tetrofosmin (0.14 vs. 0.38, respectively). This indicates that the flow defect contrast (IS/NIS) is 2.7 times greater for 18F-FBnTP than that for 99mTc-tetrofosmin.
18F-FBnTP PET In Vivo
The mean IS/NIS activity ratios calculated on PET short-axis images acquired at 30–60 min after injection from mildly and severely stenotic dogs were very close to those obtained by direct tissue counting (0.70 ± 0.04 and 0.46 ± 0.02, respectively; P ≥ 0.330). Moreover, the IS/NIS activity ratio calculated from individual short-axis images by PET demonstrated a strong linear correlation with activity ratios of 18F-FBnTP (R2 = 0.94) as measured from corresponding regions on coplanar myocardial sections by γ-well counting (Fig. 4A). Similarly, high correlation (R2 = 0.79) was found between the flow defect count ratio measured by PET and microspheres (Fig. 4B).
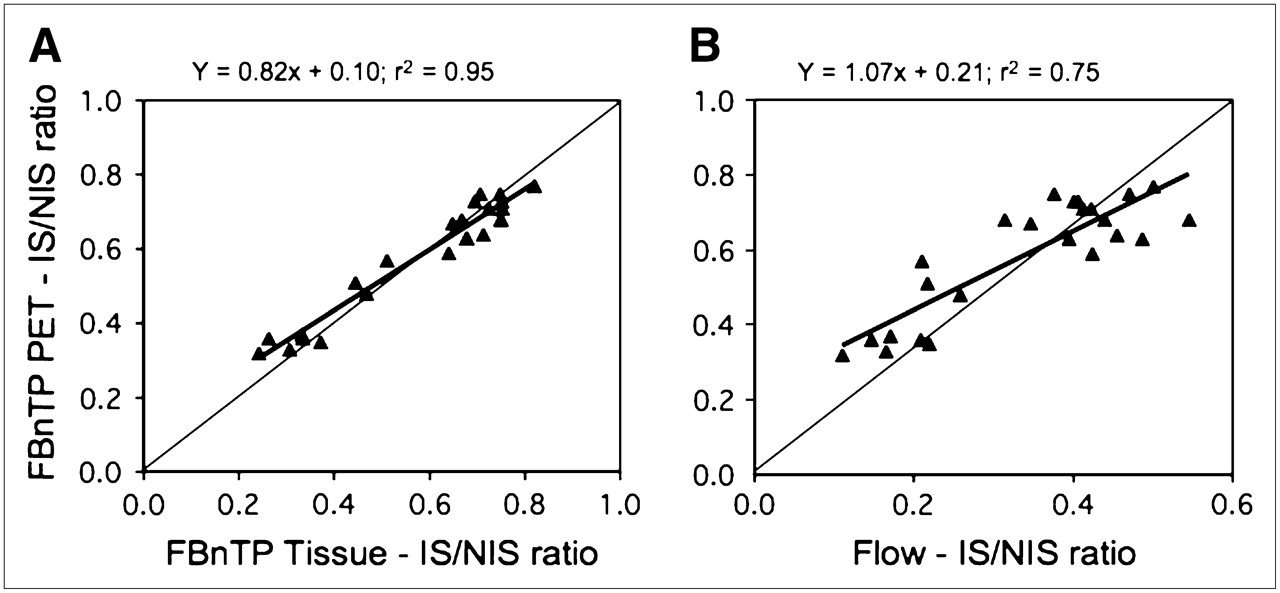
IS/NIS activity ratio calculated by PET is plotted against the IS/NIS calculated by well counting for 18F-FBnTP (A) and microsphere flow (B) from coplanar myocardial sections (3 slices per dog; 8 dogs). In vivo estimate of flow defect using PET closely corresponds to tracer and flow activity counted directly in tissue.
Examples of cardiac 18F-FBnTP PET images acquired in dogs with mild LCx, moderate LAD, or severe LCx flow defect are presented in Figure 5. For comparison, polar maps obtained from a healthy dog are presented in the far left column. Qualitatively, defect severity can be identified by visual inspection of the short-axis images and polar maps. Quantitative values of the IS/NIS ratio were calculated from the circumferential activity profiles (bottom row) generated from the short-axis PET images (second row). The 18F-FBnTP IS/NIS ratios obtained with PET in the mildly, moderately, and severely stenotic dogs were 0.74, 0.64 and 0.33 compared with 0.55, 0.45, and 0.16 measured by microspheres, respectively.
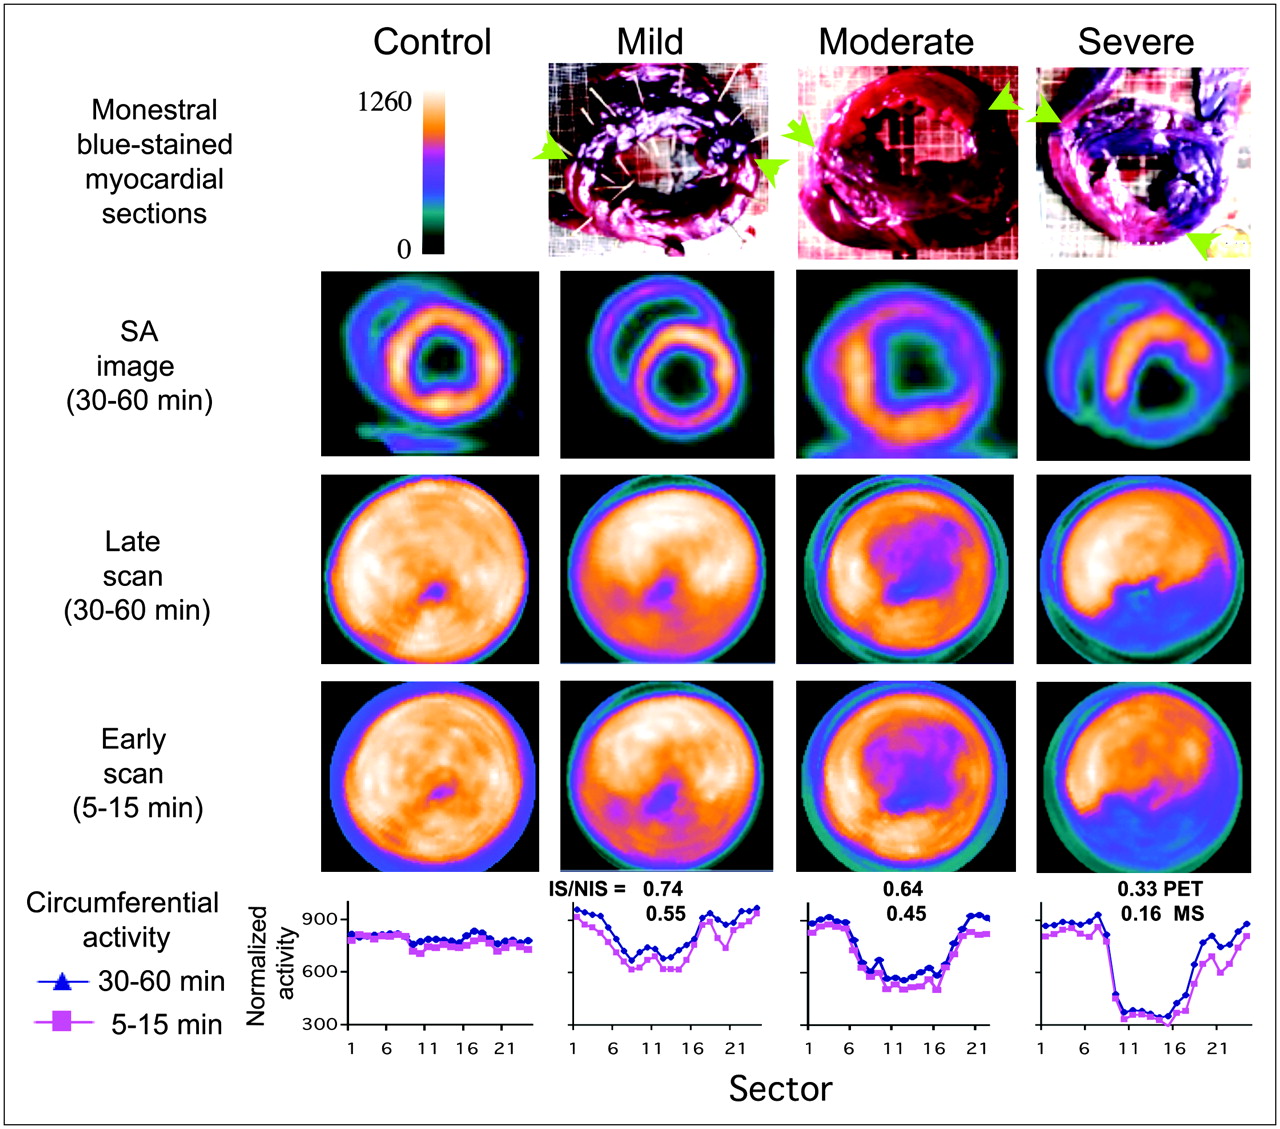
Examples of 18F-FBnTP PET images acquired in dogs with mild LCx, moderate LAD, or severe LCx stenosis. For purposes of comparison, 18F-FBnTP PET polar maps acquired in a healthy dog are presented in far left column. Monastral blue−stained anatomic slices, and 30- to 60-min coplanar 18F-FBnTP PET short-axis (SA) images, as well as polar maps acquired over 30- to 60-min and 5- to 15-min time intervals, are presented. Ischemic zone on anatomic sections is of lighter color, its boundaries indicated by green arrows. Circumferential activity profile of short-axis images (second row), summed over 30- to 60-min and 5- to 15-min time intervals, is presented (bottom row). Activity profiles are normalized to the global mean per dog. Mean IS/NIS of 18F-FBnTP (PET) and microsphere flow (MS), calculated for each dog, is presented in bottom row.
Detection and Imaging of Flow Defect Using Early, Short 18F-FBnTP PET Scans
Defect contrast was measured on 10-min scans acquired 5 min postinjection and compared with that obtained on 30–60 min scans. Nearly identical IS/NIS activity ratios were obtained by the early, short vs. the delayed, prolonged scans (R2 = 0.98, slope = 1). Figure 5 demonstrates the polar plots of 5–15 min and 30–60 min scans obtained in the mildly, moderately and severely stenotic dogs. The stenotic zone could be identified, and a distinction between severities of stenosis could be discerned with the same visual clarity on the short, early scan, as on the prolonged, delayed scan. The close similarity between the 5–15 and 30–60 min scans can be appreciated quantitatively by the overlap of circumferential activity profiles (Fig. 5, bottom row).
Size of Area at Risk by 18F-FBnTP PET
In 7 of 8 dogs, the risk area was measured on coplanar PET images and Monastral blue−stained myocardial slices, using planimetry. In 1 dog, staining was too faint to accurately demarcate the boundaries of the risk area. Examples of stained myocardial rings and corresponding PET short-axis images are presented in Figure 5. A strong linear correlation (R2 = 0.72) was found between the size of the risk area determined from PET and the Monastral blue−negative region, as measured in individual slices (7 dogs, 21 slices) (Fig. 6). Size of the risk area is expressed as the fraction of the total slice area. The mean risk size on PET was 16% lower than that measured on stained myocardial slices (0.31 ± 0.05, 0.37 ± 0.03, respectively).

Defect size measured on PET images and Monastral blue−stained myocardial rings (7 dogs, 21 rings). Values represent extent of stenotic zone as a fraction of total slice area.
18F-FBnTP Uptake Kinetics
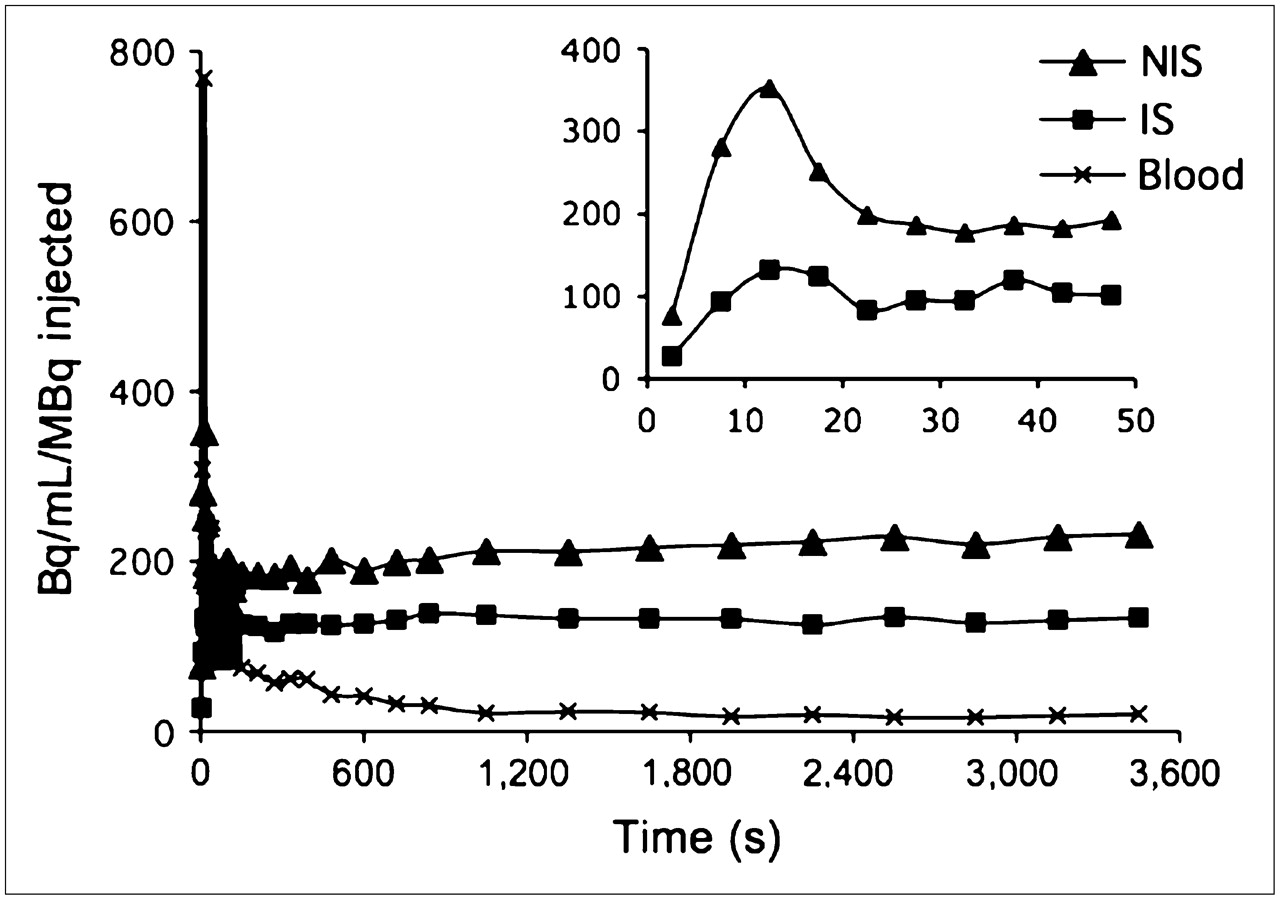
18F-FBnTP kinetics in the stenotic and normal beds was characterized using dynamic PET. 18F-FBnTP accumulation during the first 2 min was documented by 5-s scans. The time–activity curves generated on short-axis PET images demonstrated rapid accumulation and equilibration of 18F-FBnTP in the stenotic and normal beds during adenosine vasodilation. Peak activity was obtained within 10–20 s after injection, and a near-plateau concentration 10–20 s thereafter, which was retained throughout the scanning time (up to 60 min). Time-to-peak activity was very consistent throughout myocardial segments within dogs, as well as between dogs. No significant difference in time-to-peak activity in the stenotic and normal zones was observed (P > 0.136). In all dogs, however, 18F-FBnTP peak activity was significantly (P < 0.0011) lower in the stenotic zone (190.4 ± 26.1 Bq/cm3/MBq) than that in the normal zone (395.5 ± 60.96 Bq/cm3/MBq). Similar retention kinetics was observed in the stenotic and normal zones. Figure 7 depicts a representative example of 18F-FBnTP time–activity profile in a mildly stenotic dog.

18F-FBnTP time–activity curves in stenotic and normal zones and LV chamber from dog with mild stenosis.
DISCUSSION
The objective of this study was to characterize, in vivo and ex vivo, the capacity of the PET compound 18F-FBnTP to assess the flow defect severity and the size of the risk area, using microsphere blood flow and Monastral blue staining, respectively, as gold standards. 18F-FBnTP myocardial uptake was directly compared with 99mTc-tetrofosmin, a clinically accepted perfusion agent. 99mTc-Tetrofosmin was selected as a reference tracer because both tracers are sequestered by cells via a similar membrane potential-dependent mechanism (13,16) and retained in the myocardium for a prolonged time (14,17). Because of better imaging properties, 99mTc-tetrofosmin and 99mTc-sestamibi are more frequently used in clinical MPI studies than 201Tl (18). Therefore, 99mTc-tetrofosmin affords an appropriate candidate for assessing the potential clinical utility of 18F-FBnTP. In the present study, 18F-FBnTP was compared with 99mTc-tetrofosmin under ex vivo conditions. Taking into consideration the better spatial and temporal resolution of PET compared with SPECT, most likely, the better performance of 18F-FBnTP observed ex vivo will be retained during PET.
Assessment of Flow Disparity
The data demonstrated in Figure 2 show both 18F-FBnTP and 99mTc-tetrofosmin overestimated flow in the low range and underestimated flow in the high range but 18F-FBnTP agreed more closely with microsphere flow than 99mTc-tetrofosmin. At flow rates < 0.5 mL/min/g, 18F-FBnTP approached zero values faster than 99mTc-tetrofosmin. At high flow rates ≥ 1.5 mL/min/g, 99mTc-tetrofosmin reached a plateau concentration, whereas the amount of 18F-FBnTP taken up by the myocardium continued to rise at a significantly greater rate. The 18F-FBnTP upslope was 0.075 compared with 0.013 for 99mTc-tetrofosmin. Other dog studies report that 99mTc-tetrofosmin myocardial accumulation reaches a plateau at flow rates > 1.5–2 mL/min/g (15,17–21). The greater upslope at high flow rates indicates greater myocardial extraction, as demonstrated for other perfusion tracers (15). The behavior of 18F-FBnTP is more desirable for stress–rest studies because it increases the contrast of flow defect. However, further studies are needed to directly quantify the 18F-FBnTP extraction fraction in the myocardium, using first-pass models (9,15,22,23).
A more detailed comparative analysis of 18F-FBnTP and 99mTc-tetrofosmin flow-dependent uptake was obtained by examining the relationships of the IS/NIS activity ratios calculated for individual myocardial sections. The IS/NIS ratio of both tracers correlated linearly with the flow defect count ratio and resulted in near-parallel linear regression curves for 18F-FBnTP and 99mTc-tetrofosmin. The difference in the capacity to distinguish flow disparity can be assessed by the intercept of the linear regressions (Fig. 3C), which was smaller for 18F-FBnTP than for 99mTc-tetrofosmin (0.14 vs. 0.38, respectively). This finding suggests that the contrast between the ischemic and normal beds is nearly 2.7 times greater for 18F-FBnTP than for 99mTc-tetrofosmin and that this difference is consistent, regardless of the severity of stenosis. The better distinction between ischemic and normal beds is in line with the finding that 18F-FBnTP is more responsive than 99mTc-tetrofosmin to alterations in blood flow rate in the low and high range as well.
Several factors may underlie the better extraction of 18F-FBnTP compared with 99mTc-tetrofosmin. Uptake and retention mechanisms are important determinants of the net accumulation of a tracer in the myocardium. However, these factors may have little contribution, as both 18F-FBnTP and 99mTc-tetrofosmin accumulate in cells in a membrane potential-dependent manner (13,16), as well as demonstrate prolonged retention in the myocardium (14,17). The rate of diffusion through membranes of the capillary wall endothelial cells, as well as the parenchymal cells is key to the capacity of a tracer to follow high flow rates, as described by the Gosselin and Stibitz model (24). In vitro kinetics assays suggest that 18F-FBnTP permeates cellular membranes faster than 99mTc-tetrofosmin. In isolated ventricular myocytes, the time to reach a plateau concentration was 30 min for 18F-FBnTP (14) compared with 60 min for 99mTc-tetrofosmin (16). The overall molecular size and geometry, as well as the lipophilicity of these 2 agents are clearly different, and these factors must impact on the transmembrane exchange process. The molecular size of 99mTc-tetrofosmin, a diphosphine complex, is much greater than that of 18F-FBnTP, and this probably plays a major role in limiting its passage across the capillary barrier. Lipophilic cationic compounds cross the lipid bilayer barrier by passive diffusion, which is governed by attractive hydrophobic and repulsive electrostatic forces (24). The attractive hydrophobic effect increases with increasing the cation solvent-accessible surface area (25), which is expected to be larger for 18F-FBnTP because of its much smaller molecular size than 99mTc-tetrofosmin.
Potential Clinical Implications
The potential clinical utility of 18F-FBnTP was evaluated by PET in dogs with varying degrees of stenosis. The accuracy of quantifying the flow defect by PET was assessed by comparing the IS/NIS activity ratio with that calculated by direct tissue counting. The mean18F-FBnTP IS/NIS activity ratio measured from PET in the mild and severe stenosis groups was nearly identical to that obtained by well counting. Similarly, the 18F-FBnTP PET IS/NIS ratio, calculated for individual myocardial short-axis images, demonstrated a direct strong linear correlation (R2 = 0.94), overlapping the line of identity, with the tissue activity ratio measured ex vivo. This finding suggests that the better performance of 18F-FBnTP compared with 99mTc-tetrofosmin, observed ex vivo, will be expressed in vivo as well using cardiac PET.
The size of the risk area measured on individual PET images was very close to that measured on Monastral blue−stained coplanar cardiac sections. The mean risk area on PET was 84% of the true extent as measured on the stained sections. The 18F-FBnTP underestimation of risk area is much smaller than that reported for technetium complexes. SPECT studies in 7 dogs with partial coronary occlusion show that the defect size on 99mTc-sestamibi images was only a fraction (37% ± 30%) of that measured by 201Tl scans (26). Similar observations were obtained in clinical studies (27–30). The better efficacy of 201Tl may be attributed to the better extraction fraction, compared with the technetium complexes (21,25,27). This suggests that in addition to methodologic factors—such as the PET scanner better resolution and attenuation correction—the relatively accurate delineation of risk area observed in the current study reflects the capability of 18F-FBnTP to follow coronary blood flow over a wide range of rates better than 99mTc-tetrofosmin.
Scatter of photons from extracardiac structures (e.g., liver) introduces artifacts that may mask the detection of perfusion defects mainly in the inferior LV wall. Another factor, which may affect the defect contrast on noninvasive imaging scans, is the background activity residing in the lung parenchyma. Sinusas et al. (18) reported that in dogs the 99mTc-tetrofosmin LV wall-to-liver and LV wall-to-lung uptake ratios, at 30 min after injection, are 1:1.7 and 2:1, respectively, compared with 1.2:1 and 12:1, found for 18F-FBnTP in the same species (14). In addition, 18F-FBnTP PET showed a highly uniform distribution of activity throughout the entire myocardium, including the inferoapical aspect, with covariance in the short and longitudinal axes of only 6%–8% (14). This finding suggests that regional decreases of 18F-FBnTP myocardial activity as small as 8% can be detected with confidence >1σ (68%) on PET images. The excellent image uniformity and contrast, combined with the better perfusion characteristics, as well as the scanner methodologic advantages, suggest that 18F-FBnTP PET may resolve small flow defects undetected by 99mTc-tetrofosmin SPECT scans.
Clinical perfusion studies indicated that the SPECT sensitivity rate is not uniform throughout the entire myocardium. In a study of 113 patients with significant CAD, 99mTc-methoxyisobutylisonitrile SPECT sensitivity for recognizing disease in the LAD was 80% but it dropped to 70% and 63% in the LCx and right coronary artery, respectively (31). More than other cardiac territories, the inferior wall is susceptible to attenuation artifacts and photon scatter from the liver (32,33). In the present study, in protocol 2, we occluded the LCx in 4 dogs and the LAD in 4 dogs. We did not find differences in detecting and assessing the severity of stenosis in these 2 groups of dogs, as compared with microsphere flow. In 3 dogs, the risk area was localized in the inferior wall (e.g., the dogs with mild and severe stenosis in Fig. 5). This suggests the potential of 18F-FBnTP PET to identify the flow defect with same high accuracy throughout the myocardium.
Dynamic PET showed that 18F-FBnTP reaches equilibrium concentrations in the myocardium within <1 min. The rapid distribution kinetics allowed acquiring images of high diagnostic quality using early, short (5–15 min) scans. The same defect contrast was obtained on 5- to 15-min and 30- to 60-min scans. The rapid kinetics combined with the favorable organ distribution and the fast clearance of extracardiac activity suggests that, with 18F-FBnTP PET technology, perfusion studies can be performed shortly after injection. This may obviate the waiting period (1–2 h) recommended for SPECT studies, which is required for clearance of extracardiac activity.
In the present study, the performance of 18F-FBnTP as a perfusion tracer was assessed in an acute model of ischemia, in which myocardial viability is intact. However, in a patient with chronic ischemia, myocardial viability might be affected as well, either reversibly (e.g., stunning) or irreversibly (e.g., infarct). The mitochondrial membrane potential (▵ψm) is the driving force of 18F-FBnTP cellular uptake. ▵ψm is a sensitive measure of mitochondrial bioenergetics (34) and, hence, tissue viability. Therefore, alterations in myocardial viability are expected to affect the cellular uptake of the voltage sensor and thereby interfere with the detection of coronary blood flow abnormalities. However, SPECT studies using the ▵ψm-targeted 99mTc-sestamibi suggest that imaging of resting myocardial blood flow and flow reserve is an effective approach for differentiating contractile dysfunction associated with flow abnormalities in the presence and absence of persistent or irreversible myocardial injuries (1,2). Further studies of chronic models of ischemia are required to characterize 18F-FBnTP capacity to distinguish between blood flow and viability defects.
CONCLUSION
18F-FBnTP demonstrated several characteristics, which are important for a successful MPI agent. (a) 18F-FBnTP estimates of flow disparity, during adenosine-induced hyperemia, allow not only categoric distinction between mild and severe stenosis, but also a quantitative stratification of the magnitude and extent of flow defect over a wide spectrum of stenosis severity, significantly more accurate than 99mTc-tetrofosmin. (b) The 18F-FBnTP PET defect contrast was very close to that measured by direct tissue counting (r2 = 0.95, slope = 0.82). In view of the superior methodology of PET compared with SPECT, the better ex vivo performance of 18F-FBnTP as the perfusion tracer, relative to 99mTc-tetrofosmin, will be enhanced in clinical MPI studies. (c) 18F-FBnTP PET affords a relatively accurate measure of the extent/size of the flow defect. (d) The fast kinetics of 18F-FBnTP allows one to obtain the high-contrast flow defect by a short, early PET scan. (e) The highly uniform distribution allows one to detect flow defects with the same accuracy regardless of the segmental localization. (f) The relatively longer half-life of 18F may resolve some of the disadvantages of PET perfusion tracers, currently available in the clinical setting (82Rb, 15O, 13NH3), and thus afford better exploitation of the superior imaging characteristics of the PET scanner as well as promote the role of PET in cardiac perfusion studies. These characteristics suggest that 18F-FBnTP PET technology may provide a means for resolving small-magnitude flow defects not seen by SPECT studies, with the same high diagnostic accuracy throughout the entire myocardium, using a more efficient imaging protocol with better patient throughput.
Acknowledgments
This study was supported in part by a research grant from Nihon Mediphysics. We are grateful to Dr. Masroor Abro for technical assistance and Mr. David Clauth for performing the PET imaging.
Footnotes
-
COPYRIGHT © 2007 by the Society of Nuclear Medicine, Inc.
References
- Received for publication December 8, 2006.
- Accepted for publication February 22, 2007.


Jump to section
Related Articles
Cited By...
- Imaging of Chemotherapy-Induced Acute Cardiotoxicity with 18F-Labeled Lipophilic Cations
- Comparison of 18F-Labeled Fluoroalkylphosphonium Cations with 13N-NH3 for PET Myocardial Perfusion Imaging
- Evaluation of a Mitochondrial Voltage Sensor, (18F-Fluoropentyl)Triphenylphosphonium Cation, in a Rat Myocardial Infarction Model
- Stable Delineation of the Ischemic Area by the PET Perfusion Tracer 18F-Fluorobenzyl Triphenyl Phosphonium After Transient Coronary Occlusion
- 18F-Fluorobenzyl Triphenyl Phosphonium: A Noninvasive Sensor of Brown Adipose Tissue Thermogenesis
- Quantification of Myocardial Flow Reserve Using Positron Emission Imaging: The Journey to Clinical Use
- Cardiac Positron Emission Tomography
- Evaluation of the Novel Myocardial Perfusion Positron-Emission Tomography Tracer 18F-BMS-747158-02: Comparison to 13N-Ammonia and Validation With Microspheres in a Pig Model