


Abstract
PET and 18F-FDG have the potential to follow the early metabolic response to chemotherapy in patients with non–small cell lung cancer and to predict success or failure of the therapy. Methods: We studied 16 patients with non–small cell lung cancer as they followed 2 courses of docetaxel and carboplatin. Each patient was studied weekly for 7 wk, and tissue activity was assessed by the amount of radioactivity retained 90 min after the intravenous injection of 18F-FDG. In a prospective analysis, the linear least-squares method was used to evaluate the time course of metabolic activity in tumor and liver, bone marrow, and unaffected lung tissues; a metabolic response was defined as a response in which the slope of the regression was negative and significantly different from zero. Our hypothesis was that patients who exhibited a tumor metabolic response would survive longer than those who did not. In a retrospective examination of our data, we grouped our patients into those who survived <6 mo and those who survived longer and calculated the difference in the standardized uptake value (SUV) between day 7 and subsequent time points to determine the most appropriate timing of 2 PET studies in predicting response to therapy. Results: Fifteen of 16 patients completed the study. In the prospective study, 8 patients were classified as nonresponders as the slope of the regression of tumor SUV versus time was not different from zero; they all died within 35 wk of the end of their study. Seven patients were classified as responders; 5 survived and 2 died, one at 25 wk and the other at 76 wk. In the retrospective study, a decrease of 0.5 SUV between studies performed at 1 and 3 wk after the initiation of chemotherapy was predictive of those patients who survived >6 mo and in whom chemotherapy was presumably successful. Conclusion: Patients with non–small cell lung cancer who had a positive outcome, as exhibited by prolonged survival, were those who showed a tumor metabolic response assessed using weekly 18F-FDG PET studies. 18F-FDG PET studies performed at 1 and 3 wk after the initiation of chemotherapy allowed prediction of the response to therapy.
Lung cancer remains the leading cause of cancer death in the United States, with more than 186,000 new cases diagnosed and 167,000 deaths expected for 2006 (1). Most patients with non–small cell lung cancer (NSCLC) present late in the course of their illness with inoperable advanced stage III or stage IV disease (2,3). In early NSCLC, surgical resection remains the standard of care in fit patients, whereas in patients with unresectable stage III or stage IV disease who can tolerate the treatment, chemotherapy, or a combination of chemotherapy and radiation therapy, is the standard of care (4). No single chemotherapy regimen has been demonstrated to be superior to others. A symptomatic response is typically observed after only one course of chemotherapy (5), and further improvements in symptom relief, objective response rate, or quality of life are rarely accrued beyond 3 courses (6). Because not all patients with NSCLC respond favorably to chemotherapy, and because of the significant toxicity of the treatment, it is critical to identify those patients who are unlikely to obtain any meaningful advantage from the chemotherapy and to identify those who are the most likely to benefit from such therapy.
PET with the radiopharmaceutical 18F-FDG, complemented with CT, is widely used for the diagnosis and staging in patients with cancer (7). In addition, the technique plays an important role in the management of patients with the disease (8). 18F-FDG PET has been used, after chemotherapy or chemoradiotherapy, to evaluate whether the tumor should be resected (9,10) and for restaging after completion of therapy (11). The technique also has the potential to provide an accurate assessment of the early response to multicourse treatment, with the ultimate goal of identifying responding and nonresponding tumors and of tailoring therapy according to the information obtained.
Several 18F-FDG PET studies have looked at early response to chemotherapy in various neoplasms—lymphoma and Hodgkin's disease (12), gastric carcinoma (13), ovarian cancer (14), and breast cancer (15,16)—and to chemoradiotherapy in others—rectal carcinoma (17), esophageal carcinoma (18,19), and head and neck cancer (20). In all of these studies, significant differences in tracer uptake between nonresponding tumors and responding lesions were observed as early as after the first course of therapy and were closely correlated with the final outcome, the overall survival of the patient.
Few studies have looked at the early response to chemotherapy in patients with NSCLC. One study has addressed early changes in 18F-FDG PET uptake in 55 patients with stage IIIB–IV NSCLC treated with palliative chemotherapy. PET was performed 1 wk before and after a 21-d cycle of chemotherapy. Standardized uptake values (SUVs) normalized to patients' body weight were calculated from the mean activity concentration in the tumor regions of interest between 45 and 60 min after injection. A metabolic response by PET was prospectively defined as a decrease of >20% in the SUV from baseline (21). Reduction in metabolic activity was correlated with the final outcome of therapy according to response evaluation criteria in solid tumors (RECIST criteria) (22). In another study, 47 patients with stage IIIA-N2 NSCLC were imaged with 18F-FDG PET before induction chemotherapy and after 1 cycle and 3 cycles of platinum-based systemic therapy. Simple semiquantitative (SUV at 40−60 min after injection and corrected for body-surface area and plasma glucose) and complex (Patlak analysis; 10−60 min after injection) PET methods performed equally well and had added value over CT in monitoring the response to therapy (23).
In all of the studies published thus far, the response to chemotherapy has been assessed by evaluating the patients at 1 or, at most, 2 time points after the initiation of chemotherapy. The aim of our study was to assess the week-by-week metabolic response of the tumor, starting at the initiation of chemotherapy; this will not only further our understanding of early response but also lead to the development and validation of a useful tool to evaluate this response.
Our approach was to follow the time course of 18F-FDG metabolic activity of non–small cell lung tumors, weekly for 7 wk, during 2 courses of chemotherapy. To characterize this time course, we calculated the slope of the relation between time and tumor activity and tested the null hypothesis that this slope was not different from zero (P < 0.05). We predicted that those patients in whom the slope was negative and different from zero were responding successfully to the chemotherapy and, therefore, would exhibit increased overall survival, whereas those patients in whom the slope was either positive or not different from zero would not.
Recognizing that 7 18F-FDG PET/CT examinations would not be routinely available to all patients, we also examined our data to determine the most appropriate time for a single examination without undue loss in predictive power. Unfortunately, this analysis can only be done retrospectively as we have no a priori basis to suggest a criterion. For this analysis, we elected to divide our patients into those who survived <6 mo and those who survived longer.
MATERIALS AND METHODS
Sixteen patients (mean age, 67 y; range, 50–80 y) with inoperable NSCLC who had not received prior chemotherapy or radiotherapy were studied between May 2004 and December 2005. Tissue samples were reviewed by 3 pathologists who arrived at a consensus diagnosis. The histologic cancer types were squamous cell carcinoma in 6 patients; adenocarcinoma in 8 patients; large cell carcinoma in 1 patient; and poorly differentiated non–small cell carcinoma in 1 patient (Table 1). Each patient was studied immediately before initiation of chemotherapy and weekly for the next 6 weeks. All patients completed at least 2 cycles of chemotherapy, a cycle consisting of giving docetaxel (30 mg/m2) plus carboplatin (area under the curve, 5), followed 1 wk later by docetaxel (30 mg/m2) alone. The first PET/CT study (study 1) was performed just before the patient was given the first dose of docetaxel plus carboplatin. The subsequent PET/CT studies were performed as follows: day 7, PET/CT study 2 followed by administration of docetaxel; day 14, PET/CT study 3; day 21, PET/CT study 4 followed by administration of docetaxel plus carboplatin; day 28, PET/CT study 5 followed by administration of docetaxel; day 35, PET/CT study 6; day 42, PET/CT study 7 followed by administration of further chemotherapy (Fig. 1).
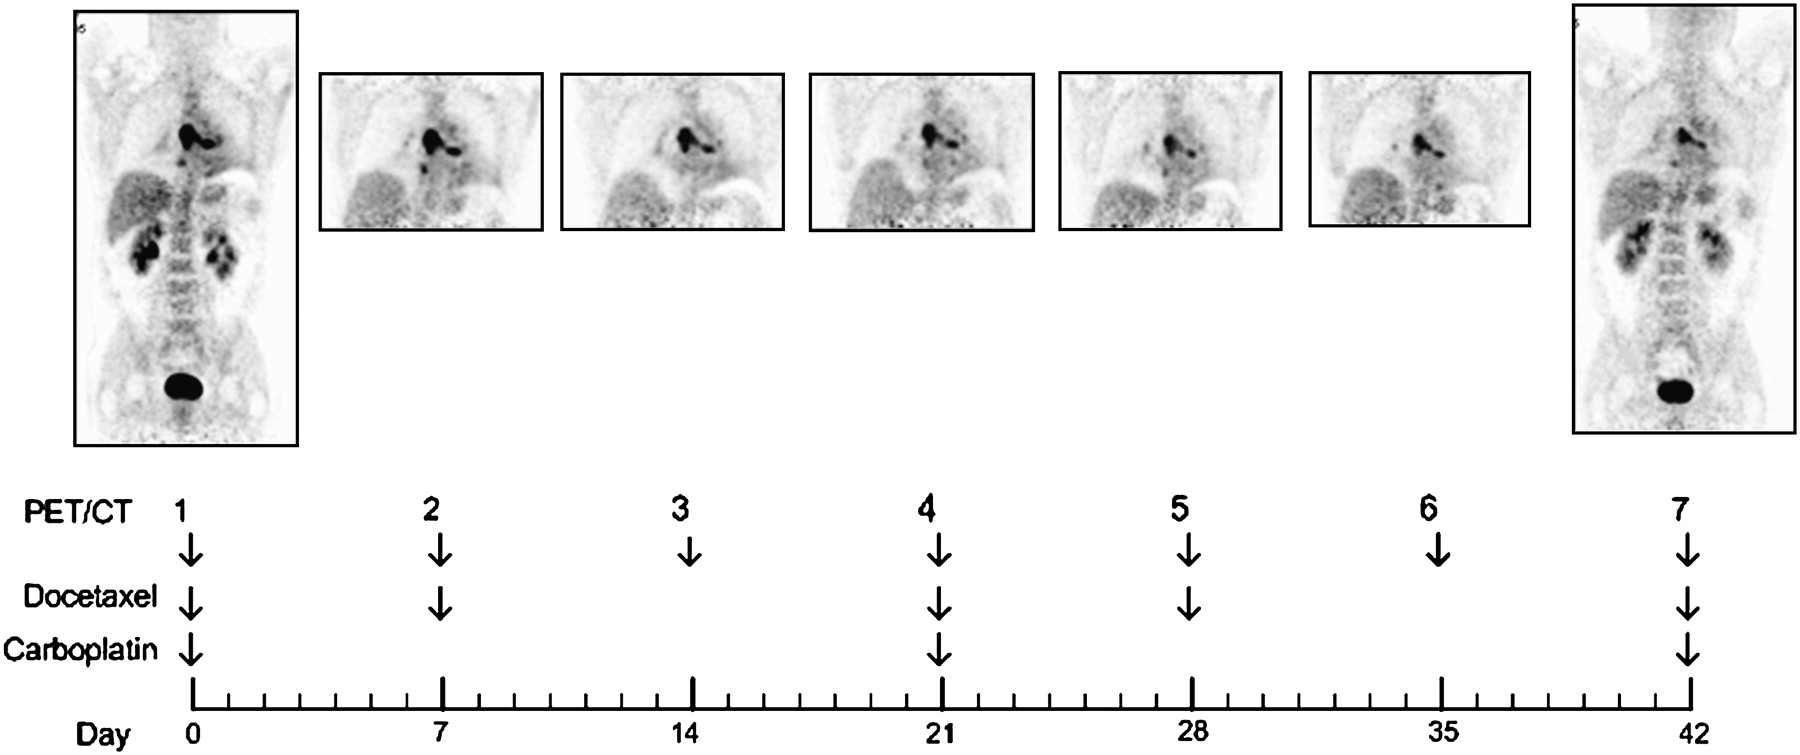
Timing of PET/CT examinations and medication administration.
Patient Characteristics
All patients were treated in the Cancer Institute at the University of Tennessee Medical Center. All patients were monitored for 2 y, or until death. The Institutional Review Board of the University of Tennessee Graduate School of Medicine approved the study protocol. A physician explained the details of the study to the patients, and written informed consent was obtained before enrolling the patient into the study.
18F-FDG PET/CT
Each patient was advised to fast for at least 6 h before the examination. Each was studied on a Biograph-16 (Siemens Medical Solutions USA, Inc.) 90 min after the intravenous injection of 400 ± 70 MBq of 18F-FDG (range, 300−600 MBq). The first and seventh PET/CT scans were diagnostic scans covering the area from chin to pelvis. These CT scans were obtained after the intravenous injection of contrast material and were performed using the following parameters: 120 kVp; 160 mA·s; 1-s tube rotation; 4-mm slice collimation; 5-mm reconstruction slice thickness; table feed of 8 mm per rotation. For the other 5 scans, the coverage was restricted to 300 mm (2 PET bed positions, covering the thoracic region) to minimize the radiation dose from the CT (Fig. 1). In these cases, no intravenous contrast was administered, and the following parameters were used: 120 kVp; 80 mAs; 1-s tube rotation; 4-mm slice collimation; 5-mm reconstruction slice thickness; table feed of 8 mm per rotation. PET data were acquired for 4 min at each bed position. After compensation for random coincidences and scattered radiation (24), and applying CT-based attenuation correction (25), PET images were reconstructed using an ordered-subset expectation maximization (OSEM) iterative algorithm (26,27) (4 iterations, 8 subsets) to a final image resolution of approximately 8-mm full width at half maximum.
Average SUVs, the ratio of activity retained in a tissue to the total activity injected into the patient, were obtained from volumes of interest drawn in the tumor(s), the liver, the bone marrow, and the unaffected lung and normalized to body weight. The variation in patient weight over the 7 measurements in the 15 patients included in the analysis was 2.1% (range, 0.3%−8.7%). The range of plasma glucose concentration was 75−306 mg/dL (mean, 107 mg/dL). Most of this variation was due to 1 patient (patient 11), whose mean plasma glucose concentration was 185 mg/dL, with a range of 124−306 mg/dL.
Volumes of interest were determined automatically over the primary tumor. First, a sphere of interest, adequately encompassing the tumor region, was specified. The extent and location of this 3-dimensional object were determined in the axial and coronal planes. The sphere was then searched automatically to flag each connected voxel above a set threshold; the threshold was set to 5 SUVs. The reproducibility of the placement of the volume of interest in successive studies in the same patient was ensured by the automated nature of the search algorithm.
For the liver, the bone marrow, and the lung, a sphere of interest was specified. For the bone marrow, the sphere was determined within the eighth thoracic vertebra. For the liver and the lung, the extent and location of the sphere were determined in the axial and coronal planes on the first study. The extent and location of these spheres were transferred to the subsequent studies using the anatomic information from the CT scan and the metabolic information from the PET scan to ensure proper placement.
All statistical tests were performed at the 5% level of significance.
Prospective Analysis
The linear regression of SUV against time was calculated using the linear least-squares method for each of the structures identified. The F statistic was used to test the null hypothesis that the SUV did not change over time. Metabolic nonresponders were defined, prospectively, as those patients in whom the significance level for the relation between tumor SUV and time did not reach significance (P > 0.05); metabolic responders would show a significant decline of tumor SUV with time (P < 0.05). Survival from the date of the end of the second cycle of chemotherapy was defined as the main endpoint. Survival rates of responder and nonresponder patients were estimated according to Kaplan–Meier.
Retrospective Analysis
For each patient, the difference in SUV between the study on day 7 and each of the 5 subsequent studies was calculated, and a t test used to compare the results from the responder and the nonresponder groups.
RESULTS
SUVs obtained from volumes of interest drawn in the tumor are given for all patients in Table 2. One patient, 80 y old, withdrew from the study after the initial scan and was not included in further analysis.
Mean Tumor SUV for Individual Patients
Prospective Analysis
Because there was no difference between the tumor retention at week 1 and at week 2 (paired t test; t14 = 0.0781; P = 0.939), we elected to fit the data from the 6 time points (weeks 2 through 7) after initiation of chemotherapy.
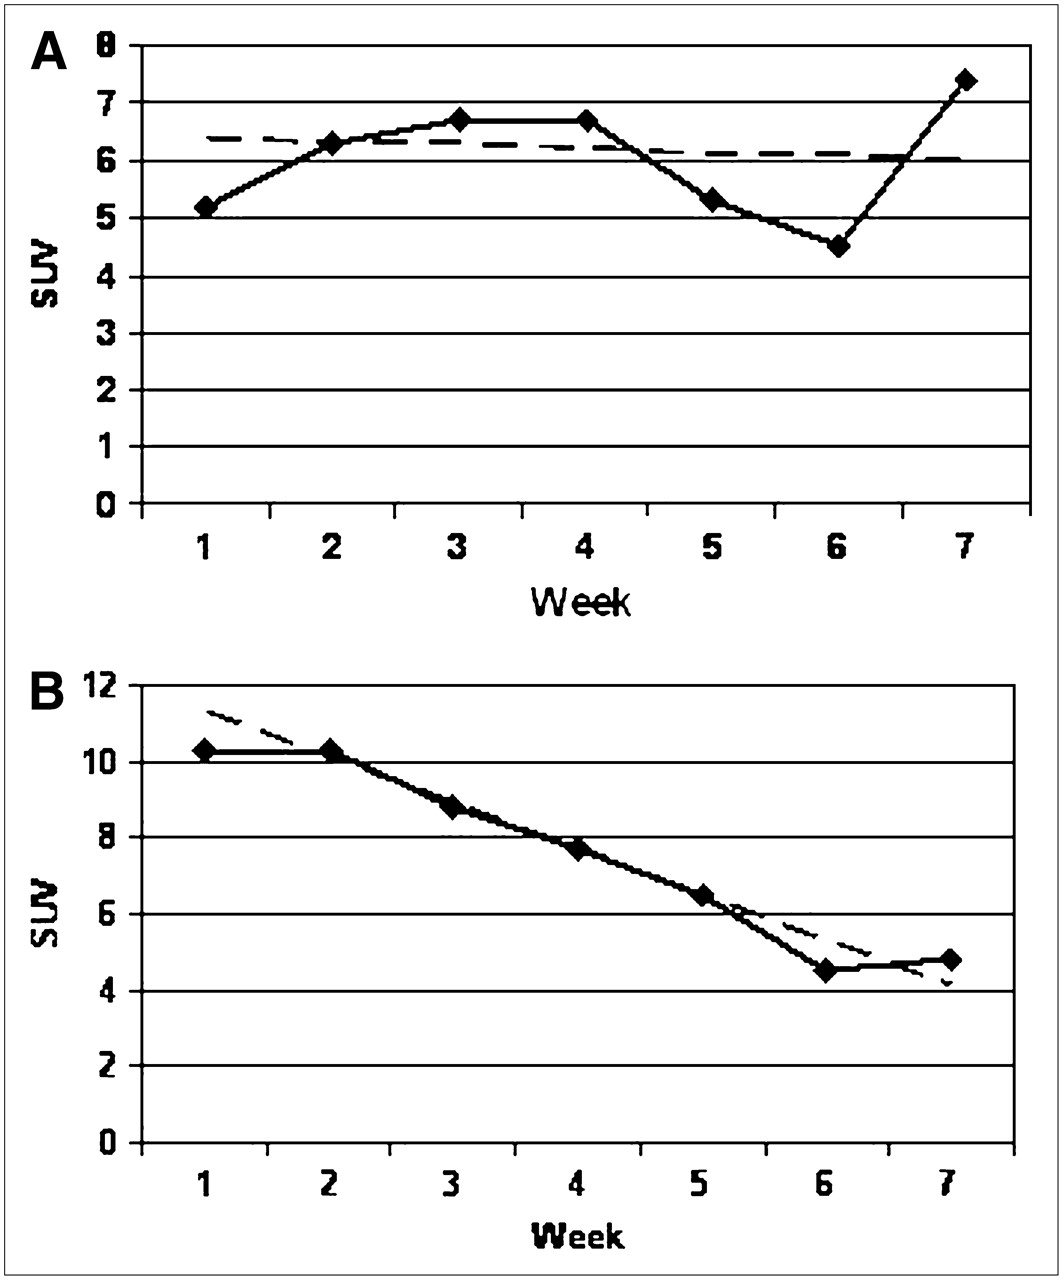
In 8 of the 15 patients, the slope of the regression through the tumor data points was not different from zero, indicating little change in tumor activity over the course of the treatment (Fig. 2A). In this group, the mean slope was −0.053 SUV/wk (range, −0.770 to 0.337 SUV/wk). The mean age of the group was 67 y (range, 50−79 y). All 8 patients died; the median survival was 20 wk (range, 8−35 wk). In the remaining 7 cases, the slope of the regression was negative, suggesting a decrease in tumor activity (Fig. 2B). In this group, the mean slope was −0.732 SUV/wk (range, −1.260 to −0.151 SUV/wk). The mean age of the group was 66 y (range, 58−70 y). Of these 7 patients, 5 survived and 2 died (at 25 and 76 wk) (Table 3; Fig. 3).

Illustrative examples of least-squares fit (dashed line) to experimental data (diamonds). (A) Slope of regression line is not significantly different from zero (P = 0.799). Patient (patient 6) survived only 8 wk after end of chemotherapy. (B) Slope of regression line is significantly different from zero (P < 0.001). Patient (patient 3) is still alive, 20 mo after end of study.

Slopes of regression line through SUVs for lung, bone marrow, liver, and tumor. Each symbol represents slope of line of best fit through 6 data points for unaffected lung, liver, or tumor. Open circles represent slopes that were not significantly different from zero; asterisks represent slopes different from zero at least at 5% level. Note that significance depends on both magnitude of slope and spread of underlying data; thus, open circles and asterisks may overlap. NS = not significant.
Slopes of Regression Line Through SUVs for Lung, Bone Marrow, Liver, and Tumor
In contrast, in presumed healthy lung, liver or bone marrow none of the regression slopes through the data points was different from zero, indicating no global change in activity throughout the course of chemotherapy. The mean slope was 0.006 SUV/wk (range, −0.033 to 0.040) in the lung, −0.001 SUV/wk (range, −0.117 to 0.147) in the bone marrow, and 0.022 SUV/wk (range, −0.080 to 0.151) in the liver (Table 3; Fig. 3).
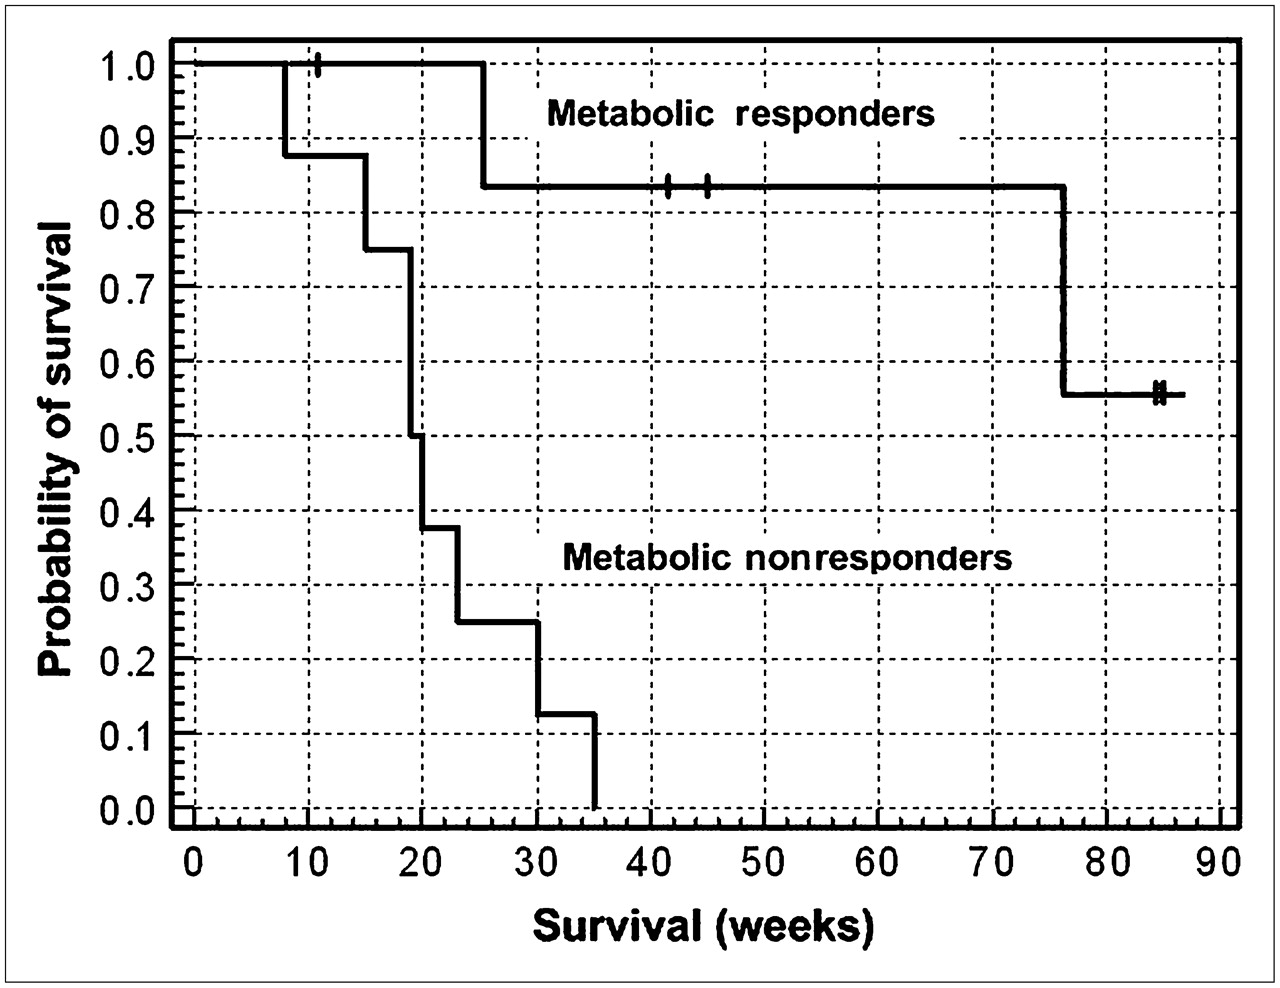
Median follow-up was 25 wk (range, 11−87 wk) for all patients. Figure 4 shows a Kaplan–Meier survival plot for the 2 groups of patients. In patients without a metabolic response during the first 2 courses of chemotherapy, median survival was 20 wk, whereas median survival has not been reached in patients with a metabolic response (difference in survival between the 2 groups significant at P = 0.0016).

Kaplan–Meier survival plot. Metabolic responders were defined as those patients for whom the slope through tumor data points was negative and significantly different from zero; metabolic nonresponders were defined as those patients for whom the slope was either positive or not significantly different from zero. Tick marks represent censored events—that is, survival time of those patients who have not yet reached the endpoint defined as death.
Retrospective Analysis
Seven patients died within 6 mo of the end of their study (mean, 18 wk; range, 8−25 wk); these patients were classified as nonresponders. Four other patients survived between 30 and 76 wk (mean, 47 wk), and the other patients have been monitored up to a maximum of 20 mo; these 8 patients were classified as responders. For all of the patients who died, death was attributed to cancer-related complications.
There was no statistically significant difference between the SUVs obtained on day 1 and on day 7 either in the overall group (paired t test; t14 = 0.0781; P = 0.939) or when the responders (t8 = −1.163; P = 0.282) and nonresponders (t7 = 1.616; P = 0.157) were considered separately. For this reason, all subsequent analyses were performed using the study on day 7 as reference.
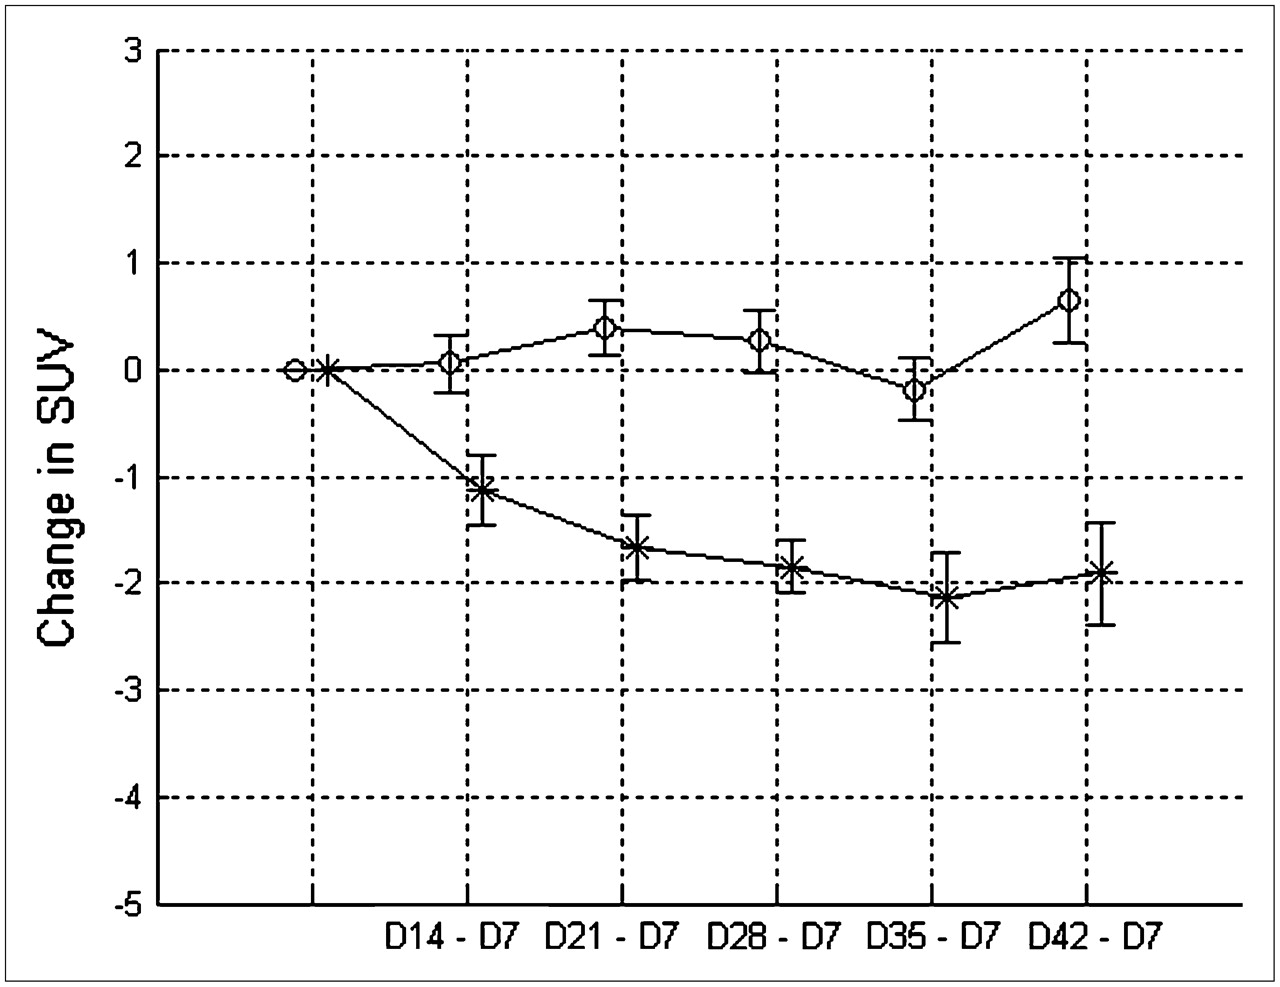
The mean differences between tumor SUV measured on day 7 and tumor SUV at later time points for the nonresponder and the responder groups are given in Table 4 and are plotted in Figure 5. The comparison between the 2 groups, using an unpaired t test, is also given in Table 4. Because the earliest time at which a significant difference was observed was between days 21 and 7, these differences are plotted for all patients in Figure 6. Selecting as a threshold a decrease of 0.5 SUV between days 21 and 7 identifies correctly all of the patients who have survived >6 mo and misclassifies 1 nonresponder (difference in SUV for this patient was −0.7). This 0.5 SUV threshold corresponds to an approximate decrease of 10% compared with the baseline study on day 7; the conclusion is virtually identical when expressed in terms of percentage change instead of absolute change. Using this threshold, the sensitivity of the test in identifying nonresponders is 0.86 and the positive predictive value is 1.

Mean SUVs ± SEM are plotted for responder (asterisks) and nonresponder (open circles) groups. D = day.
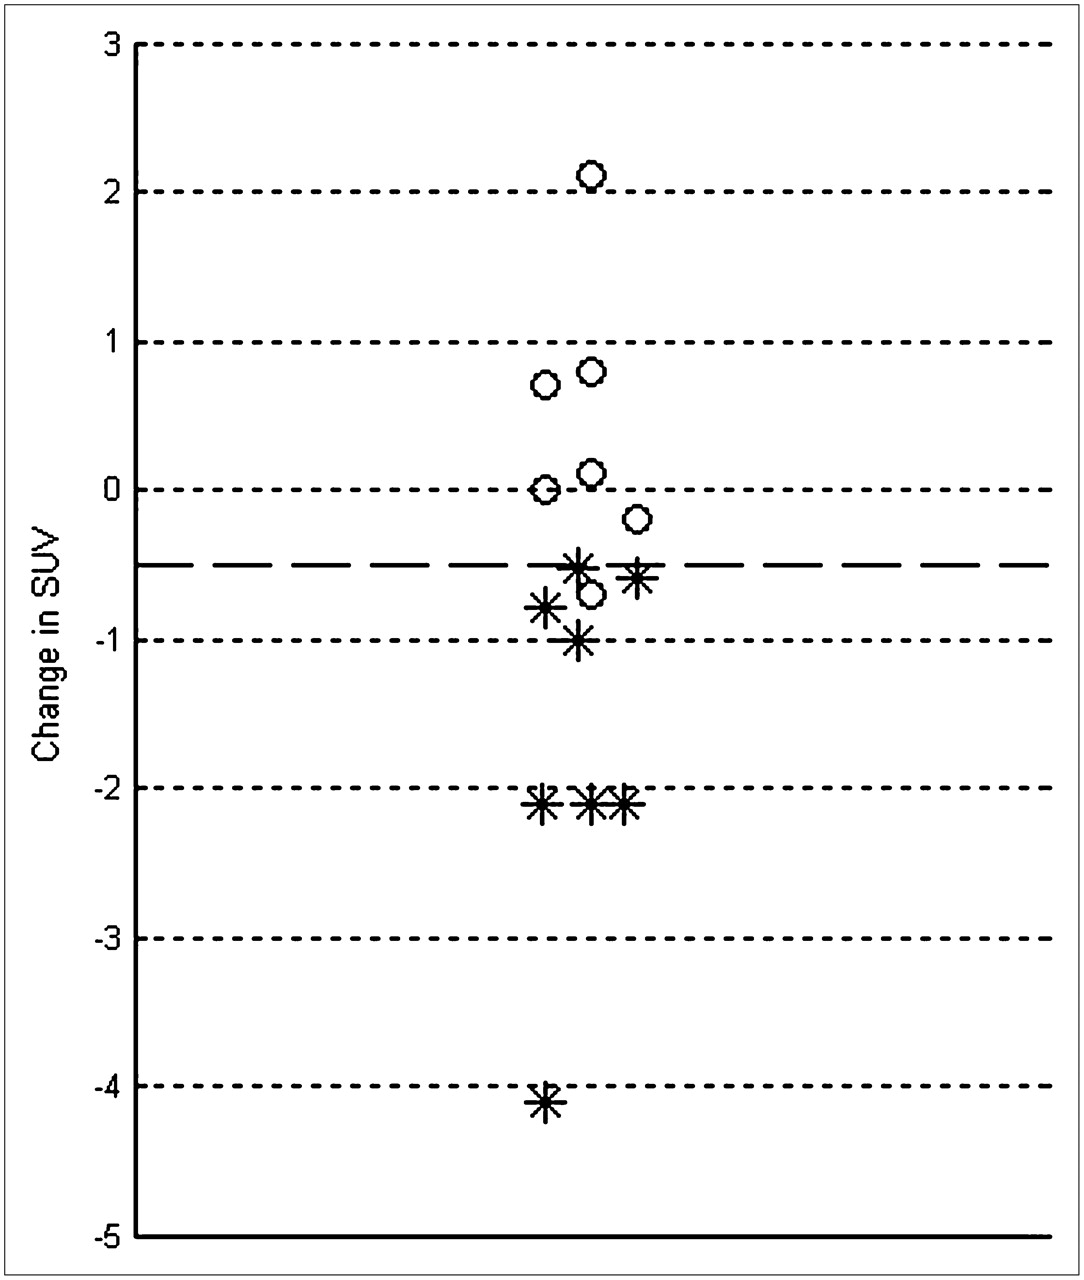
Change in SUV between days 21 and 7 for all patients. Asterisks represent those who survived >6 mo; open circles represent those who survived <6 mo. Dashed line represents a change of −0.5 SUV.
Mean Difference in SUV ± SD for Responder and Nonresponder Groups
DISCUSSION
Most patients with NSCLC present late in the course of their disease with inoperable advanced stage III or stage IV disease; therefore, many are candidates for palliative chemotherapy. The natural history of advanced NSCLC remains particularly poor, with a median survival of 4–6 mo. In a review of 10 randomized clinical trials, the median survival time for treated patients was 6.5 mo (range, 4.7−8.5 mo), whereas the median survival time of patients receiving the best supportive care was 3.6 mo (range, 2.4−4.9 mo) (4). Many of the chemotherapeutic agents cause significant toxicity, such as anemia, nausea and vomiting, and renal toxicity (28). Over the last 10 y newer agents have emerged that have provided slightly better median and 1-y survival, 7–10 mo, with 35%–40% alive at 1 y (3). Although platinum-based combination therapy represents the current standard of care (29), these platinum-based regimens are usually accompanied with higher toxicity (30). From a cost-effectiveness perspective, as well as from a quality-of-life perspective, it is therefore important for patients to determine, early in the course of their treatment, whether their disease is responding to therapy.
In this study, we followed the week-by-week changes in metabolic activity of non–small cell lung tumors during 2 courses of chemotherapy. We also documented the changes in metabolic activity occurring in the liver, bone marrow, and unaffected lung. As a marker for the metabolic rate for glucose, we used SUVs normalized to the patient's body weight, without correction for plasma glucose concentration.
We characterized the time course of metabolic activity by calculating the slope of the relation between time and tissue activity and tested the null hypothesis that this slope was not different from zero. We defined prospectively a metabolic response as one in which the slope was negative and significantly different from zero at least at the 5% level. Our results show that there are no significant changes in unaffected tissue metabolism during the 2 courses of chemotherapy (Fig. 3), possibly reflecting a lack of toxicity of the anticancer agents in these tissues over the short period of our study.
In contrast, we have demonstrated that the patients could be divided into 2 groups depending on whether the metabolic activity of the tumor did not change over the same time period or showed a steady decline in activity (Fig. 2). All patients who showed no statistically significant decrease in tumor activity died within 35 wk of the end of chemotherapy, whereas 5 of 7 patients that showed a significant decrease survived.
It is unlikely that 7 18F-FDG PET examinations, as performed in this study, would be available to all patients. From our retrospective analysis, the earliest time interval for 2 examinations is 1 and 3 wk after the initiation of chemotherapy. Our results agree well with other studies showing that response to chemotherapy can be assessed and is, in fact, best assessed after the completion of one cycle of chemotherapy (21), thus identifying those patients for whom therapy is of limited benefit. In addition, we find that for those patients with a favorable response to chemotherapy, this response is greatest at 3 or 4 wk after its initiation. Beyond 4 wk, our study suggests that the favorable response may not be sustained in all patients.
It is interesting to note that in a study of primary breast tumors that ultimately achieved a complete macroscopic pathologic response, a significant reduction in the mean dose uptake ratio was observed after the first (t = 3.24; P = 0.003), fourth (t = 2.12; P = 0.014), and eighth (t = 2.32; P = 0.031) pulses of chemotherapy when compared with the dose uptake ratio measured in less-responsive tumors (15). Each pulse lasted 21 d. This pattern of significant change observed soon after the initiation of therapy, and becoming less significant with increasing numbers of cycles, is similar to the one we report here. These observations suggest that responses are achieved after one course of chemotherapy and that response is less predictable with further chemotherapy cycles. Nevertheless, an initial response is a good indicator of prolonged survival. In addition, in agreement with the results presented here, these authors concluded that a 10% reduction in dose uptake ratio was an effective criterion for predicting the overall pathologic response of the lesion after a single pulse of chemotherapy.
Clinically, it has been suggested that the duration of first-line therapy in these patients should be brief, consisting of 3 or 4 cycles or fewer if there are signs of progressive disease (4). In a trial of a cisplatin-based regimen, 61% of patients had a symptomatic response after only one course of chemotherapy (21 d) and 96% after 2 courses (5). In another trial of a similar cisplatin-based regimen, no significant clinical benefit was accrued beyond 3 courses in terms of symptom relief, objective response rate, survival, or quality of life (6). Several studies have shown that, if quality of life is to improve, it does so in most patients after 2 courses of chemotherapy and worsens after prolongation of treatment (31). These observations may help explain our results that consistent response rates can be obtained as early as after one course of chemotherapy and that the therapeutic effect of the chemotherapy may decrease progressively with additional courses.
All of the patients we studied went on to further cycles of chemotherapy or chemoradiotherapy (Table 1), and some developed metastases. Thus, an interesting observation from our study is that once a patient showed a metabolic response to the chemotherapy, their survival was significantly longer than those patients who did not respond, irrespective of subsequent treatment or disease progression (Fig. 4).
CONCLUSION
Our study demonstrates that patients who respond to chemotherapy can be identified early in the course of their treatment, and these patients will generally exhibit prolonged overall survival. Although we studied a relatively small number of patients and our results should be interpreted with caution, it is clear that a repeat 18F-FDG PET study at the end of the first cycle of chemotherapy would allow identification of those patients in whom the therapy was futile. The ability to provide an early indication of therapeutic response has the potential to improve patient care by identifying those patients who do not benefit from their current treatment and, therefore, would benefit from either stopping the treatment and the associated side effects or going on to a different, and hopefully more adequate, therapeutic approach.
Acknowledgments
We acknowledge the Department of Pathology at the University of Tennessee Medical Center and the pathologists who reviewed and validated the histopathologic diagnosis. We recognize the contribution of Dr. Jeffrey T. Yap, now at the Dana-Farber Cancer Institute, Boston, MA, in the initial stages of this study. This study has been presented, in part, at the 53rd Annual Meeting of the Society of Nuclear Medicine, June 3–7, 2006, San Diego, CA, and, in part, at the World Congress of Nuclear Medicine and Biology, October 22–27, 2006, Seoul, Korea.
Footnotes
-
COPYRIGHT © 2007 by the Society of Nuclear Medicine, Inc.
References
- Received for publication November 30, 2006.
- Accepted for publication January 25, 2007.


Jump to section
Related Articles
Cited By...
- Hot Spot Imaging in Cardiovascular Diseases: An Information Statement from SNMMI, ASNC, and EANM
- A Simple Method to Optimize the Effectiveness of Chemotherapy: Modulation of Glucose Intake During Chemotherapy
- 18F-FDG PET/CT of Non-Small Cell Lung Carcinoma Under Neoadjuvant Chemotherapy: Background-Based Adaptive-Volume Metrics Outperform TLG and MTV in Predicting Histopathologic Response
- Value of Metabolic Tumor Volume on Repeated 18F-FDG PET/CT for Early Prediction of Survival in Locally Advanced Non-Small Cell Lung Cancer Treated with Concurrent Chemoradiotherapy
- 18F-FDG PET Early Response Evaluation of Locally Advanced Non-Small Cell Lung Cancer Treated with Concomitant Chemoradiotherapy
- Imaging the inflammatory activity of sarcoidosis
- Response Assessment Using 18F-FDG PET Early in the Course of Radiotherapy Correlates with Survival in Advanced-Stage Non-Small Cell Lung Cancer
- Surrogate markers predicting overall survival for lung cancer: ELCWP recommendations
- Survival and Death Signals Can Predict Tumor Response to Therapy After Oncogene Inactivation
- FDG-PET as a Potential Tool for Selecting Patients with Advanced Non-Small Cell Lung Cancer Who May Be Spared Maintenance Therapy after First-Line Chemotherapy
- Role of 18F-FDG PET in Assessment of Response in Non-Small Cell Lung Cancer
- In Reply
- Standardization of Scanning for [18F]Fluorodeoxyglucose Positron Emission Tomography
- Imaging Surrogates of Tumor Response to Therapy: Anatomic and Functional Biomarkers
- Reproducibility of Standardized Uptake Value Measurements Determined by 18F-FDG PET in Malignant Tumors
- New Technologies for Human Cancer Imaging