


Abstract
Characterization of a pulmonary lesion is a well-established indication for metabolic imaging with 18F-FDG. There is extensive literature on the use of PET and CT in the characterization of a solitary pulmonary nodule (SPN). The performance of dual-modality imaging with PET/CT for characterizing SPNs was investigated in a clinical referral setting. Methods: We performed a retrospective study involving patients referred for SPN characterization with PET/CT between September 2002 and June 2004, for whom a pathologic diagnosis was available. The group consisted of 12 men and 30 women whose age ranged from 35 to 84 y (mean age ± SD, 67 ± 11 y). A dual-slice CT/lutetium oxyorthosilicate PET system was used for imaging. CT images were acquired without intravenous contrast. Blinded interpretation was performed by 1 chest radiologist for CT and 2 nuclear medicine physicians for PET. PET/CT images were read in consensus. Lesions were analyzed by location, texture, axial dimension, and metabolic activity and visually scored on a 5-point scale from benign to malignant; the maximum standardized uptake value (SUVmax) was measured. Results: Lesion diameter varied from 7 to 30 mm (mean ± SD, 15 ± 6 mm). The SUVmax ranged from 0.5 to 17.2 (mean ± SD, 3.0 ± 3.0). SUVmax corrected for lean body mass was 0.4–12.1 (mean ± SD, 2.1 ± 2.0). Comparison of CT versus PET versus PET/CT yielded accuracies of 74%, 74%, and 93%, respectively. PET and CT correctly characterized 31 and PET/CT correctly characterized 39 of the 42 lesions as malignant or benign. The sensitivity and specificity for CT, PET, and PET/CT was 93%/31%, 69%/85%, and 97%/85%, respectively. There were significant differences (P < 0.05) between PET/CT and PET for accuracy, sensitivity, and specificity. Accuracy did not improve by quantitative analysis using an SUVmax cutoff of 2.0 for malignancy. Lean body mass correction of the SUVmax did not change accuracy. Conclusion: PET/CT demonstrates an excellent performance in classifying SPNs as benign or malignant. The combination of anatomic and metabolic imaging is synergistic by maintaining the sensitivity of CT and the specificity of PET, resulting in an overall significantly improved accuracy. Visual interpretation is sufficient for characterizing an SPN. Quantitative analysis does not improve accuracy of PET/CT for SPN characterization.
A solitary pulmonary nodule (SPN) is a single, well-defined pulmonary opacity with a diameter of <3 cm surrounded by normal lung tissue that is not associated with atelectasis or adenopathy (1,2). More than 150,000 SPNs are detected per year in the United States alone, of which 30%–50% turn out to be malignant (2–4).
Noninvasive evaluation of SPNs is usually done by chest radiography, CT, MRI, PET, and SPECT (5–8). Invasive procedures to allow histologic evaluation of SPNs include fiber-optic bronchoscopy, transthoracic needle-aspiration biopsy, video-assisted thoracoscopy, video-assisted thorascopic surgery, or thoracotomy, all of which are associated with considerable costs and morbidity. Surgery has a reported mortality of 0.5% (exploratory) to 4% (curative) (9).
CT provides anatomic and morphologic information. In addition, CT can confirm whether a lesion is truly solitary and can suggest the likelihood of malignancy. Computer-aided diagnosis may further enhance the performance of CT (10). Lesions are usually considered benign if they meet the following criteria: central, concentric calcifications, round, or no nodule growth by CT after 2 y of observation (11,12). Malignant features of a nodule typically include nondemarcated borders, eccentric appearance, spiculated pattern, and a doubling time of <10 mo.
PET with 18F-FDG is used to evaluate glucose metabolism in tumors. Because of increased metabolism, malignant tissues typically demonstrate higher 18F-FDG uptake than benign lesions and normal tissue. The utility of PET for the characterization of SPNs has been reported in a large number of publications. A metaanalysis by Gould et al. (13) has confirmed that PET using 18F-FDG is an accurate, noninvasive method for diagnosing SPNs, with an overall sensitivity of 96.8% and a specificity of 77.8%. The performance of dual-modality imaging with PET/CT for the evaluation of SPNs has not been investigated to date. The goal of this study was to assess the accuracy of PET/CT in the diagnosis and characterization of SPNs compared with PET and CT alone.
MATERIALS AND METHODS
Population
Individuals with a solitary lung lesion smaller than 30 mm in axial diameter who had a PET/CT examination between September 2002 and June 2004 were included in this retrospective study. Patients with multiple nodules, positive adenopathy in the mediastinum, recent history of malignancy, or a known history of lung cancer were excluded. Only patients with pathologic confirmation—that is, biopsy or surgical resection of the nodule—were selected. This study was approved by the Institutional Review Board of the University of California, Los Angeles (UCLA), and given exempt status from the informed consent requirement.
Forty-two patients (12 men, 30 women; age range, 35–84 y; mean age ± SD, 67 ± 11 y) met the criteria and were included for further analysis. The mean nodule diameter ± SD was 15 ± 6 mm (range, 7–30 mm) by CT. Nine lesions were <10 mm in axial diameter. Of the lesions, 57% were found in the upper lobes, with 26% in the right upper lobe and 31% in the left upper lobe, whereas 43% were found in the lower lobes, with 19% in the left lower lobe and 24% in the right lower lobe.
None of the patients had diabetes mellitus. Serum glucose levels were measured by finger stick, but only 35 values were recorded and available in the charts. The serum glucose levels varied from 75 to 116 with a mean of 94 mg/dL.
PET/CT Image Acquisition
Patients were imaged using a whole-body PET/CT scanner (Siemens/CTI Reveal). The CT was a dual-slice system. CT images of diagnostic quality were acquired—that is, 130 kVp, 130 mA·s, 1-s rotation, 4-mm collimation, 8-mm bed feed. No intravenous contrast enhancement was used. The PET system was a lutetium oxyorthosilicate detector, 3-dimensional system. PET images were obtained 60 min after intravenous injection of 7.5 MBq/kg (0.2 mCi/kg) of 18F-FDG. The acquisition time was weight dependent and lasted 2–4 min per bed position as described (14). Multiple bed positions were acquired from approximately the patients' middle thighs to the base of the skull. CT-based attenuation correction was applied. PET and CT images were acquired during shallow breathing.
CT Image Interpretation
The interpretation of CT scans was performed by a thoracic radiologist who was unaware of each patient's history and PET image findings (J.G.). Each nodule was characterized in terms of its attenuation, shape, and margin characteristics using previously well-described criteria developed by the American College of Radiology Imaging Network for its lung cancer screening trials (15,16). For attenuation, the nodule was assessed as being soft tissue, ground glass, mixed ground glass and soft tissue, fluid water, fat, or calcified. If calcified, the amount and position of calcification were described. For shape, the lesion was described as being round, oval, or lobulated. The margin was characterized as being smooth, spiculated, or poorly defined. Finally, the perpendicular longest axial dimensions of the lesion were measured to the nearest millimeter. On the basis of integration of these characteristics (attenuation, shape, margin, and size) the reader then ascribed a 5-point likart scale that was believed to best represent the likelihood of the lesion being malignant. SPNs were scored as follows: 1, not suspicious for malignancy (e.g., soft tissue, round, well-defined margins, calcified, <10 mm); 2, low suspicion; 3, intermediate suspicion (e.g., mixed or soft-tissue attenuation, noncalcified, smooth margins, >10 mm); 4, moderately high suspicion; and 5, high suspicion (e.g., mixed attenuation, lobulated, spiculated, poorly defined, >10 mm). SPNs with a CT score of 1, 2, or 3 were considered benign and 4 or 5 were considered malignant.
PET Image Interpretation
PET images were interpreted by 2 nuclear medicine physicians who were unaware of the patient's history and anatomic imaging results (M.A., C.S.). The location of areas of abnormal tracer uptake were recorded and the degree of uptake was scored using a 5-point scale: 0, no uptake; 1, less than mediastinum; 2, equal to mediastinum; 3, between mediastinum and liver; and 4, higher than liver. Lesions with an uptake of 0 or 1 were considered benign and an uptake of 2, 3, or 4 was considered malignant. In addition, a region of interest was placed around areas of abnormal uptake and the maximum standardized uptake value (SUVmax) was determined and analyzed separately.
PET/CT Image Interpretation
Lesion size, location, and type were verified. Images were interpreted as benign or malignant by consensus. In case of concordance between CT and PET interpretation, the PET/CT classification did not differ from the CT and PET findings. If PET and CT ratings were discordant as to lesion type, the PET, CT, and fusion images were jointly reviewed. The PET/CT interpretation could be described with the following rules: If the CT score was 5 (high suspicion), then the lesion was considered malignant, regardless of the 18F-FDG uptake (Fig. 1). If the PET score was 2, 3, or 4 (moderate uptake to uptake greater than the liver), then the lesion was considered malignant—that is, the PET findings overruled the CT findings (Fig. 1). All but 2 lesions could be classified as either malignant or benign by applying these rules. The remaining 2 lesions, both with a CT score of 4 and PET score of 1, were reexamined and by consensus the PET/CT was read as benign in 1 case and malignant in the other based on the appearance of the fused images.

PET/CT decision scheme when PET and CT readings were discordant.
Pathology
Of the 42 lesions, 50% were confirmed by biopsy and the remaining 50% were confirmed by resection specimens within 34 d of the PET/CT. Twenty-nine (69%) of the 42 lesions were malignant, which included 27 primary carcinomas—that is, adenocarcinoma (n = 12), squamous cell carcinoma (n = 3), neuroendocrine tumor (n = 5), bronchioloalveolar carcinoma (BAC, n = 3), and non–small cell lung carcinoma (NSCLC, n = 4). Two malignant lesions were of metastatic origin, from a renal cell cancer and a parotid cancer. The remaining 13 lesions (31%) were benign and included inflammation or infection (n = 6), granuloma (n = 5), and hamartoma (n = 2) (Table 1).
Pathology of Lesions (n = 42)
CT, PET, and PET/CT in Characterization of SPNs (n = 42)
Results of CT and PET on Lesions <10 mm (n = 9) and >10 mm (n = 33)
SUV Mean and Range for 18F-FDG PET-Positive Lesions Without and With Corrections
Statistical Analysis
The Student t test was used to compare parameters between subgroups. Results are presented as the mean ± 1 SD. Linear regression analyses were used to study the correlation between subgroups and between parameters. The 95% confidence intervals were calculated for accuracy, sensitivity, specificity, and so forth to evaluate statistically significant differences. A receiver-operating-characteristic (ROC) analysis was performed on the PET/CT and PET interpretations and the SPN uptake in SUV. Differences in the area under the curve (AUC) were tested with the χ2 statistic.
RESULTS
CT
Using pathology as the reference standard, CT had a sensitivity of 93% and a specificity of 31% for all 42 nodules (Table 2). For nodules <10 mm in diameter (n = 9), CT had a sensitivity and a specificity of 100% and 20%, respectively. For nodules with the largest axial dimension >10 mm (n = 33), CT had a sensitivity and a specificity of 92% and 38%, respectively (Table 3). There were 2 false-negative CT findings that were defined by pathology as adenocarcinoma. False-positive CT results included 4 granulomas, 1 pneumonia/emphysema, 3 lesions with inflammation/infection, and 1 hamartoma.
PET
Although PET had the same overall accuracy as CT (74%), the sensitivity and specificity were 69% and 85%, respectively (Table 2). For nodules <10 mm in diameter, PET had a sensitivity and specificity of 50% and 100%, whereas the remaining nodules were detected with a sensitivity of 72% and a specificity of 75% (Table 3). The 9 false-negative findings included adenocarcinoma (n = 7), neuroendocrine carcinoma (n = 1), and BAC (n = 1). The average size of these 9 lesions on CT was 13 mm (range, 9–21 mm). There were 2 false-positive findings related to inflammatory conditions: 1 granuloma and 1 anthracosis with inflammation.
By semiquantitative analysis, the SUVmax for all positive PET lesions (n = 31) averaged at 3.0 ± 3.0 (range, 0.5–17.2) (Table 4). When using a cutoff of 2.0 for malignancy, SUV analysis yielded the same results as visual analysis for PET/CT. Correction for lean body mass (according to the formula published by Zasadny and Wahl (17)) did not improve accuracy but, rather, changed 1 true-positive result into a false-negative one. The corrected SUVmax was on average 2.1 ± 2.0 (range, 0.4–12.1). In the true-positive PET subgroup, the lesion size ranged from 8.5 to 29.5 mm, with a mean SUVmax of 3.8 (Table 4).
Dual-Modality Imaging
PET/CT had the highest accuracy, 93% (P < 0.05 for both CT and PET), with a sensitivity of 97% (P = not significant for CT, and P < 0.05 for PET) and a specificity of 85% (P < 0.05 for both CT and PET). There was 1 false-negative PET/CT result, an adenocarcinoma of 12 mm, in an area with emphysematous changes. PET/CT had 8 discordant interpretations compared with PET alone, all of which were true-positive. PET-only interpretations missed 4 lesions because there was no visible uptake. Of the other 4 lesions, 3 had low 18F-FDG uptake (SUVs of 1.2, 1.3, and 1.2), whereas the fourth had an SUV of 2.4 but was visually scored as 1 (benign, Fig. 1).
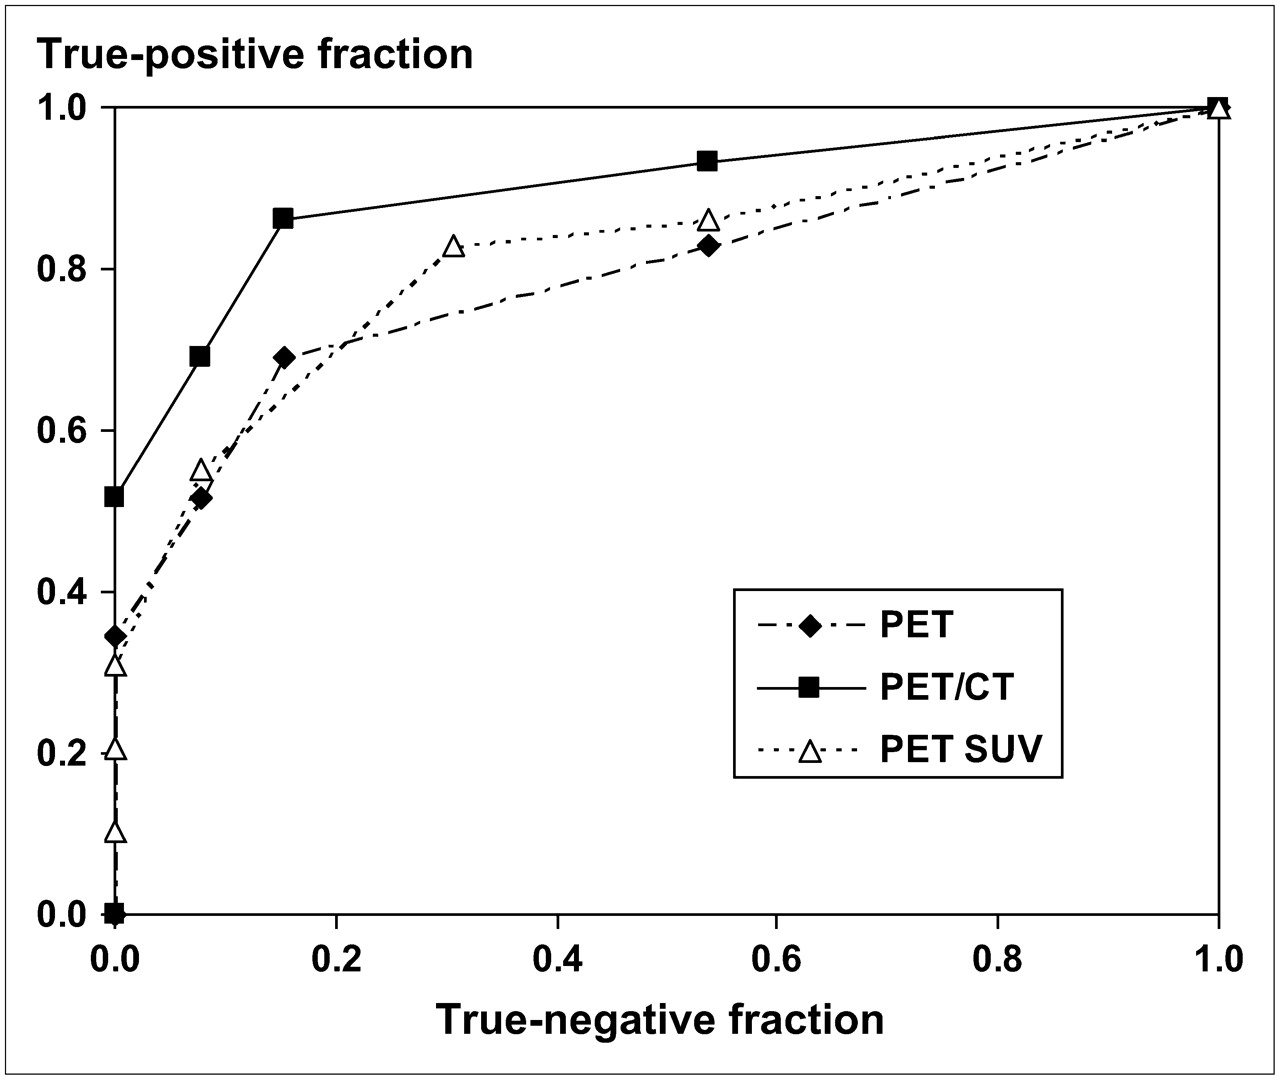
An ROC analysis was performed for PET and PET/CT, which is shown in Figure 2. The top 2 curves were based on the consensus interpretation. The additional value of PET/CT over PET-alone is clearly seen and appears to hold over the entire range of sensitivity and specificity. In addition, the SUVmax of each SPN was used to classify the lesions—that is, an analysis based only on PET uptake measurements. Cutoff levels for malignancy were set at 1, 2, 3, 4, and 5 SUVs and the ROC calculated. This curve is labeled PET SUV in Figure 2 and shows the optimal tradeoff between sensitivity and specificity for PET to be at cutoff points 3 and 4, corresponding to an SUVmax between 2 and 3. In addition, this ROC illustrates that visual interpretation of PET is similar to quantitative analysis by SUV.

ROC. Top curve represents PET/CT (▪). The 5-point PET/CT scale was created by applying the rules of Figure 1 to CT and PET scores and consensus reading as described in the text. PET curve (♦) is based on consensus interpretation. PET SUV curve (▵) is based on maximum uptake in the SPN with cutoff levels of 1, 2, 3, 4, and 5 for the SUV. AUC was 0.90 for PET/CT, 0.82 for PET SUV, and 0.79 for PET.
DISCUSSION
This study demonstrates the high accuracy of dual-modality imaging with PET/CT for the characterization of SPNs. Small lung nodules tend to be overdiagnosed on CT alone and to have a high resection rate (18). Hickeson et al. recognized that the most frequent limitation of 18F-FDG PET involves detecting small lesions and lesions with low metabolism (19). However, 18F-FDG PET has been found to be useful in characterizing SPNs ≤ 10 mm in a study from The Netherlands (20). In our study, the 9 nodules with a diameter of <1 cm were detected by PET with a specificity of 100% but with a sensitivity of only 50%. Conversely, CT had a sensitivity of 100% but a much lower specificity of 20% (Table 3). Upon consensus, PET/CT was found to have 100% sensitivity and 100% specificity for small lesions in our sample of 9 patients. There were 4 true-positive findings (2 NSCLC, 1 adenocarcinoma, 1 neuroendocrine cancer) and 5 true-negative findings (1 granuloma, 2 pneumonia, 2 inflammation).
In this study, the final interpretation of PET/CT results was dichotomized, and only benign or malignant was used as classification of the SPN. “Equivocal” scores—that is, 3 on CT and 2 on PET—were categorized on the basis of the decision rules (Fig. 1, if discordant). In particular, CT is affected by this type of analysis because the so-called indeterminate nodule with an equivocal interpretation is not considered (5). In addition, ground-glass opacifications are generally interpreted as malignant in this scheme. As is shown in Table 2, dual-modality imaging with PET/CT seems to overcome many of the equivocal findings. The PET/CT results were a consensus interpretation. The scores obtained from the independently read CT and PET studies provided the rules shown in Figure 1 and were congruent with the consensus reading except for 2 cases. It has been suggested that simultaneous interpretation of PET/CT is not only superior to CT alone or PET alone but also superior to a nonsimultaneous interpretation of CT and PET information (21). Our study design does not permit comparison of these reading strategies.
Lesion characterization can be accomplished through visual or quantitative analysis. Although visual assessment by an experienced radiologist or nuclear medicine specialist is sufficient, the lesion's SUV has been reported to be helpful in characterization and prognosis. Lesions with an average SUV higher than 2.5 (3) have been considered malignant. In the current study, the 31 positive PET lesions were evaluated in a semiquantitative manner, using a cutoff criterion of 2.0 for the SUVmax. Similar to Hashimoto et al. (22), who used a PET-only system and an SUVmax cutoff of 2.5, we found that characterization based on quantitative analysis produced the same results as visual interpretation. In addition, accuracy did not improve after lean body mass correction and, in fact, changed 1 true-positive finding into a false-negative one. This indicates that for clinical situations, visual interpretation is at least sufficient if not superior.
The ROC of Figure 2 shows that, indeed, our readers performed as expected. Using the uptake in the liver (around 3 SUVs) and mediastinal blood pool (around 2 SUVs) as reference produces the PET curve in Figure 2, which is comparable with the PET SUV curve (based solely on SUVmax) over a large range (specificities, 5%–85%). Statistical analysis by the AUC (Fig. 2) revealed that the quantitative analysis was not significantly different from the PET-alone interpretation. PET/CT was superior and significantly different from PET alone: AUC = 0.90 versus 0.79 (P < 0.03, Fig. 2).
Although SPNs have been documented to have a 40% malignancy rate, this percentage varies with age, smoking history, location, and patient selection (6,8,11,12). For example, lung cancer is extremely rare in patients under the age of 30 y, whereas patients over 50 y of age have higher malignancy rates. In our study, the mean patient age was 67 y, thereby offering one explanation for the 69% malignancy rate. In addition, our population was selected from a larger pool of patients who were referred for a PET/CT study because they had pathologic verification of their lung lesion. This induces a selection bias, and our malignancy rate was almost twice as high as that in the general population. The prevalence of disease heavily affects the positive predictive value (PPV) and negative predictive value (NPV); therefore, our values should be used with caution as they do not reflect the PPV or NPV in screening of the general population. Confirmation bias may also have a small effect on sensitivity and specificity.
One of the drawbacks of metabolic imaging is that abnormal 18F-FDG uptake is not specific for malignancy. Benign lesions such as bacterial pneumonia, active sarcoidosis, infectious granulomas, acute pyogenic abscesses, cryptogenic fibrosing alveolitis, and so forth have been known to produce false-positive readings on PET (6). In California, the specificity and PPV of PET scans are known to be lower because of the prevalence of fungal infections such as coccidiomycosis. Although the metaanalysis of Gould et al. (13) found a sensitivity of 94% and a specificity of 86% in characterization of SPNs (<4 cm in size) with 18F-FDG PET, our institution found earlier a sensitivity of 80% and specificity of 75% (23). In the current study, 18F-FDG PET alone had a sensitivity and a specificity of 69% and 85%, respectively.
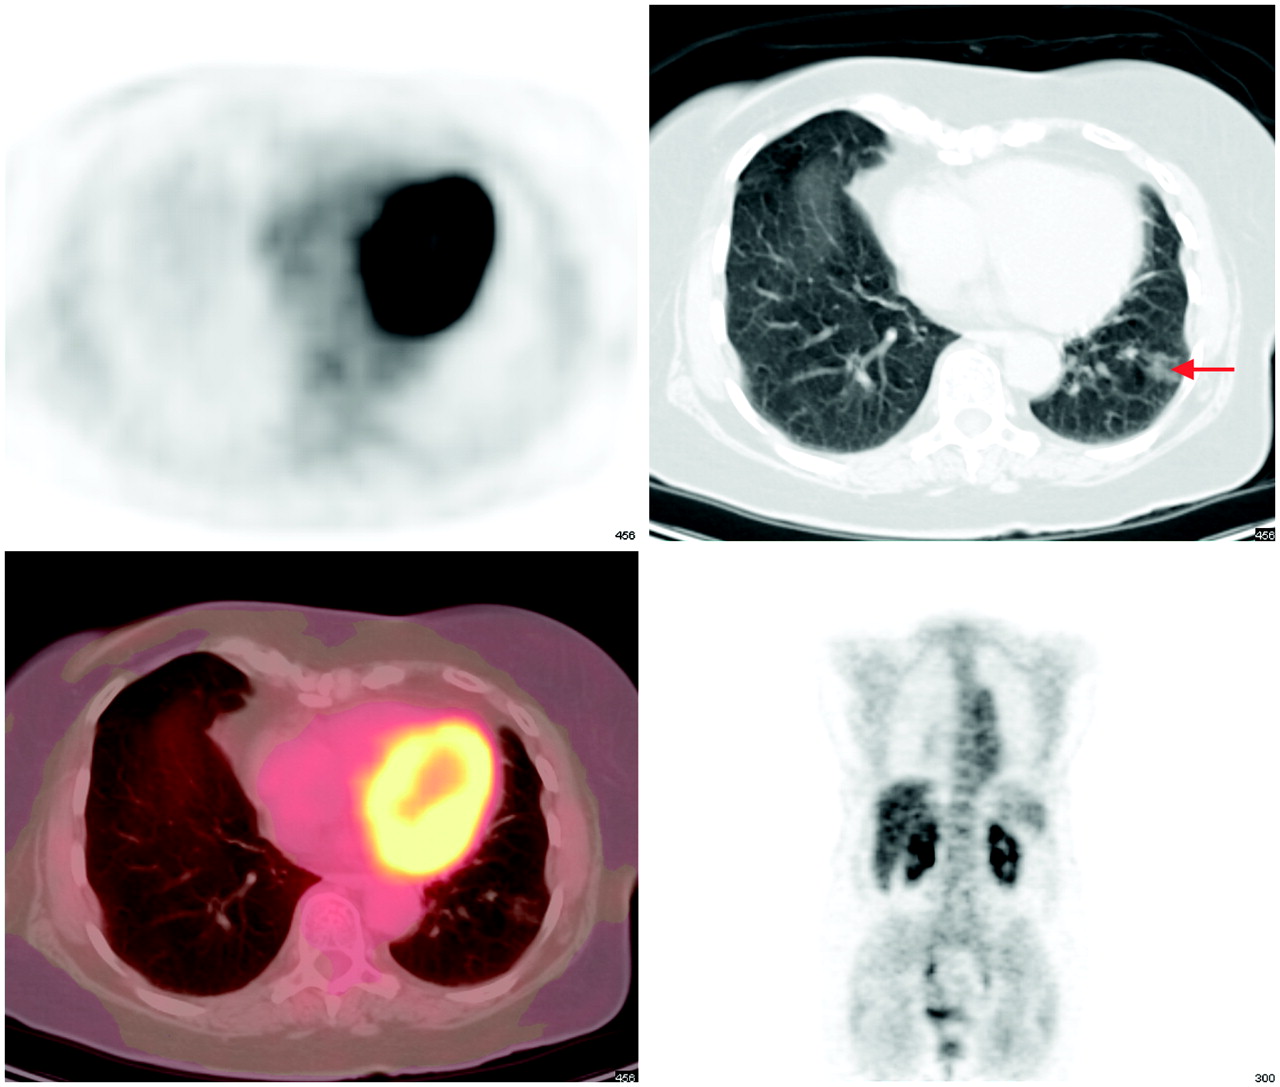
The sensitivity of 18F-FDG PET to detect malignant lesions is compromised for an SPN with low metabolic activity or an SPN that is small in size. For example, pure BACs are typically hypometabolic and, as a result, are usually false-negative. In 2002, Yap et al. (24) found that PET had a sensitivity of 33% in the characterization of 6 pure BAC lesions. These authors found a PET sensitivity of 89% for adenocarcinomas with up to 75% BAC component. A typical false-negative PET example is shown in Figure 3. Small lesions are challenging because of PET's limited spatial resolution, and lesions <7 mm are seen only when the metabolic activity is very high. In our population, PET-only interpretation failed in 9 lesions: 4 had no visible uptake, 3 had low metabolism (1 BAC and 2 neuroendocrine), and 2 were <1 cm.

Opacification in left lower lung field on CT (arrow). On PET and fusion images there is no 18F-FDG uptake. Lesion was scored as 4 on CT and 0 on PET and interpreted as benign on PET/CT. Lesion was resected and pathology revealed an adenocarcinoma with BAC features.
Table 4 shows 1.2 as the lowest SUVmax. This SPN had a corresponding liver SUV of 1.1, leading to the conclusion that the dose was not correctly measured or entered or possibly partially infiltrated. Because the anticubital fossa is no longer in the field of view with PET/CT, this quality control step is no longer available to the interpreting physician. Qualitative interpretation is not hampered by these effects.
Potential errors due to needle-biopsy sampling were likely small in this study because of the multiple cuts through the nodule. Only half of the SPNs were confirmed by biopsy, which is a limitation of our study.
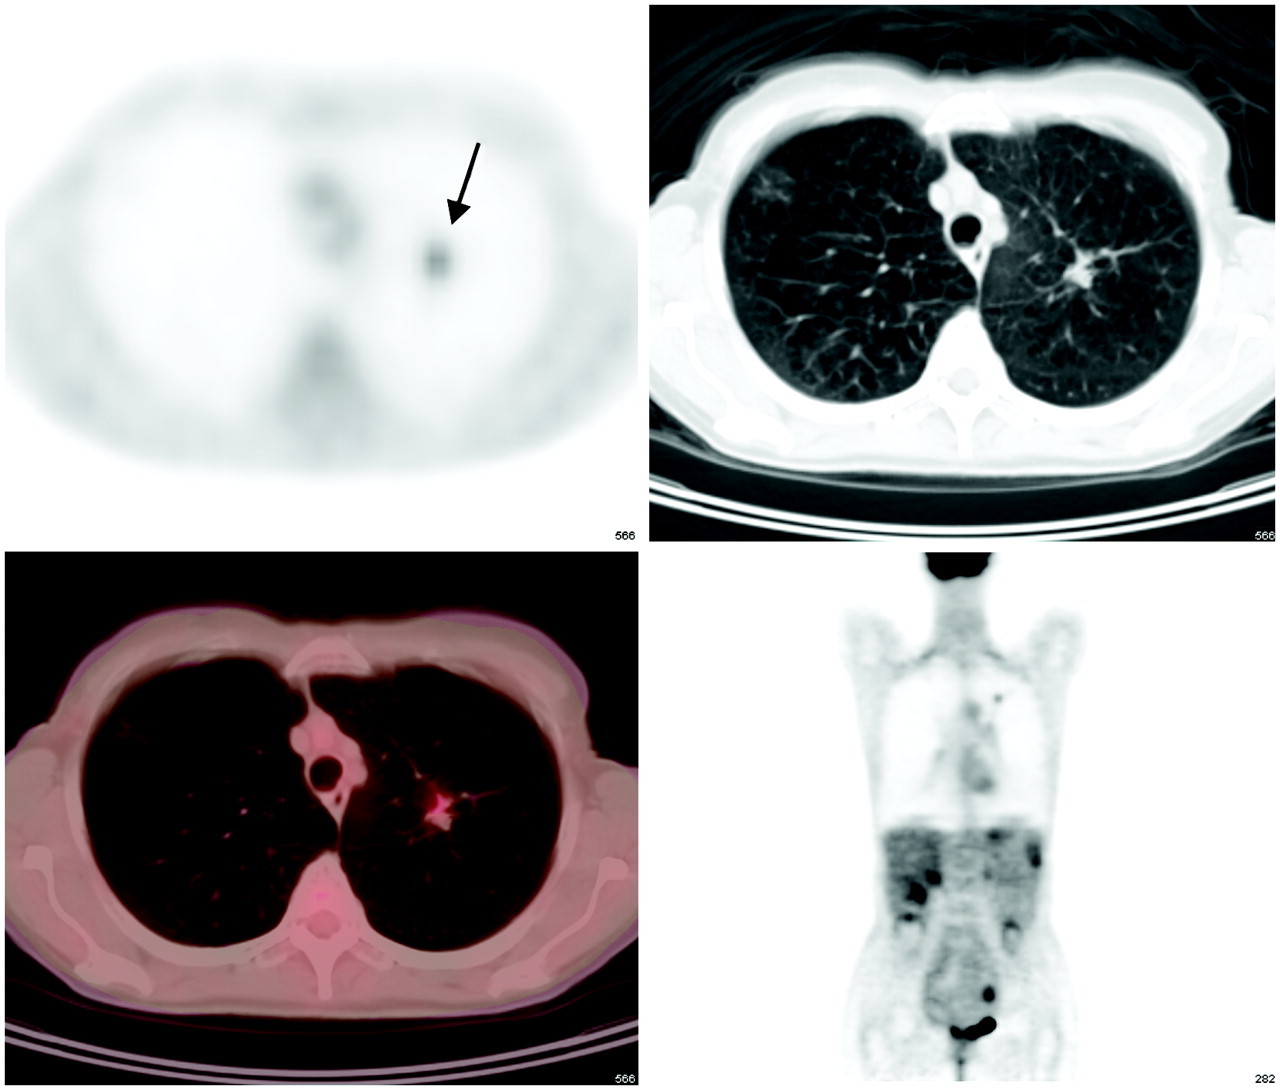
On a similar note, 1 lesion was initially classified as false-positive by PET/CT, confirmed by biopsy and bronchial lavage (Fig. 4). Eighteen months after the first PET/CT, the patient had another PET/CT examination, which showed that the lesion had grown in size and increased its metabolic activity. A left lobectomy was subsequently performed, which confirmed that the mass was a BAC with an area of poorly differentiated adenocarcinoma. In this case, the initial PET/CT detected and characterized the lesion correctly, whereas the initial biopsy and pathology produced a false-negative result. This is a sampling error related to inadequate tissue for histology (5).

PET/CT images of 63-y-old patient with a nodule in left upper lobe (arrow). Nodule looks suspicious on CT (score, 5) and has higher uptake than that in mediastinum (PET score, 3). Biopsy and bronchial lavage revealed inflammatory cells but no evidence of malignancy. Patient was lost to follow-up and returned 18 mo later for another PET/CT examination. The second study was again positive and showed that the lesion had grown in size and increased in uptake. Biopsy and subsequent lobectomy confirmed that the lesion was a BAC with a zone of poorly differentiated adenocarcinoma. PET/CT, which was initially classified as false-positive, was true-positive after all.
A limitation of this study relates to the shallow breathing during the data acquisition. Contrary to conventional CT, which is performed during a breath-hold at deep inspiration for optimal visualization of lung parenchyma, patients in this study are breathing shallow to achieve adequate registration of PET and CT images and to ensure correct attenuation correction (CT-based). CT, therefore, suffers from breathing and motion artifacts, obscuring lesion borders. This hampers radiologic interpretation, especially of small lesions and SPNs close to the diaphragm. No intravenous contrast was used and calculation of Hounsfield unit enhancement was thus not available. In clinical routine, however, noncontrast CT is the standard for screening, although this is acquired with 2- to 4-mm collimation rather than with 5-mm reconstruction used in our study. High-resolution CT is usually performed for follow-up after the SPN has been detected, and imaging is repeated to check for possible growth (wait-and-watch strategy (2)).
This study substantiates PET/CT in the characterization of solitary pulmonary lesions. The combination of anatomic and metabolic imaging preserves the sensitivity from CT and maintains the specificity from PET, resulting in an overall improved accuracy. In other words, there is synergy between anatomic and metabolic imaging when performing PET/CT. There were significant differences between the performance of PET/CT and either PET alone (sensitivity, specificity, accuracy, PPV) or CT alone (specificity, PPV), as demonstrated in Table 2.
CONCLUSION
PET/CT has a high accuracy for detection and characterization of SPNs. Our study found a sensitivity of 97% and a specificity of 85%, with an overall accuracy of 93%. PET/CT performs significantly better than PET alone in accuracy, sensitivity, and specificity and better than CT alone in specificity. Dual-modality imaging with PET/CT is synergistic by maintaining the sensitivity of CT and the specificity of PET. Characterization of malignancy is decreased for small or metabolically inactive lesions. Visual inspection appears sufficient for the characterization of an SPN. No additional information is provided by performing semiquantitative analysis with or without lean body mass correction.
Acknowledgments
The authors express their gratitude to the UCLA Cyclotron staff for production of 18F-FDG and to technologists Larry Pang and John Williams for their technical support during image acquisition. The help of James W. Sayre with the statistics is greatly appreciated. Part of this study was presented at the Society of Nuclear Medicine 52nd Annual Meeting in Toronto, Ontario, Canada, June 18–23, 2005.
Footnotes
-
COPYRIGHT © 2007 by the Society of Nuclear Medicine, Inc.
References
- Received for publication July 3, 2006.
- Accepted for publication November 11, 2006.


Jump to section
Related Articles
Cited By...
- Solitary pulmonary nodule imaging approaches and the role of optical fibre-based technologies
- Is FDG-PET/CT Useful for Diagnosing Pulmonary Metastasis in Patients with Soft Tissue Sarcoma?
- 18F-FDG PET/CT in the post-operative monitoring of patients with adrenocortical carcinoma
- British Thoracic Society guidelines for the investigation and management of pulmonary nodules: accredited by NICE
- PET/MR Imaging in the Detection and Characterization of Pulmonary Lesions: Technical and Diagnostic Evaluation in Comparison to PET/CT
- Computed Tomography-Based Simulation for Thoracic Radiation Therapy: Technical Advance or Clinical Evidence?
- Dual-headed Coincidence PET vs. Dedicated PET/CT in the Evaluation of Thoracic Malignancies
- PET for the Evaluation of Solitary Pulmonary Nodules
- A Comparison of the Diagnostic Accuracy of 18F-FDG PET and CT in the Characterization of Solitary Pulmonary Nodules
- A Multicenter Clinical Trial on the Diagnostic Value of Dual-Tracer PET/CT in Pulmonary Lesions Using 3'-Deoxy-3'-18F-Fluorothymidine and 18F-FDG