


Abstract
CT and PET are widely used to characterize solitary pulmonary nodules (SPNs). However, most CT accuracy studies have been performed with outdated technology and methods, and previous PET studies have been limited by small sample sizes and incomplete masking. Our objective was to compare CT and PET accuracy in veterans with SPN. Methods: Between January 1999 and June 2001, we recruited 532 participants with SPNs newly diagnosed on radiography and untreated. The SPNs were 7–30 mm. All patients underwent 18F-FDG PET and CT. A masked panel of 3 PET and 3 CT experts rated the studies on a 5-point scale. SPN tissue diagnosis or 2-y follow-up established the final diagnosis. Results: A definitive diagnosis was established for 344 participants. The prevalence of malignancy was 53%. The average size was 16 mm. Likelihood ratios (LRs) for PET and CT results for combined ratings of either definitely benign (33% and 9% of patients, respectively) or probably benign (27% and 12%) were 0.10 and 0.11, respectively. LRs for PET and CT results for combined ratings of indeterminate (1% and 25%), probably malignant (21% and 39%), or definitely malignant (35% and 15%) were 5.18 and 1.61, respectively. Area under the receiver operating characteristic curve was 0.93 (95% confidence interval, 0.90–0.95) for PET and 0.82 (95% confidence interval, 0.77–0.86) for CT (P < 0.0001 for the difference). PET inter- and intraobserver reliability was superior to CT. Conclusion: Definitely and probably benign results on PET and CT strongly predict benign SPN. However, such results were 3 times more common with PET. Definitely malignant results on PET were much more predictive of malignancy than were these results on CT. A malignant final diagnosis was approximately 10 times more likely than a benign final diagnosis in participants with PET results rated definitely malignant.
PET performed using 18F-FDG is recognized as an imaging modality with a unique capability of differentiating malignant from normal tissue on the basis of the Warburg effect. Neoplastic transformation is associated with increases in glycolysis because of a progressive loss of the tricarboxylic acid cycle (1). Increased glycolysis that results from the amplification of the glucose transporter proteins at the tumor cell surface and increased activity of various key enzymes is one of the most distinctive biochemical features of malignant cells.
Diagnosis of lung cancer often begins with identification of a suggestive nodule on chest radiography or CT. CT is considered an excellent tool for detection and localization but has been shown to have poor specificity (58%) (2) for characterization of the nodule. PET with 18F-FDG has been shown in several studies to be a promising adjunct modality (3–7). A recent systematic review reported a pooled sensitivity and specificity of 94.2% and 83.3% (8). However, the authors of this report noted that the component studies were limited by small sample size, incomplete masking, and biased patient selection.
The primary objective of this study was to compare the accuracy of PET and CT in the characterization of pulmonary nodules in a head-to-head prospective study that addressed the methodologic limitations of previous studies.
MATERIALS AND METHODS
Solitary Nodule Accuracy Project (SNAP) was a prospective study conducted at 10 Veterans Administration hospitals nationwide. The details of the study design and methodology have been presented elsewhere (9) but will be briefly reviewed here. The ethical conduct of the study and participant safety were approved and monitored by the SNAP Data and Safety Monitoring Board, the Human Rights Committee of the Cooperative Studies Program Coordinating Center of the Veterans Administration, and the Institutional Review Board at each participating site.
The primary entrance criterion for participants was evidence of a new, untreated, solitary pulmonary nodule (SPN) between 7 and 30 mm in size on a posteroanterior and lateral view of plain chest radiography. All SPNs were round or oval, without associated atelectasis or pleural involvement. For eccentric nodules, size was based on mean diameter (adding the major and minor axes and dividing by 2). However, neither axis was less than 7 mm.
Exclusion criteria included an age of less than 21 y; pregnancy or lactation; a weight of greater than 350–400 lb; intercurrent pulmonary infection; thoracic surgery in the past 6 mo; radiotherapy to the chest in the past year; refusal to undergo biopsy, surgery, or a 2-y clinical follow-up; a life expectancy of less than 2 y if biopsy or surgery was not expected; and involvement in other Veterans Administration cooperative study projects. The SPN identified was referred to as the target nodule. Patients with nodules that were heavily calcified (high likelihood of being benign) or that fell outside the size criterion were not enrolled. Nodules smaller than 7 mm are poorly characterized by PET, and nodules larger than 30 mm are considered to be malignant until proved otherwise.
A composite reference standard was used (10). A malignant diagnosis was established by biopsy or surgical resection of the target nodule. A rating of “definitely malignant” or “definitely benign” by the local pathologist, masked to the CT and PET results, was the reference standard.
When biopsy or surgery was not performed, participants were followed for 2 y, undergoing chest radiography or CT every 6 mo. If the SPN was stable during this period, it was considered to be benign. For this purpose, “stable” was defined as a change in size of less than 1 mm, a decrease in size without treatment at 24 mo, or resolution of the nodule without treatment (11).
All participants underwent CT of the chest and 18F-FDG PET. All centers followed a study protocol for acquisition and processing of the image data for both PET and CT (9). Image quality and resolution of the PET cameras was confirmed by use of a specially fabricated imaging phantom circulated to all study locations. CT examinations were conducted according to guidelines from the American College of Radiology (12). Further details of our imaging protocols can be found in the supplemental data (supplemental materials are available online only at http://jnm.snmjournals.org). A panel of independent research readers established the index test result. The panel consisted of 3 recognized experts in CT and 3 recognized experts in PET. All were academically based physicians, were board certified in their specialty, and had published widely in their field. None was involved in the care of SNAP participants, and all were unaware of patient history other than information provided in compliance with the study protocol (i.e., the chest radiograph showing the target nodule, and the age, sex, smoking history, and tuberculosis status of the patient). The panel convened at a central location 7 times from February 2000 to July 2003. Multiple reader sessions were arranged to minimize fatigue by limiting the number of studies reviewed to no more than 100 per reader. Each participant image was reviewed twice by a reader of each modality (i.e., 2 PET readers interpreted each participant PET image; and 2 CT readers interpreted each participant CT image). PET and CT readers were asked to use a 5-point ordinal scale for ratings: definitely benign, probably benign, indeterminate, probably malignant, and definitely malignant. The PET and CT readers on the panel used the criteria shown in Table 1 to make these ratings. Disagreements between readers were not resolved; instead, the decision of one of the readers was selected at random for each participant. We took this approach to better reflect the method of interpretation seen in the clinical setting.
PET and CT Criteria for Rating SPN
Interreader reliability was assessed by comparing the results of each pair of readers (i.e., PET and CT) in the panel of independent research readers. Intrareader reliability was assessed at the SNAP study sites. After acquisition of the PET or CT study, local specialists in radiology or nuclear medicine interpreted the result in a masked fashion with their findings recorded on a standard SNAP study form. In this initial reading, the local reader was masked except for being able to see the chest radiograph and the age, sex, and smoking history. Image datasets were provided to the reader by a research assistant without other information. The same process was repeated a minimum of 6 mo later, and these 2 readings were compared to estimate intrareader reliability.
The sample size for SNAP was based on the primary comparison of the sensitivity of CT versus PET, adjusting for the correlation that resulted from performance of both tests on the same participant. Preliminary studies suggested an SE of 0.94, a 22% prevalence of malignancy, and a correlation of less than 0.30. Based on these and an expected difference of 7% in the sensitivity rates, the original sample size of 900 was chosen (90% power and an α of 0.05). However, at the request of the Data and Safety Monitoring Board, an interim analysis to check the assumptions was conducted and found a higher-than-expected correlation and prevalence of malignancy. As a consequence, the Data and Safety Monitoring Board reduced the study sample size from 900 to 400. Estimates of diagnostic accuracy for PET and CT were calculated for those participants for whom there was a CT and PET reading and a valid reference standard. For each participant, a reader pair (PET and CT) and reference test result were selected at random and used to estimate sensitivity, specificity, and the receiver operating characteristic (ROC) curve; further detail on this method can be found in the previously reported study design paper (9). Sensitivity and specificity were estimated for each level of diagnostic confidence (definitely benign, probably benign, indeterminate, probably malignant, and definitely malignant). Confidence intervals (CIs) around the estimates of sensitivity and specificity were estimated (13). The ratings were dichotomized, with definitely benign and probably benign considered negative, and indeterminate, probably malignant, and definitely malignant considered positive. Interval likelihood ratios (LRs) (14,15) were calculated (16) for each level of confidence and for these dichotomized sets. ROC curves, areas under the curve (AUCs), and 95% CIs were derived for each modality with RockIt 0.9B (17) as described by Dorfman and Alf (18,19). AUCs for the 2 modalities were compared accounting for correlation between test results because each participant acted as his own control (20).
The potential for bias in the estimate of sensitivity and specificity was evaluated using sensitivity analyses. In brief, when no reference standard had been identified for a study participant, the participant's study records and medical records that were available were reviewed by a panel that included the study cochairs and 3 other study investigators. This panel established a reference standard rating for the participant on a 5-point ordinal scale (definitely benign to definitely malignant), and sensitivity and specificity were reestimated in a systematic manner (the supplemental data provide a complete description of this process).
Inter- and intrareader reliability was estimated using a weighted κ-statistic (21). Statistical analyses were performed using SAS 9.0 (SAS Institute).
RESULTS
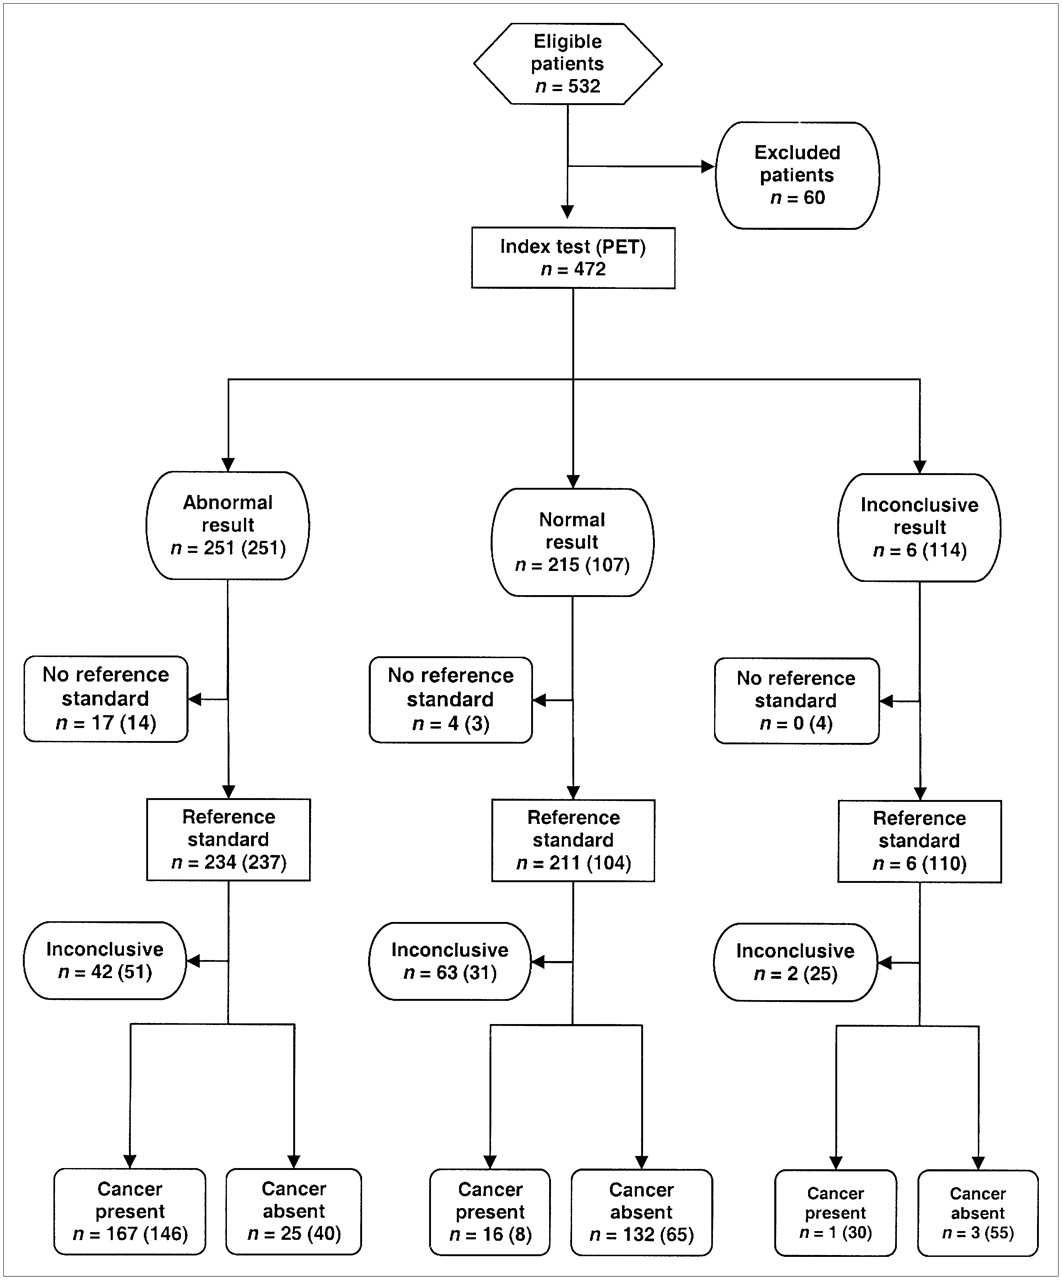
Recruitment for the study and the disposition of the participants are detailed in Figure 1. Between January 1999 and June 2001, 909 people were screened for study participation. Seventy-seven individuals were excluded on the basis of clinical criteria (e.g., a life expectancy of less than 2 y, a nodule that was unchanged for 2 y, and previous thoracic radiation), 133 had an SPN seen on only 1 radiography view, and 167 did not consent to participation. Of the 532 people who consented to participate, 32 did not have a qualifying CT scan, 12 did not have a qualifying PET scan, and the scans for 16 were not read by the panel of independent research readers for technical reasons unrelated to the patient's clinical status, leaving 472 participants. Of these, a reference standard was obtained for 344 participants. The reference standard was obtained by tissue in 184 individuals and completion of a 2-y follow-up in 160. Of those participants who underwent biopsy, 67% did so within 60 d of their first index test. Only 6% underwent biopsy more than 120 d from the time of the first index test.

Recruitment and disposition of SNAP participants for PET and CT as per Standards for Reporting of Diagnostic Accuracy Initiative (22). The numbers for CT are shown in parentheses.
The demographic and clinical characteristics of all participants whose studies were read by the independent panel have been previously reported (9) and are detailed in Table 1 of the supplemental data, with a comparison of those who had a reference standard to those for whom no reference standard was obtained. There were no significant differences between the groups.
The characteristics of the nodules are detailed in Table 2. Of the 184 malignant nodules, 35% were adenocarcinoma, 30% were squamous cell carcinoma, and 20% were other non–small cell lung cancer. Nodules representing metastatic disease to the lung represented less than 10% of the total, and less than 2% of the nodules were bronchoalveolar carcinoma. A definitively benign condition was known for 45 of the 160 benign nodules; the remainder was pathologically classified as other. The mean size for all nodules was 16.4 mm. Malignant nodules had a mean size of 18.9 mm (SD, 6.8); benign nodules, 13.3 mm (SD, 5.2). The predominant location of the nodules was the upper lung zones, with more nodules found in the right lung than the left. Nodules in the left lung were more likely to be malignant than those on the right, but this difference was not statistically significant.
Characteristics of Target Nodule
The diagnostic accuracy of PET and CT for the characterization of SPNs is described in Table 3.
LRs for PET and CT
Likelihood ratios (LRs) for PET and CT results for combined ratings of either definitely benign (33% and 9% of patients, respectively) or probably benign (27% and 12%) were 0.10 and 0.11, respectively. LRs for PET and CT results for combined ratings of indeterminate (1% and 25%), probably malignant (21% and 39%), or definitely malignant (35% and 15%) were 5.18 and 1.61, respectively. With the ratings dichotomized as previously described, sensitivity for PET was 91.7% (95% CI, 86.6%–95.0%) and specificity was 82.3% (95% CI, 75.4%–87.6%). Sensitivity for CT was 95.6% (95% CI, 91.3%–97.9%), and specificity was 40.6% (95% CI, 33.0%–48.7%).
A malignant final diagnosis was approximately 10 times more likely than a benign final diagnosis in participants with definitely malignant ratings on PET, but a malignant final diagnosis was only 3 times more likely when PET results were probably malignant (Table 3). The likelihood of malignancy was similar in participants with probably benign and definitely benign findings on PET. LRs for probably or definitely benign results on CT compared favorably with the corresponding LRs for PET.
The area under the curve for PET was 0.93 (95% CI, 0.90–0.95), and for CT it was 0.82 (95% CI, 0.77–0.86) (Fig. 2). The difference between these 2 estimates was statistically significant (P < 0.0001).
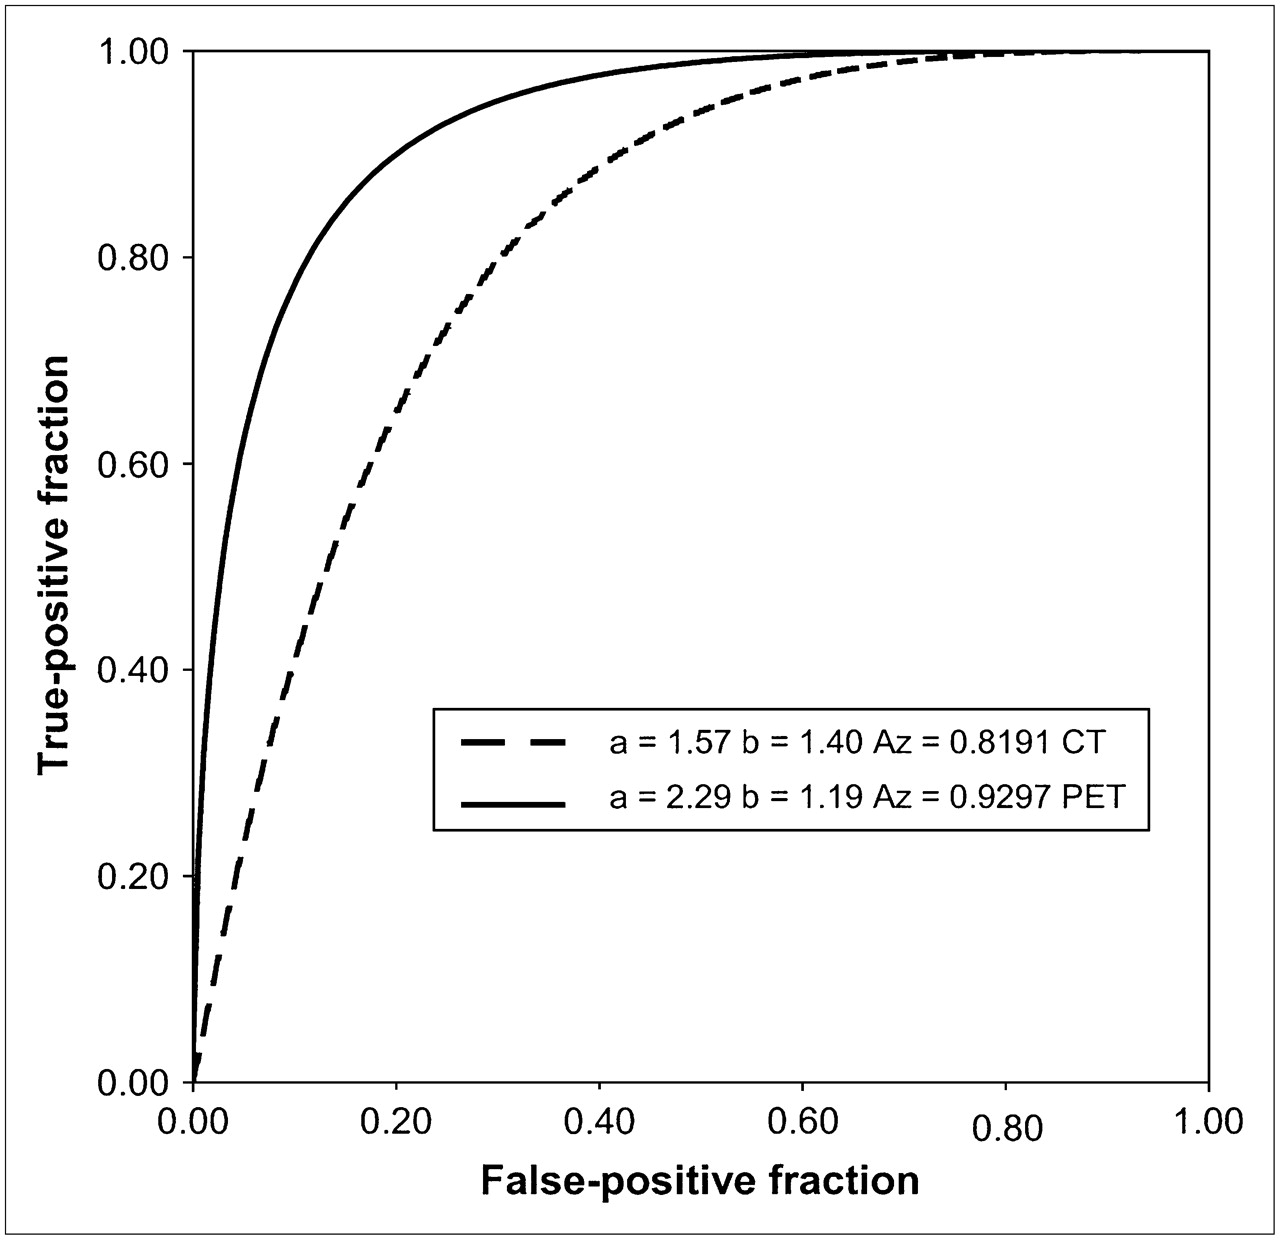
ROC curves for PET and CT.
We compared the results of the panel readers with those of the site readers. We found that neither the PET site reader results (sensitivity, 95.9%; specificity, 77.9%) nor the CT site reader results (sensitivity, 96.3%; specificity, 36.1%) were significantly different from the panel reader results.
Sensitivity analyses showed little change in the estimates of diagnostic accuracy, indicating that our findings were robust to participant losses that were due to incomplete or inconclusive reference standard results (supplemental data).
Inter- and intrareader agreement for PET was excellent, with weighted κ-statistics of 0.826 (95% CI, 0.782–0.870) for interreader and 0.924 (95% CI, 0.901–0.946) for intrareader comparisons. Agreement within and between CT readers was good but considerably lower (interreader: 0.637; 95% CI, 0.542–0.731; intrareader: 0.759; 95% CI, 0.660–0.859).
DISCUSSION
This was the largest and most rigorous evaluation of PET in patients with SPNs and one of only a few studies to compare the accuracies of PET and CT for this indication (23). In addition, almost all previous studies that examined the accuracy of CT for characterizing lung nodules were performed more than 15 y ago (24,25) with technology and methods that are completely out of date.
We found that PET had similar sensitivity and superior specificity to CT in the characterization of SPNs. Accordingly, LRs were similar for PET and CT results that were probably or definitely benign, and such results on either test were strongly associated with a benign final diagnosis. However, definitely malignant results on PET were much more predictive of malignancy than were these results on CT. ROC curve analysis confirmed that PET is more accurate than CT. Figure 2 shows that all points for the PET curve lie outside the curve for CT, indicating that regardless of where the threshold that defines a positive test result is set, the accuracy of PET is superior.
PET is typically used as an adjunct to CT in the evaluation of suggestive nodules (26). Our findings support this approach. We found that PET correctly classified 58% of the benign nodules that had been incorrectly classified as malignant on CT. In addition, 25% of nodules were characterized as indeterminate by CT readers, whereas only 1% of nodules were classified as indeterminate by PET readers. Nodules that were classified as indeterminate on CT were correctly characterized on PET in over 80% of the cases (sensitivity, 83%; specificity, 89%).
Gould et al. (8) reported a sensitivity of 94.2% and specificity of 83.3% in their metaanalysis that included a total of 450 patients with lung nodules in 13 small studies. Here, we found lower sensitivity and similar specificity, which would be consistent with those expected in a study with less verification bias (27). These findings are also likely a result of the method used to assemble our study sample. The SNAP protocol called for enrollment of participants with suggestive lesions seen on chest radiographs, as opposed to the strategy used in other studies, which enrolled participants in whom nodules were first seen on CT. We believed that enrolling participants with nodules first seen on CT would have biased the study by increasing the prevalence of malignant nodules. Our enrollment protocol led to a much lower prevalence of malignant nodules (53%) than is typically seen in studies of SPN characterization. This feature of our study design also allowed for an unbiased comparison of the accuracy of PET and CT.
As reported here, CT was not as accurate (sensitivity, 95.6%; specificity, 40.6%) as reported in a recent multisite study of contrast-enhanced CT (28) (sensitivity, 98%; specificity, 58%). The prevalence of malignancy was similar in both studies (53% in SNAP vs. 48% in the enhanced CT study), as were the distribution and mean nodule size. Therefore, it is likely that the difference seen was due to the use of a rigorous protocol with dynamic intravenous contrast enhancement, as opposed to the protocol used in SNAP, which was comparable to that seen in usual clinical practice. It is notable, however, that even with the performance seen in the contrast study, the specificity of CT remained below that seen for PET in SNAP.
We found that PET had superior interobserver and intraobserver reliability, compared with CT. In addition to the superior performance in characterizing indeterminate lesions, this reliability contributes to the superior accuracy of PET over CT. For characterization of solitary nodules, the interobserver reliability reported here for PET is similar to that previously reported in a smaller series (29), whereas for CT it is better than previously reported (30).
The results of this study may not be fully generalizable, inasmuch as the population was male with a high percentage of smokers. However, the prevalence of malignancy and the mean nodule size were similar to those of another large multicenter study with a mixed-sex population (25). The study design incorporated here, which relied on random selection of a single reader from a pair to estimate sensitivity and specificity, is somewhat novel. Although this design has undergone preliminary peer review in our study design paper (9), it should not be considered to have been fully tested by the rigors of peer review. Our analyses have not shown any bias that might be introduced by relying on this method, but readers considering incorporating such a design in their own investigations should be cautioned to await more extensive tests of the limitations and bias of this trial design.
The estimates of accuracy in this study were based on 344 participants who underwent both PET and CT and for a whom diagnosis was obtained on the basis of tissue or follow-up. There were 128 additional participants (27% of the total sample of 472) for whom no gold standard was obtained. This limitation may restrict the validity of our results. However, as shown in Supplemental Table 1, no differences were seen between the characteristics of those excluded from the analysis and the characteristics of those who were included. We also conducted a sensitivity analysis that demonstrated that using a less rigorous reference standard did not change the estimates of sensitivity and specificity.
Some might argue that with the advent of integrated PET/CT scanners, our comparison of dedicated PET and CT technology is dated. There is some evidence that integrated PET/CT is more accurate than dedicated PET for lung cancer staging (31,32). In this regard, and in uncommon circumstances, the CT component might help to improve the performance of PET by identifying rapid growth consistent with an infectious process, providing alternate diagnostic hypotheses, demonstrating a typical pattern of bronchioloalveolar carcinoma, and similar advantages.
CONCLUSION
In this head-to-head study of 344 people with SPNs identified on chest radiography, we found that PET was more accurate and reliable than CT and resulted in far fewer indeterminate test results. Probably or definitely benign results on PET and CT are strongly associated with a benign diagnosis. Definitely malignant results on PET are strongly associated with a malignant diagnosis.
Acknowledgments
This study was funded by the Cooperative Studies Program of the Department of Veterans Affairs Office of Research and Development, Clinical Science Research and Development Service. Details of the methodology and design of this study have been previously published (9).
Footnotes
-
COPYRIGHT © 2008 by the Society of Nuclear Medicine, Inc.
References
- Received for publication July 10, 2007.
- Accepted for publication November 6, 2007.


Jump to section
Related Articles
Cited By...
- British Thoracic Society guidelines for the investigation and management of pulmonary nodules: accredited by NICE
- Slow-growing lung cancer as an emerging entity: from screening to clinical management
- Avoiding overdiagnosis in lung cancer screening: the volume doubling time strategy
- PET for the Evaluation of Solitary Pulmonary Nodules
- Reply: PET for the Evaluation of Solitary Pulmonary Nodules
- Current imaging practice in lung cancer