


Abstract
The aim of this study was to investigate whether early (time 1, or T1) myocardial tetrofosmin imaging is feasible and as accurate in detecting coronary artery disease as is standard delayed (time 2, or T2) imaging. Methods: One hundred twenty patients (100 men and 20 women; mean age ± SD, 61 ± 10 y) with anginal symptoms underwent tetrofosmin gated SPECT. Stress/rest T1 imaging was performed at 15 min and T2 at 45 min after injection. Image quality was visually evaluated using a 4-point scale (from 0 = poor to 3 = optimal). Myocardial perfusion analysis was performed on a 20-segment model using quantitative perfusion SPECT software, and reversible ischemia was scored as a summed difference score (SDS). Coronary angiography was performed within 1 mo on all patients, and stenosis of more than 50% of the diameter was considered significant. Results: Overall, quality was scored as optimal or good for 94% of T1 images and 95% of T2 images (P = not statistically significant). Heart, lung, liver, and subdiaphragmatic counts did not differ for stress and rest T1 and T2 imaging. A good linear relationship was seen between T1 and T2 SDS (r = 0.69; P < 0.0001), and Bland–Altman analysis showed good agreement between the 2 conditions. In terms of global diagnostic accuracy, areas under the receiver-operating-characteristic curve were comparable between T1 and T2 (0.80 vs. 0.81, P = not statistically significant). Discrepancies between T1 and T2 SDS were observed in 44% of patients (T1 − T2 SDS > 2). Linear regression analysis showed a good correlation between T1 and T2 SDS (r = 0.67; P < 0.0001), whereas the Bland–Altman method showed a shift in the mean value of the difference of +2.67 ± 2.73. In patients with a T1 − T2 SDS of more than 2, areas under the receiver-operating-characteristic curves were significantly higher for T1 than for T2 images (0.79 vs. 0.70, P < 0.001). Conclusion: T1 imaging is feasible and as accurate as T2 imaging in identifying coronary artery disease. However, in a discrete subset of patients, early acquisition strengthens the clinical message of defect reversibility by permitting earlier, more accurate identification of more severe myocardial ischemia.
Sestamibi and tetrofosmin represent reliable alternative tracers to 201Tl for detecting coronary artery disease and viable myocardium (1–3). Unlike sestamibi, tetrofosmin has a more favorable biodistribution, and theoretically, its rapid accumulation in the myocardium and the relatively fast liver kinetic (4,5) allow early imaging. Such early imaging could result in shorter waiting times for patients and could be important in some clinical situations, such as suspected acute coronary syndromes, in which time is critical for therapeutic interventions. As previously reported, one important factor limiting early and fast imaging protocols with 99mTc-compounds is a possible increase in the number of artifactual defects in the inferior wall due to high subdiaphragmatic uptake (6–8).
Therefore, the aim of the present study was to investigate whether early (time 1, or T1) myocardial tetrofosmin gated SPECT is technically feasible and as clinically accurate as standard delayed (time 2, or T2) imaging in subjects with known coronary anatomy.
MATERIALS AND METHODS
Patient Population
The study population included 120 patients (100 men and 20 women; mean age ± SD, 61 ± 10 y; range, 23–83 y) referred to 9 Italian nuclear medicine departments from January 2005 to March 2006 for stress/rest tetrofosmin gated SPECT. All patients had a known coronary anatomy at the time of the study or underwent coronary angiography within 2 wk of that time.
The patients were studied after fasting overnight and were asked to avoid foods containing phylline derivates for 48 h before the stress. Nitrates, β-blockers, and calcium-channel blockers were discontinued 5 plasma half-lives before gated SPECT, whereas other drugs such as angiotensin-converting enzyme inhibitors were maintained.
Scintigraphic Protocol
Each patient underwent stress/rest tetrofosmin gated SPECT in a 1- or 2-d protocol as previously described (9). Seventy-eight patients (65%) underwent a bicycle stress test, whereas 42 patients (35%) had pharmacologic stress induced using a low-dose dipyridamole infusion (0.56 mg/kg in 4 min).
In the 1-d protocol, tetrofosmin (296–370 MBq) was administered intravenously at peak stress. Immediately after the end of the stress, the patients ate a fatty meal to accelerate hepatobiliary clearance of the tracer. Within 15 min (T1), gated SPECT was performed using a double-head γ-camera (Millennium; GE, or ECAM; Siemens) equipped with high-resolution collimators. The protocol included a 64 × 64 matrix, 32 projections, 40-s projections, and 8 frames per cycle used in association with a 15% window centered on the 140-keV photopeak of 99mTc. Then, within a range of 45 min to 1 h after radiotracer injection (T2), the stress study was repeated using the same acquisition protocol to obtain standard gated SPECT images. The studies were reconstructed using filtered backprojection without attenuation or scatter correction.
Immediately after completion of the stress study, 740–830 MBq of tetrofosmin were administered under resting conditions, and both T1 and T2 gated SPECT scans were obtained as for the stress imaging.
In the 2-d protocol, 370–600 MBq of tetrofosmin were injected and the T1 and T2 gated SPECT scans were obtained on separate days.
In no patient did the total dose administered in the 2 protocols exceed 1,200 MBq.
When indicated by a history of previous myocardial infarction, tetrofosmin at rest was injected after nitrate administration (sublingual isosorbide mononitrate, 5 or 10 mg according to body weight).
Analysis of Scintigraphic Data
Qualitative and quantitative analysis of scintigraphic data was performed at a core laboratory (CNR Pisa).
Determining the feasibility of the study required evaluation of the overall quality of the gated SPECT images. Two independent observers visually analyzed the quality using a 4-point scale (from 0 = poor to 3 = optimal). Quantitative analysis was performed on anterior raw images by drawing irregular regions of interest on the heart, lungs, liver, and subdiaphragmatic area including the liver. Counts obtained in each region were normalized to the number of pixels and compared for both stress and rest T1 and T2 images. Washout rates were calculated according to the formula 100 × (early – delayed/early counts).
The presence and extent of perfusion defects and their reversibility were evaluated on a 20-segment model by an operator-independent analysis of regional myocardial perfusion and wall motion using previously validated software for gated SPECT analysis (quantitative gated SPECT and quantitative perfusion SPECT (10)). Summed stress score, summed rest score, and summed difference score (SDS) were automatically measured according to the clinical conditions of the acquisition.
Agreement between the 2 sets of scans was analyzed using SDS as an integrative parameter reflecting the presence and the extent or severity of perfusion defects.
Analysis of myocardial function between T1 and T2 scans was performed using ejection fraction (EF) and summed motion score as parameters reflecting the degree of global and regional left ventricular dysfunction.
Coronary Angiography
All angiograms were quantitatively evaluated using GE Medical Systems software by physicians who were unaware of the protocol. Stenosis of more than 50% of the vessel diameter was considered significant.
Statistical Analysis
Continuous variables are presented as mean ± SD. Where indicated, differences were assessed by the Student t test for paired or unpaired data. In the evaluation of quality between T1 and T2 images, the χ2 test was used for comparison of proportions. When the total number of observations was fewer than 20, the Fisher exact test was applied.
The significance of the relationship between T1 and T2 perfusion data and functional indices after stress and at rest was assessed by linear regression analysis. Agreement was also analyzed using the Bland–Altman method (11). Accuracy in coronary stenosis detection was estimated by analysis of receiver-operating-characteristic (ROC) curves, using MedCalc software (version 9.3.0.0). κ-Values were used as previously described (12). Statistical significance for all analyses was assessed at a P value of less than 0.05.
RESULTS
Clinical Results
Of the 120 study patients, 34 had a clinical history of previous myocardial infarction; 61 had been previously revascularized (16 with a coronary artery bypass graft and 45 with percutaneous coronary angioplasty); 53 had single-, 22 double-, and 9 triple-vessel disease; and 36 did not have significant coronary artery stenosis.
Scintigraphic Results
Analysis of Image Quality.
All patients except one had gated SPECT images of a quality suitable for qualitative clinical interpretation. In particular, the quality of stress/rest gated SPECT images was rated as optimal in 38 patients at T1 versus 42 at T2, good in 76 at T1 versus 73 at T2, fair in 5 at T1 versus 4 at T2, and poor in 1 patient at both T1 and T2 (P = not statistically significant [NS] for all values). The only patient with poor-quality images at both T1 and T2 showed obvious motion artifacts, which were corrected with software.
Heart, lung, liver, and subdiaphragmatic counts did not differ between stress T1 and T2 and averaged 76 ± 21, 43 ± 14, 115 ± 64, and 76 ± 39 counts per pixel, respectively, at T1 and 77 ± 26, 42 ± 17, 104 ± 43, and 81 ± 36 counts per pixel, respectively, at T2 (P = NS for all values). Heart, lung, and subdiaphragmatic washouts were negligible, whereas the liver showed a 5% washout from stress T1 to T2. Rest T1 and T2 did not show appreciable differences, and washouts were comparable.
Semiquantitative Analysis of Perfusion Imaging.
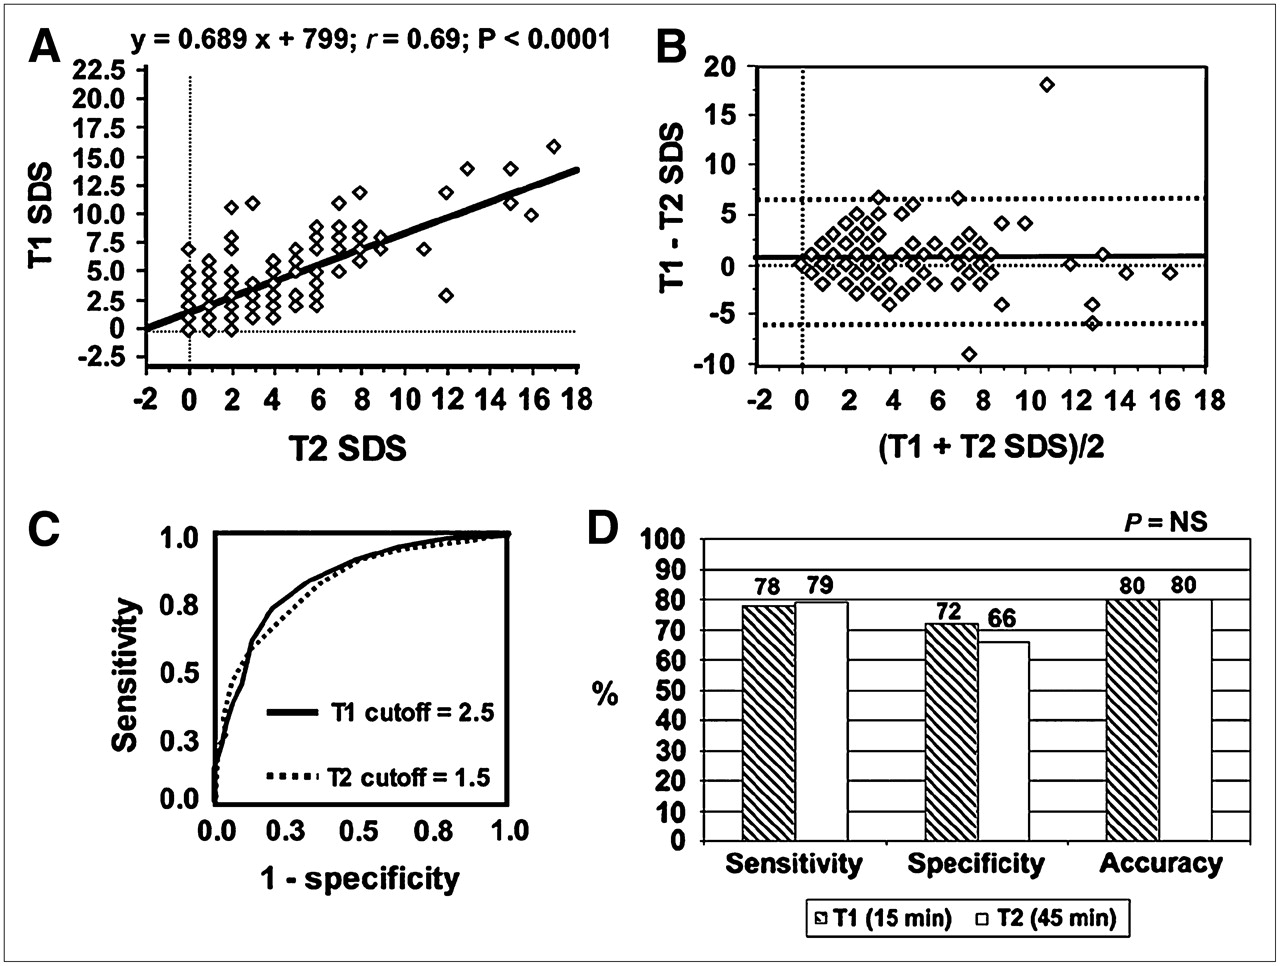
The mean T1 SDS results were slightly but statistically significantly higher than the mean T2 results (4.15 ± 3.72 vs. 3.67 ± 3.72, P < 0.05). Linear regression analysis showed a good relationship between T1 and T2 SDS (y = 0.689x + 799; r = 0.69; SEE = 0.06; P < 0.0001) (Fig. 1). The Bland–Altman method showed a shift in the mean value of the difference (T1 − T2 SDS) of +0.50 ± 2.92 (range, −9.0 to +18.0), with 96% of the results enclosed inside the 95% confidence interval of −5.34 to 6.34 (Fig. 1).

(A) Linear regression analysis showed good relationship between T1 and T2 SDS (y = 0.689x + 799; r = 0.69; SEE = 0.06; P < 0.0001). (B) Bland–Altman analysis showed good agreement between T1 and T2 SDS. (C) ROC curve analysis identified cutoffs of 2.5 for T1 and 1.5 for T2 SDS as best separating patients with from those without coronary artery disease. (D) With these thresholds, global diagnostic accuracy was identical between T1 and T2 (0.80 vs. 0.81, P = NS).
ROC curve analysis identified cutoffs of 2.5 for T1 SDS and 1.5 for T2 SDS as the best for separating patients with from those without coronary artery disease (Fig. 1). With these thresholds, T1 imaging predicted coronary artery disease in 66 of 84 patients (79% sensitivity) and excluded it in 26 of 36 patients (72% specificity). T2 imaging predicted coronary artery disease in 67 of 84 patients (80% sensitivity) and excluded it in 24 of 36 patients (67% specificity). Areas under the ROC curves were similar between T1 and T2 images (0.80 vs. 0.81, P = NS) (Fig. 1). The κ-statistic showed good agreement between T1 and T2 imaging results (κ = 0.68; SE = 0.07).
In the 78 patients undergoing exercise stress testing, ROC curve analysis showed that areas under the curves were similar between T1 and T2 images (0.83 vs. 0.79, P = NS). Similarly, in the 42 patients who underwent dipyridamole stress testing, areas under the ROC curves were similar between T1 and T2 images (0.87 vs. 0.84, P = NS).
Myocardial Perfusion in Patients with Discrepancies Between T1 and T2 Results.
We found discrepancies between T1 and T2 (T1 − T2 SDS > 2) in 53 (44%) of 120 patients. No significant differences in clinical data were found between these patients and the general study population. Mean T1 SDS was significantly higher than mean T2 SDS (5.26 ± 3.71 vs. 2.63 ± 2.82, P < 0.0001) (Fig. 2). Linear regression analysis showed a good correlation between T1 and T2 SDS (y = 0.89x +2.98; r = 0.67; SEE = 0.1; P < 0.0001. The Bland–Altman method showed a shift in the mean value of the difference (T1 − T2 SDS) of +2.67 ± 2.73 (range, +1 to +18.0). ROC curve analysis identified cutoffs of 3.0 for T1 and 2.0 for T2 SDS as the best for separating patients with from those without coronary artery disease. With these thresholds, T1 imaging predicted coronary artery disease in 33 of 38 patients (88% sensitivity) and excluded it in 10 of 15 patients (75% specificity). On the other hand, T2 imaging predicted coronary artery disease in 23 of 38 patients (72% sensitivity) and excluded it in 10 of 15 (75% specificity). Areas under the ROC curves were significantly higher for T1 than for T2 images (0.79 vs. 0.70, P < 0.001) (Fig. 2). An example of a patient with perfusion discrepancies is shown in Figure 3.
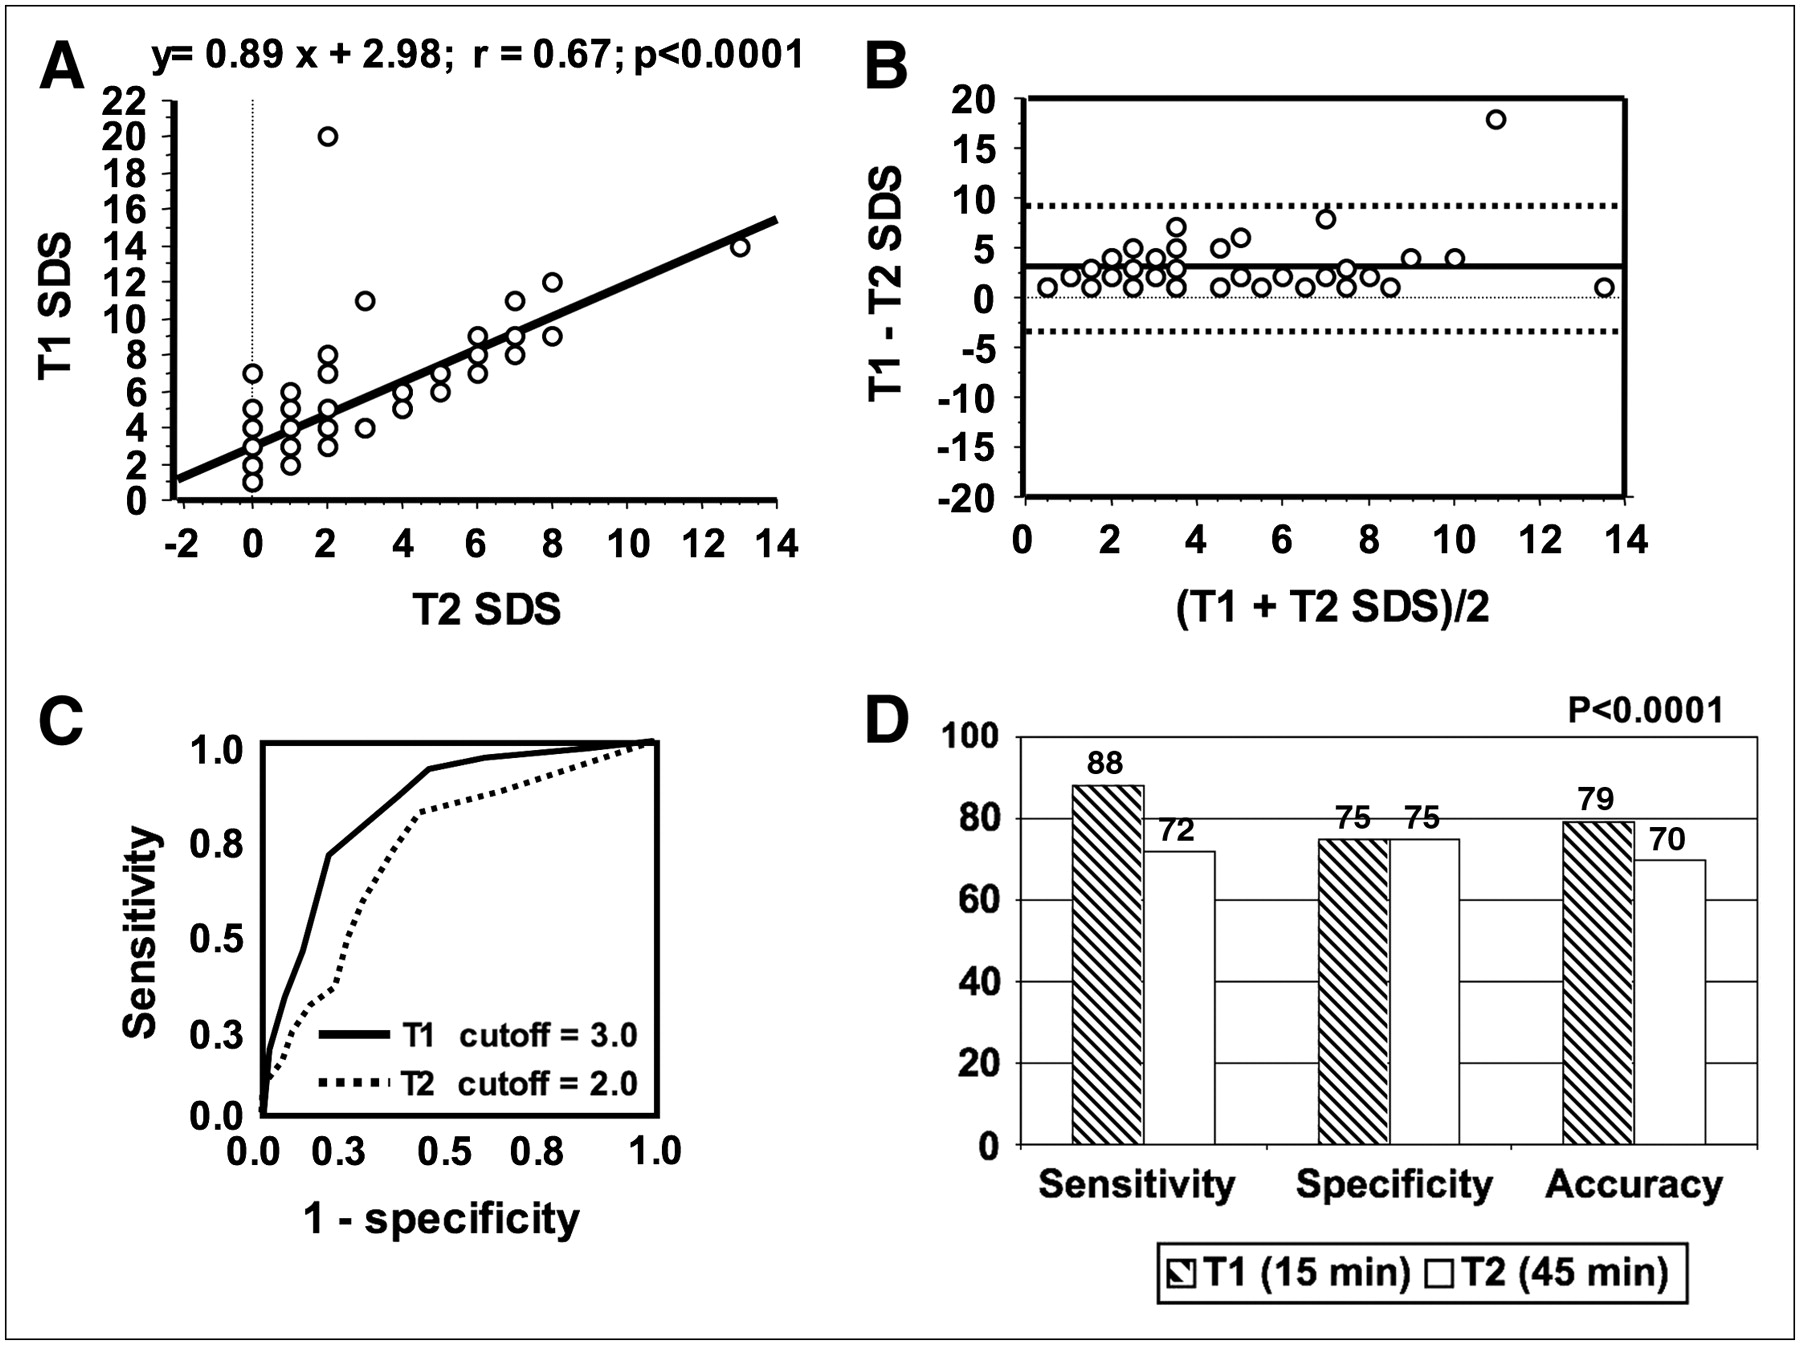
(A and B) In patients with T1 − T2 SDS of more than 2, linear regression analysis (A) showed good correlation between T1 and T2 SDS (y = 0.89x +2.98; r = 0.67; SEE = 0.1; P < 0.0001), whereas Bland–Altman method (B) showed shift in mean value of difference of +2.67 ± 2.73. (C) ROC curve analysis identified cutoffs of 3.0 for T1 and 2.0 for T2 SDS as best separating patients with and without coronary artery disease. (D) With these thresholds, T1 resulted in global diagnostic accuracy significantly higher than that of T2 imaging (0.79 vs. 0.70, P < 0.001).
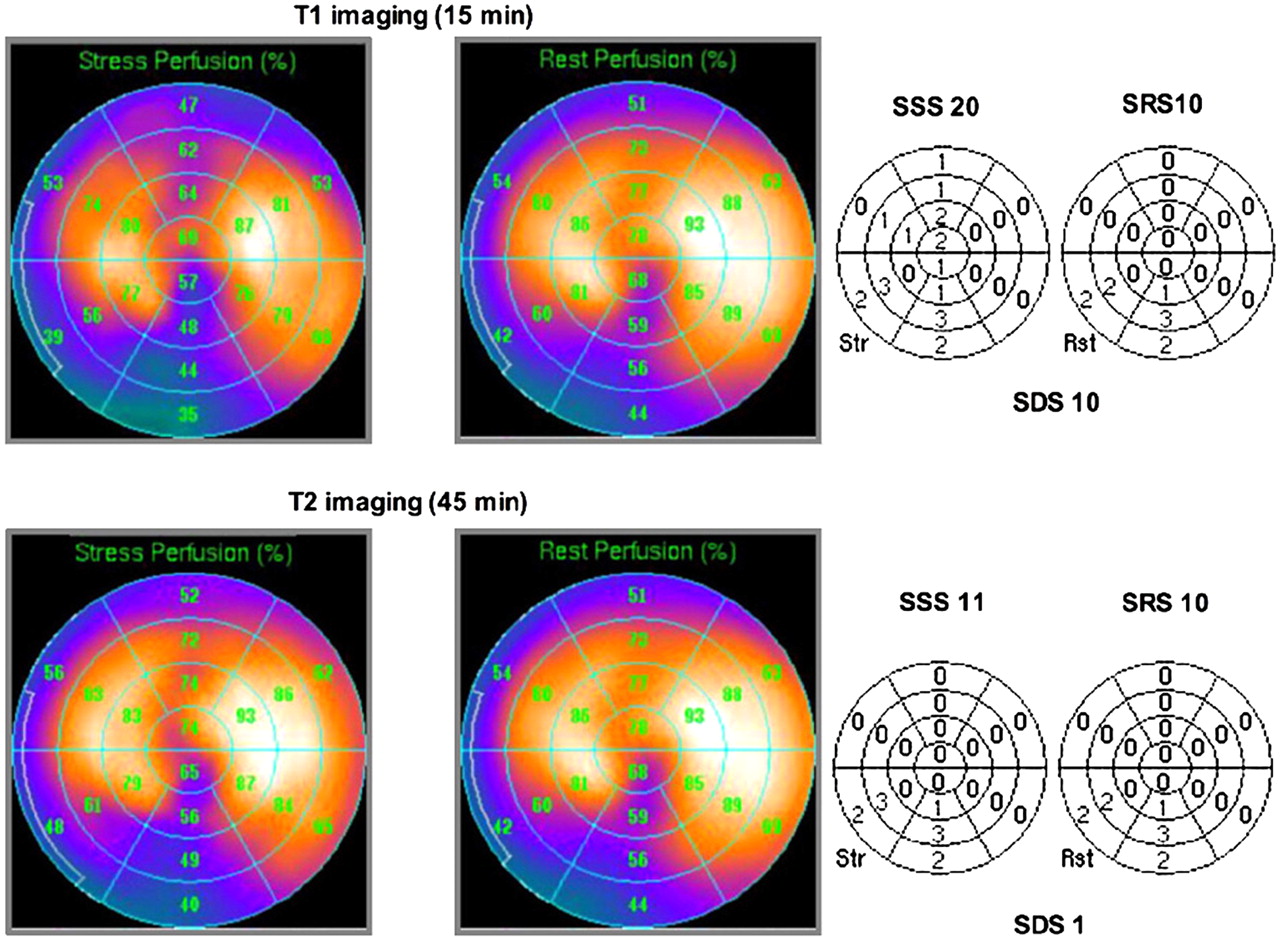
Perfusion bull's eyes (left) and relative quantitative perfusion SPECT scores (right) in patient with previous myocardial infarction and double-vessel disease. (Top) Early imaging identified fixed perfusion defect of inferior wall and reversible defect of anterior and anteroseptal walls, resulting in SDS of 10. (Bottom) Standard delayed imaging failed to identify reversible defect in territory of left anterior descending coronary artery, resulting in SDS of 1. Therefore, 2 different clinical messages were obtained from same patient: previous inferior myocardial infarction plus anterior myocardial ischemia using early imaging and previous inferior infarction without ischemia using standard delayed scans.
Semiquantitative Analysis of Myocardial Function.
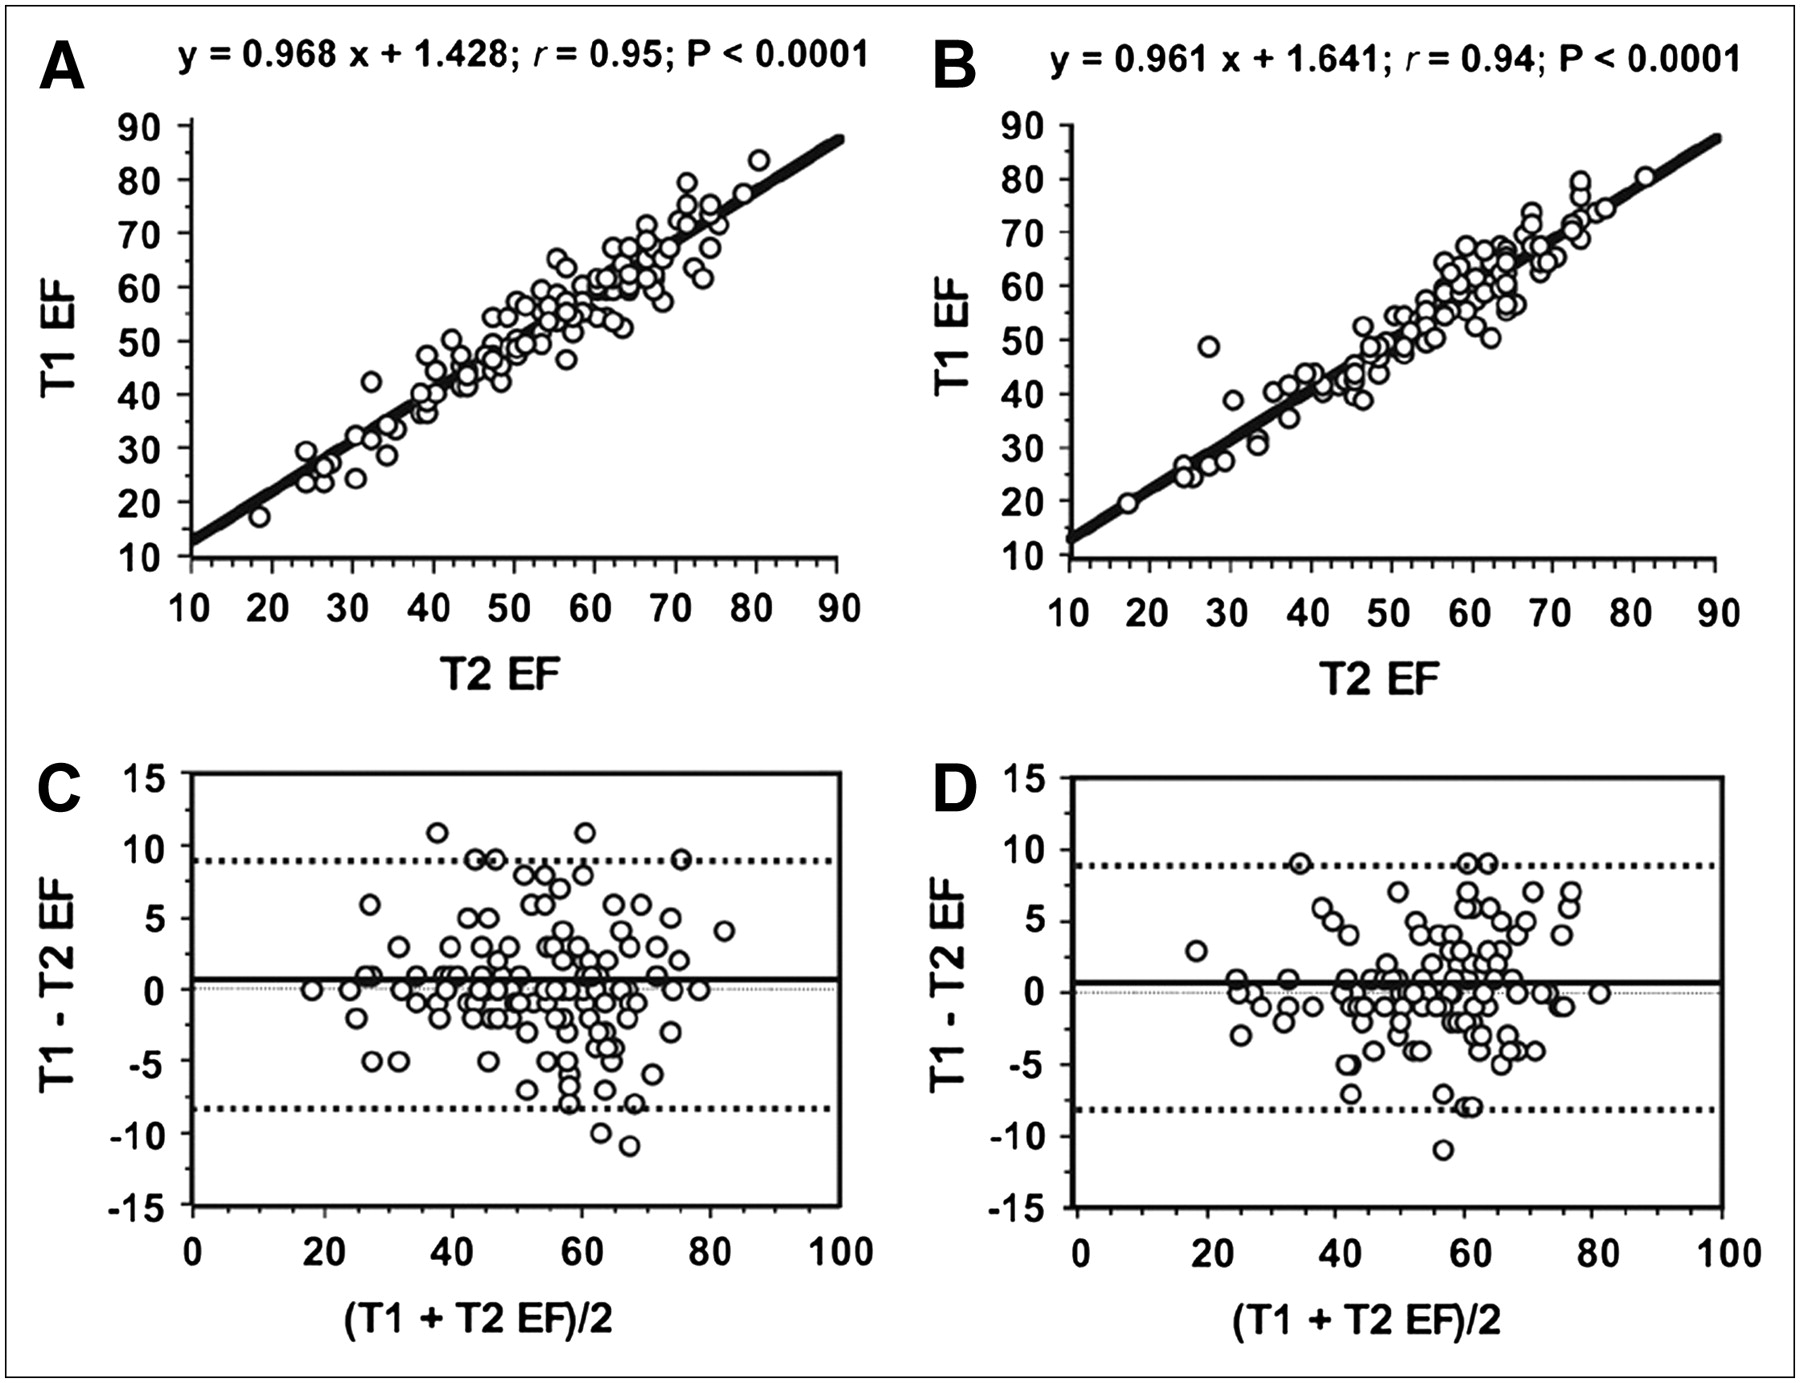
Mean poststress EFs were similar in T1 and T2 imaging (0.53 ± 0.12 vs. 0.53 ± 0.13, P = NS). Linear regression analysis showed a good correlation between T1 and T2 poststress EFs (y = 0.968x + 1.428; r = 0.95; SEE = 0.03; P < 0.0001) (Fig. 4). The Bland–Altman method showed a shift in the mean value of the difference (T1 − T2 EF) of +0.29 ± 4.22 (range, −11.0 to 11.0, 95% confidence interval, −8.1 to +8.7) (Fig. 4).

(A and C) Linear regression analysis (A) showed good correlation between T1 and T2 poststress EFs (y = 0.968x + 1.428; r = 0.95; SEE = 0.03; P < 0.0001), whereas Bland–Altman method (C) showed good agreement between the 2 sets of measures. (B) Similarly, linear regression analysis showed good correlation between T1 and T2 resting EFs (y = 0.961x + 1.641; r = 0.94; SEE = 0.03; P < 0.0001). (D) Bland–Altman method showed shift in mean value of difference of +0.51 ± 4.13.
Mean EFs at rest were similar between T1 and T2 imaging (0.54 ± 0.12 vs. 0.53 ± 0.12, P = NS). Linear regression analysis showed a good correlation between T1 and T2 resting EFs (y = 0.961x + 1.641; r = 0.94; SEE = 0.03; P < 0.0001). The Bland–Altman method showed a shift in the mean value of the difference (T1 − T2 EF) of +0.51 ± 4.13 (range, −11.0 to 22.0, 95% confidence interval, −7.76 to +8.76) (Fig. 4).
Myocardial Function in Patients with Discrepancies Between T1 and T2 SDS.
In patients with differences between T1 and T2 SDS, mean poststress EF was similar under the 2 conditions (0.54 ± 0.12 vs. 0.53 ± 0.13, P = NS). However, mean poststress summed motion score was significantly higher in T1 than in T2 scans (11 ± 13 vs. 8 ± 11, P < 0.001). In this subgroup of patients, neither mean EF nor summed motion score at rest was statistically different (P = NS).
DISCUSSION
To our knowledge, this was the first study exploring the feasibility and clinical accuracy of a tetrofosmin gated SPECT early-imaging protocol. Early acquisition provided clinical information the same as, and in a discrete subset of patients more accurate than, that provided by the standard delayed protocol, suggesting the possibility of significantly reducing imaging time while increasing diagnostic accuracy.
Comparison of Early and Delayed Perfusion Imaging
The idea of performing early myocardial imaging with tetrofosmin is not new (8,13). Matsunary et al. (8) tested the feasibility of early SPECT at rest in 13 healthy volunteers and concluded that, to avoid technical artifacts that could result in false-positive findings, performing delayed scans was better. Important limitations of this study included the relatively small number of patients, the impossibility of extending the conclusions to stress imaging, and the absence of any data on subjects with known coronary anatomy. Indeed, the presence of intense liver activity adjacent to the inferior wall could cause an oversubtraction of radiotracer counts from the inferior wall when filtered backprojection is applied but could also result in an inverse relationship with the subtracted counts in the reconstructed images (7). It is conceivable that attenuation correction algorithms or iterative reconstruction could reduce the influence of background activity on actual count density in the inferior wall (14). In our study, we performed neither attenuation correction nor iterative reconstruction. Additionally, images were suitable for clinical interpretation, and changes in subdiaphragmatic activity from T1 to T2 did not alter the global count density in the heart. Furthermore, we performed a clinically oriented evaluation demonstrating that a tetrofosmin gated SPECT early-imaging protocol is technically feasible and as clinically accurate as standard delayed imaging in subjects with known coronary anatomy.
Pathophysiologic Implications of Early Myocardial Perfusion Imaging
In our study, we found consistent discrepancies between T1 and T2 SDS in 44% of patients. This finding could have some pathophysiologic explanations. In fact, the regulation of regional perfusion is dependent on many variables, but the ischemic event is closely and inversely related to the time from its induction by stress. Theoretically, the earlier the scintigraphic acquisition, the higher the probability of defining the severity and extent of ischemia. It is conceivable that near the time of the stress, ischemia induces a more pronounced wall thinning that could determine, through the partial-volume effect, a more evident perfusion defect.
Additionally, tetrofosmin could also become partially redistributed with time. Schulz et al. reported that the relative washout fraction per hour for tetrofosmin was 8.3% ± 9.9% in areas with a stress-induced defect (15). Ito et al. found that tetrofosmin showed a kinetic behavior similar to that of 201Tl and that the optimal imaging time was within 10–35 min after exercise (16). Although we did not perform any regional measure of radiotracer washout, our data were in indirect agreement with those reported above demonstrating differences between early and delayed distribution of radiotracer (SDS difference) that could be attributed to a more severe poststress defect in T1 imaging. Thus, our data suggested that early tetrofosmin imaging could have an important clinical impact, identifying ischemia more accurately in terms of severity and extension.
Comparison of Left Ventricular Function on Early and Delayed Imaging
Our data showed a similar mean EF in T1 and T2 imaging both after stress and at rest. However, in patients with discrepancies in myocardial perfusion between the 2 sets of scans, the analysis of regional wall motion resulted in higher T1 poststress summed motion scores.
Transient ischemia can produce perfusion defects associated with left ventricular contractile dysfunction, and one third of patients show persistent dysfunction (17,18). The association between perfusion defects and wall motion abnormalities could have important pathophysiologic and clinical implications. It has been shown that poststress stunning is more sensitive than a resting abnormality of regional wall motion and is highly specific to severe angiographic stenosis (19). Because this phenomenon is time-dependent, in some patients standard delayed imaging could miss this information, reducing the potential diagnostic power of gated SPECT.
Study Limitations
We performed an automatic analysis of myocardial perfusion imaging. Because quantitative perfusion SPECT software does not include reference data files for early acquisitions, either poststress or at rest, early imaging was compared with the available standard database, possibly generating apparent perfusion defects. However, this possibility is not in keeping with the higher diagnostic accuracy demonstrated by T1 imaging, when compared with T2 imaging. Future application of early imaging should include a more appropriate database of healthy individuals studied at 15 min, or at least a specific reference group for normal findings on tetrofosmin gated SPECT.
CONCLUSION
Early stress and rest tetrofosmin imaging is feasible and does not lessen image quality. Globally, early scans show accuracy identical to that of standard delayed scans in identifying coronary artery disease. In a discrete subset of patients, early acquisition allowed the identification of more severe myocardial ischemia associated with regional wall motion abnormalities. Therefore, our data demonstrate that early myocardial imaging with tetrofosmin can provide clinical information the same as, and in some cases even more accurate than, that provided by the standard delayed scan, reducing total imaging time. Reduction of imaging time is mandatory for improving both patient compliance with the study and the logistics of nuclear cardiology laboratories.
Acknowledgments
We are indebted to Ilaria Citti and to Adrian Holden, MD, for their expert review of the manuscript and to Laura Bruselli, MD, and all the Myoview Imaging Optimization study investigators from the 9 Italian centers (CNR Pisa, 22 patients; nuclear medicine departments from Pisa, 11 patients; S. Giovanni Rotondo, 21 patients; Massa-Carrara, 10 patients; Brescia, 12 patients; Napoli, 20 patients; Ancona, 7 patients; La Spezia, 5 patients; and Castelfranco Veneto, 12 patients) who helped us in the examination of the study subjects.
Footnotes
-
COPYRIGHT © 2007 by the Society of Nuclear Medicine, Inc.
References
- Received for publication February 13, 2007.
- Accepted for publication June 27, 2007.


Jump to section
Related Articles
Cited By...
- Cadmium-Zinc-Telluride Myocardial Perfusion Imaging in Obese Patients
- Semiconductor Detectors Allow Low-Dose-Low-Dose 1-Day SPECT Myocardial Perfusion Imaging
- Comparison Between Ultrafast and Standard Single-Photon Emission CT in Patients With Coronary Artery Disease: A Pilot Study
- Nuclear Myocardial Perfusion Imaging with a Cadmium-Zinc-Telluride Detector Technique: Optimized Protocol for Scan Time Reduction
- Single-Shot Cardiorenal Scintigraphy with 99mTc-Tetrofosmin: A Dynamic Characterization at Rest and During Adenosine Infusion
- Half-Time SPECT Myocardial Perfusion Imaging with Attenuation Correction