


Abstract
18F-Labeled substance P antagonist–receptor quantifier ([18F]SPA-RQ) [2-fluoromethoxy-5-(5-trifluoromethyl-tetrazol-1-yl)-benzyl]-[(2S,3S)-2-phenyl-piperidin-3-yl)amine] is a selective radioligand for in vivo quantification of tachykinin NK1 receptors with PET. The aims of this study were to estimate the radiation safety profile and relative risks of [18F]SPA-RQ with 3 different methods of image analysis. Methods: Whole-body PET images were acquired in 7 healthy subjects after injection of 192 ± 7 MBq (5.2 ± 0.2 mCi) [18F]SPA-RQ. Emission images were serially acquired at multiple time-points from 0 to 120 min and approximately 180–240 min after injection. Urine samples were collected after each imaging session and for 24 h after the last scan to measure excreted radioactivity. Horizontal tomographic images were compressed to varying degrees in the anteroposterior direction to create 3 datasets: thin-slice, bisected, and 2-dimensional (2D) planar images. Regions of interest were drawn around visually identifiable source organs to generate time–activity curves for each dataset. Residence times were determined from these curves, and doses to individual organs and the body as a whole were calculated using OLINDA/EXM 1.0. Results: The lungs, upper large intestine wall, small intestine, urinary bladder wall, kidneys, and thyroid had the highest radiation-absorbed doses. Biexponential fitting of mean bladder and urine activity showed that about 41% of injected activity was excreted via urine. Assuming a 2.4-h urine voiding interval, the calculated effective doses from thin-slice, bisected, and 2D planar images were 29.5, 29.3, and 32.3 μSv/MBq (109, 108, and 120 mrem/mCi), respectively. Conclusion: Insofar as effective dose is an accurate measure of radiation risk, all 3 methods of analysis provided quite similar estimates of risk to human subjects. The radiation dose was moderate and would potentially allow subjects to receive multiple PET scans in a single year. Individual organ exposures varied among the 3 methods, especially for structures asymmetrically located in an anterior or posterior position. Bisected and 2D planar images almost always provided higher organ dose estimates than thin-slice images. Thus, either the bisected or 2D planar method of analysis appears acceptable for quantifying human radiation burden, at least for radioligands with a relatively broad distribution in the body and not concentrated in a small number of radiation sensitive organs.
The 11-amino-acid neuropeptide substance P (SP) and its preferred receptor, the tachykinin neurokinin type 1 (NK1) receptor, are widespread throughout the mammalian nervous system (1). SP has been proposed to play a role in several neurologic and psychiatric diseases (2–10). However, to date, NK1 receptor antagonists have only found proven efficacy in the prevention of acute and delayed chemotherapy-induced nausea and vomiting (2), despite extensive preclinical and clinical work suggesting utility in pain, anxiety, depression, schizophrenia, Rett's syndrome, Parkinson's disease, and Alzheimer's disease (3–10). The widespread distribution of central SP pathways and NK1 receptors in the human brain in vivo is somewhat enigmatic given the apparent lack of effect of drugs designed to block these systems in so many central disorders. Detailed study of these systems in health and neurologic disease is a potentially important topic for research because it could identify opportunities for future clinical trials with NK1 receptor antagonists.
18F-Labeled SP antagonist–receptor quanitifier ([18F]SPA-RQ) [2-fluoromethoxy-5-(5-trifluoromethyl-tetrazol-1-yl)benzyl]-[(2S,3S)-2-phenyl-piperidin-3-yl)amine] is a highly selective radiopharmaceutical with a subnanomolar affinity for the human NK1 receptor in vitro. It has been used previously in guinea pig, monkey, and human PET studies (11,12). In these settings, [18F]SPA-RQ demonstrated high brain uptake, displacement by NK1-selective ligands, and low nonspecific binding. The absence of receptors in the cerebellum seems to facilitate quantification. Although its radiation dosimetry profile has been estimated in guinea pigs, nonhuman primates, and a small number of human research volunteers (13), a formal study of its safety has never been published. The first aim of the present study was to characterize its radiation safety profile in healthy humans by quantifying its whole-body biokinetics. The effective dose (ED) was calculated as the primary surrogate of radiation safety according currently prescribed weighting factors for each organ.
Modern PET cameras map the distribution of radioactivity in 3-dimensional (3D) volumes. These volumes can be parsed into tomographic slices and reinterpolated for analysis in any plane. The thickness of each tomographic slice is under the control of the imager. Although most PET scans are reformatted to produce slice thicknesses that vary from a few millimeters to about a centimeter, it is possible to compress all of the slices into a single, 2D image that looks much like a planar scintigram. Previous work conducted in our laboratory indicated that dosimetry analyses performed on single compressed planar images as opposed to multiple tomographic images were considerably less ticonsuming and provided only slightly higher (i.e., more conservative) values of estimated radiation doses (13). Thus, the second aim of the present study was to determine the efficacy and efficiency of using either a compressed 2D planar image or anteroposterior-bisected images instead of thin-slice images for the analysis of human whole-body dosimetry studies.
MATERIALS AND METHODS
Subjects
The study was mandated by the U.S. Food and Drug Administration under its approval of the Investigational New Drug application and approved by the Radiation Safety Committee of the National Institutes of Health (NIH), and the Institutional Review Board of the National Institute of Mental Health approved the use of [18F]SPA-RQ in human subjects for this study. The first 7 consecutively presenting subjects to meet selection criteria were enrolled: 4 male and 3 female healthy volunteers (mean age ± SD, 28 ± 7 y; age range, 23–40 y; weight, 77 ± 5 kg). These and subsequent data are expressed as the mean ± SD unless otherwise noted. Subjects gave informed, written consent and then completed a screening assessment no more than 3 mo before their PET scan. The assessment included a history, physical examination, electrocardiogram, and standard blood and urine analyses to ensure that subjects were free of any medical or neuropsychiatric illnesses. The laboratory tests included a complete blood count, serum chemistries, thyroid function test, urinalysis, urine drug screen, as well as syphilis, HIV, and hepatitis B screenings. Approximately 24 h after the administration of the tracer, subjects returned to repeat the complete blood count, serum chemistries, and urinalysis.
Radiopharmaceutical Preparation
The chemical precursor, (2S-cis)-3-[[[2-hydroxy-5[5-(trifluoromethyl)-1H-tetrazol-1-yl]phenyl]methyl]amino]-2-phenyl-1-piperidinecarboxylic acid 1,1-dimethylethyl ester, was obtained from Merck Research Laboratories, and the radioligand, [18F]SPA-RQ, was prepared according to the route and method originally described by Solin et al. (11), but with significant modifications as described by Chin et al. (14). For the present study, the radiochemical purities of all syntheses of [18F]SPA-RQ were assessed with high-performance liquid chromatography and found to be >99% with an average specific activity of 46.6 ± 16.6 GBq/μmol (1.26 ± 0.45 Ci/μmol) at the time of injection.
PET Data Acquisition
Both a preinjection transmission scan and a series of dynamic emission scans were acquired using a GE Advance tomograph (GE Healthcare). The PET device was calibrated daily with a 137Cs source and cross-calibrated weekly to a well counter using a known amount of 18F activity contained in a 16-cm-diameter, cylindric phantom. Each subject was imaged in 7 contiguous 15-cm segments from the top of the head to a point below the gonads that varied depending on the height of the subject. To minimize extraneous motion, all subjects wore a mask that affixed their head in a single position and had their arms and abdomen wrapped with body-restraining sheets. Blood pressure, pulse, and respiration rates were obtained before the administration of [18F]SPA-RQ and at 3 time points during the emission scans.
Before injection of the radioligand, a 21-min transmission scan (3 min at each of the 7 body segments) using rotating 68Ge rods was acquired for subsequent attenuation correction. Then, an initial set of dynamic emission scans consisting of 14 cycles was acquired after the intravenous injection of about 192 ± 7 MBq (5.2 ± 0.2 mCi) of [18F]SPA-RQ. The acquisition of each cycle began with an emission scan at the first bed position (i.e., the head) and continued by moving the bed distally to the next body segment for a total of 7 segments. The scan of the seventh segment completed a cycle, and the bed was moved back to the original position. The initial scans that were acquired shortly after administration, when the redistribution of the radioactive material was relatively rapid, made temporal resolution a priority, whereas the later scans were longer to achieve higher spatial resolution. The length of time that each segment was imaged within each of the 14 cycles increased progressively as follows: 4 × 0.25, 3 × 0.5, 3 × 1, 3 × 2, and 1 × 4 min. The 6 movements of the bed between segments 1 through 7 required 3 s each, and the repositioning of the bed after the completion of each of the cycles required 13 s. Thus, the total length of the initial emission scan set was about 120 min.
After the completion of the first emission scan set, the subjects were allowed to rest for about 30 min. During this time, all voided urine was collected for measurement of radioactivity. The subjects then returned to the scanner and was positioned in, and affixed to, the same approximate location on the bed as for the first scan. A second 21-min transmission scan, identical to the first, was performed followed by a second set of dynamic emission scans that began about 3 h after injection of radioligand. The emission scan consisted of 2 cycles with segment imaging times of 4 min each for a total scan time of about 60 min. After completing all scans, the subject was asked to void before leaving NIH so the activity in urine could be measured. The subject went home with a 24-h urine collection container, and we measured urine radioactivity the next day. Radioactivity was measured with a γ-counter that was cross-calibrated with the GE Advance scanner.
Image Analysis
The 256 original tomographic PET slices were reinterpolated in the anteroposterior (i.e., coronal) direction to create 3 whole-body image groups: (a) thin-slice, (b) bisected, and (c) 2D planar:
(a)Thin-slice images: Multiple sets of 6 contiguous tomographic slices without any gaps between them were added together for the thin-slice image set and had a final slice thickness of about 1.2 cm.
(b)Bisected: Two sets of 128 tomographic slices were compressed for the bisected images. In effect, this roughly divided the body through the midcoronal plane to create an anterior and a posterior “conjugate-like” planar image set.
(c)2D planar images: A single image containing all 256 tomographic slices compressed into a single coronal image was constructed as shown in Figure 1.
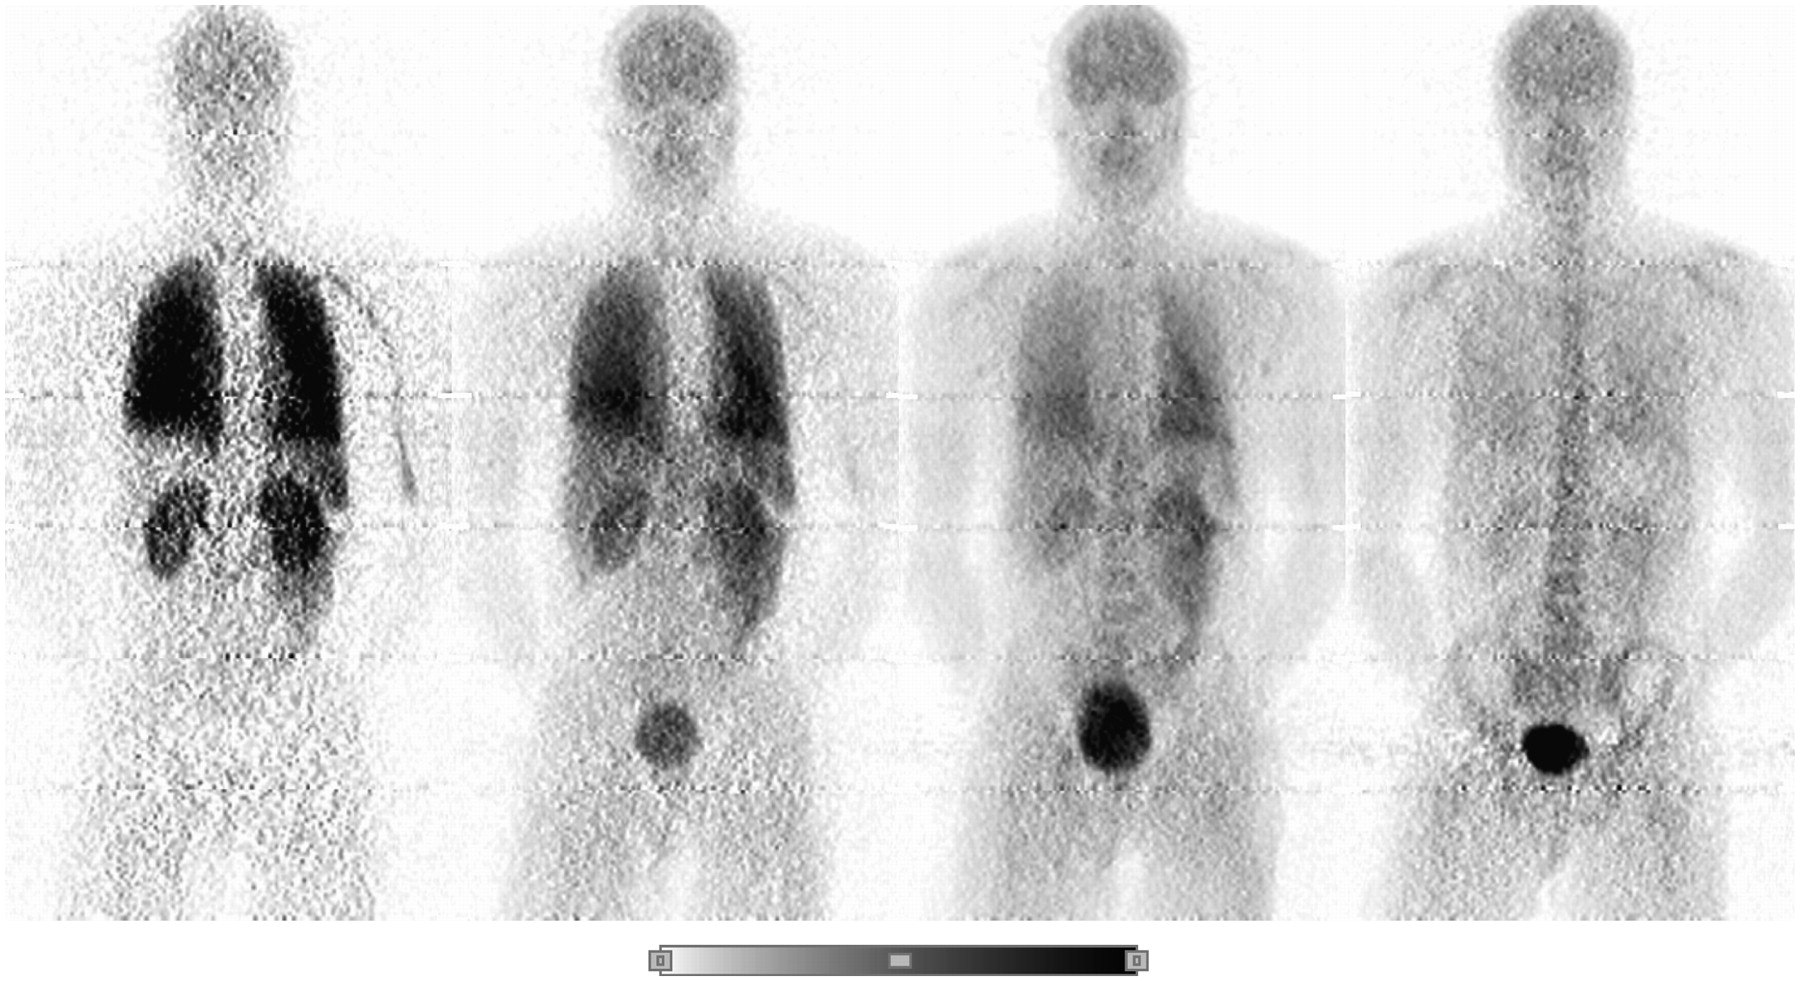
Example of a series of whole-body 2D planar PET images for one healthy male. Images were obtained approximately 2, 20, 100, and 240 min after intravenous injection of about 192 ± 7 MBq (5.2 ± 0.2 mCi) of [18F]SPA-RQ. All 4 decay-corrected images used the same color scale (bottom of figure).
All 3 sets of images were analyzed using PMOD 2.61 (pixelwise modeling computer software; PMOD Group, Zurich, Switzerland).
A “source organ” was defined as any region that took up enough radioactivity to be visualized on the images and thus become a radioactivity emitter that was capable of exposing nearby tissues to radiation. The whole brain, thyroid, heart, right lung, right kidney, liver, and testes were all identifiable as source organs on the thin-slice images. Regions of interest (ROIs) were drawn around each of these structures on each of the slices in which they appeared by a single operator and subsequently reviewed by other investigators before the analyses. Once approved, these ROIs were propagated across all 16 acquisition time points. The right lung was selected to avoid the heart, and total activity in the lungs was calculated assuming that the right lung would account for 55% of total uptake (15). Though the right kidney partially overlapped the liver, it was easier to identify on the images than the left kidney, which was often occluded by diffuse activity in the abdominal cavity and the spleen. Total uptake of activity in the kidneys was calculated as twice that of the right kidney.
In addition to the previously mentioned source organs, the intestines, urinary bladder, and red marrow showed moderate levels of [18F]SPA-RQ uptake. A ROI was drawn around the entire area enclosed by the lateral abdominal walls from the inferior borders of the liver and diaphragm to the superior dome of the urinary bladder. After subtracting the activity in kidneys from the total activity encompassed by this large ROI, the remainder was assigned to the intestines. Individual ROIs were drawn around the urinary bladder at each time point to account for the changing size of the bladder as it accumulated urine. The activity in these separate urinary bladder ROIs was then summed to represent total bladder uptake. [18F]SPA-RQ exhibited very low levels of defluorination in human subjects; only marrow-rich bone structures (e.g., vertebrae, pelvis, and skull) exhibited uptake of the radioligand. In contrast, the marrow-poor diaphyses of tubular bones were not visible. Thus, all bone-related uptake of the tracer was assumed to derive from red marrow. This uptake was quantified by drawing a horseshoe-shaped ROI around the superior and lateral aspects of the skull. Total red marrow uptake was calculated by conservatively estimating that the skull accounted for 8% of all red marrow uptake (15).
All of the above organs were identified and assigned ROIs on both the bisected and 2D planar images. If an organ appeared in both the anterior and posterior slices of the bisected images, ROIs were drawn around the structure on both slices. For both the bisected and the 2D planar image analyses, large ROIs were drawn surrounding each source organ to ensure that all accumulated radioactivity within a particular organ was included. Although the heart, testes, and thyroid were not always as clearly visible as the other source organs on the bisected and 2D planar images, the regions could still be drawn with moderate confidence using other structures as anatomic landmarks. The inclusion of the testes and, to a lesser extent, the thyroid and red marrow as source organs was significant because of their sensitivity to radiation and relatively high weighting factors in the calculation of the overall ED. For all 3 image sets, the activity in the “remainder of the body” was calculated as the residual activity from the sum of the midpoint time measurements of all source organs.
Residence Time Calculation
The nondecay–corrected activity from each source organ, with the exception of the urinary bladder and the intestines, was converted to a percentage of the injected activity (IA). A time–activity curve was created for each organ by plotting the percentage of IA versus time. The area under an organ's activity curve from time zero to infinity is equal to residence time. The trapezoidal rule was used to calculate the area under the curve from the time of injection to the time image acquisition terminated. By convention in the field, any further decline in activity was assumed to occur only through physical decay without any biologic clearance.
Many of the source organs were not confined to a single 15-cm bed position, resulting in multiple acquisition time points for single organs. In these cases, new time points were generated before creating the organ's activity curve. A more accurate mean acquisition time for affected organs was obtained by averaging the time points associated with each bed position in which the organ appeared.
The residence time of the urinary bladder was determined using the dynamic bladder model (16) in OLINDA/EXM 1.0 (Organ Level Internal Dose Assessment/Exponential Modeling computer software; Vanderbilt University, 2003) (17). Voiding intervals of 0.6, 1.2, 2.4, and 4.8 h were used to calculate several different residence times to determine their effect on dose estimates to the urinary bladder wall. Because subjects were allowed to urinate between the 2 emission scans, activity in the urinary bladder ROIs had to be corrected for excretion. Total urine excretion during the first scanning session of about 2 h was equal to the amount of activity in the urinary bladder ROIs. Summing the activity contained in the urine collected during the break between the 2 emission scans with the activity found in the urinary bladder ROIs during the second emission scan provided values for total urine excretion up to about 4 h after injection. Finally, the urine activities from the 2-, 4-, and 24-h postinjection urine collections were summed for each subject to provide a final value for total urine excretion. A cumulative urine activity curve was generated for each subject and fitted with a biexponential curve to determine the total urine excretion as a fraction of IA. The formula for the biexponential curve was: y = a1(1 − e−λt) + a2(1 − e−γt), where y is total urine excretion as a fraction of IA, a1 + a2 equals the total measured urine excretion as a fraction of IA, λ and γ are the 2 exponential rate constants, and t equals time. The sum of the 2 intercepts was restricted to values between 0 and 1: 0 > a1 + a2 < 1. The total urine excretion as a fraction of IA was converted into an ED for the urinary bladder wall in OLINDA/EXM 1.0.
One subject failed to return her 24-h urine collection; total urinary excretion for this person was calculated as the average of the other subjects. A second subject's 2- and 4-h postinjection urine collections demonstrated activities that were inconsistent with the data obtained from the PET images. This discrepancy was assigned to an error in the γ-counter used to measure the activity of the urine. Two- and 4-h urine activities were determined for this subject by assuming that he or she was able to void the entire amount of activity accounted for in the urinary bladder ROIs at the final time points of the first and second emission scans, respectively.
The residence times for the upper large intestine (ULI), lower large intestine (LLI), and small intestine were calculated in OLINDA/EXM 1.0 using the ICRP 30 gastrointestinal model (18). The model requires a value for the amount of activity that enters the small intestine. This value was equal to the largest decay-corrected fraction of IA encompassed by the intestinal ROI. The final organ absorbed doses were determined for each subject using the residence times calculated and were based on the MIRD scheme of a 70-kg adult male (19).
RESULTS
Intravenous injection of [18F]SPA-RQ produced no clinically observable effects. Blood pressure, pulse, and respiratory rates showed no significant change from baseline values. In addition, blood and urine tests performed approximately 24 h after the administration of the tracer showed no significant changes from the results obtained at the subjects' initial screening assessments.
The brain, thyroid, lungs, heart, liver, kidneys, intestines, urinary bladder, testes, and red marrow were all identified as source organs on 2D planar (Fig. 1), bisected, and thin-slice image sets. The lungs had the highest uptake of [18F]SPA-RQ with an average peak activity of 53 %IA (n = 7) at about 2 min after injection, measured on the thin-slice dataset. The red marrow, liver, and kidneys also exhibited relatively high uptake of radioactivity with respective peak values of 9.5, 9.4, and 8.7 %IA, whereas the brain, heart, thyroid, and testes had peak uptakes of 3.4, 1.0, 0.3, and 0.1 %IA, respectively. With the exception of the liver, testes, and red marrow, where uptake reached its peak between 25 and 35 min after injection, all activity for the above organs peaked within 15 min of the administration of the tracer (Fig. 2). The average decay-corrected activity encompassed by the intestinal ROI reached its peak value of 18 %IA approximately 30 min after injection (Fig. 3). Although it was possible to identify the testes on the early images when much of the radioactive material seemed to be in the vascular and extracellular compartments, a pattern suggestive of specific uptake was not observed in any of the men. The uterus or ovaries were never visualized in women.
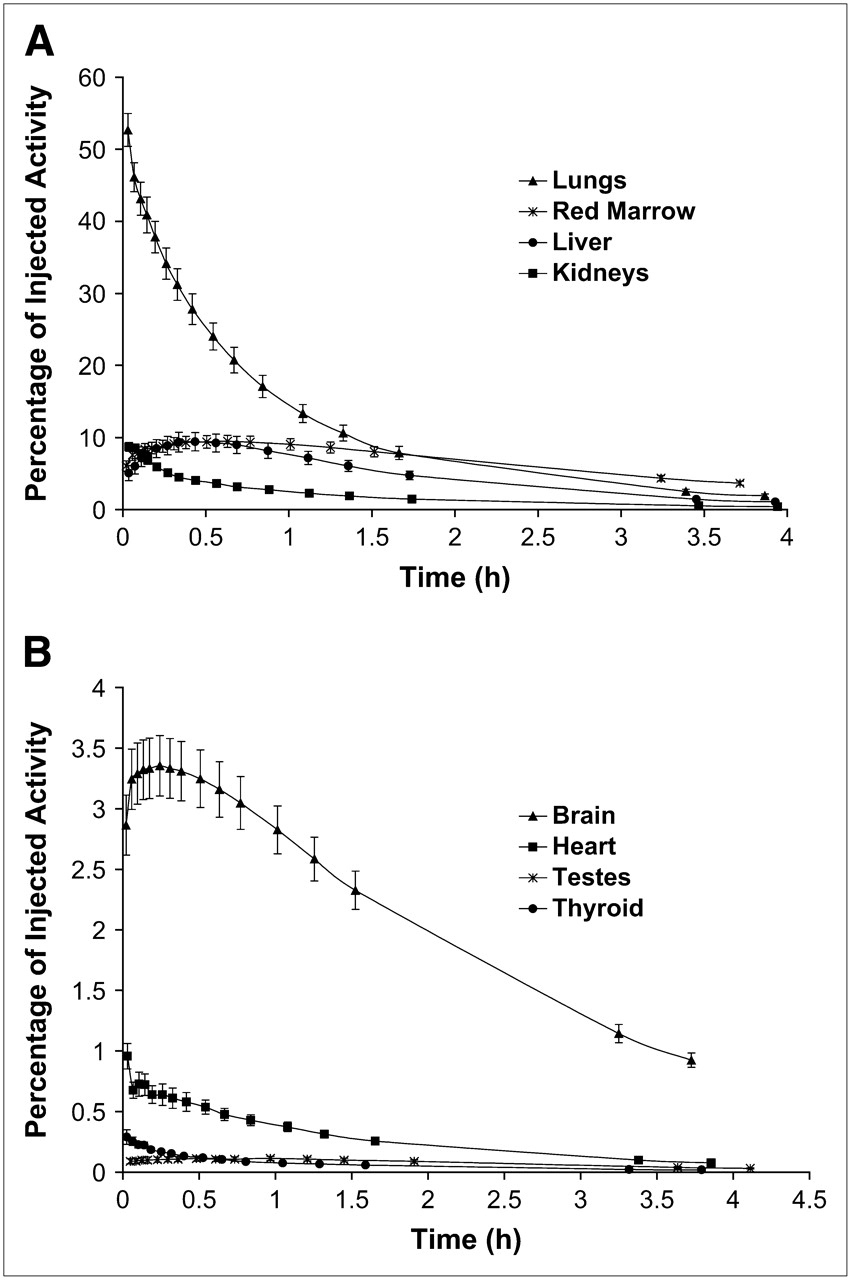
(A and B) Time–activity curves for visually identifiable organs with both high (A) and low (B) uptake of activity after injection of [18F]SPA-RQ. Activity data were determined from analysis of thin-slice images and are expressed, without correction for radioactive decay, as mean ± SEM of 7 subjects.
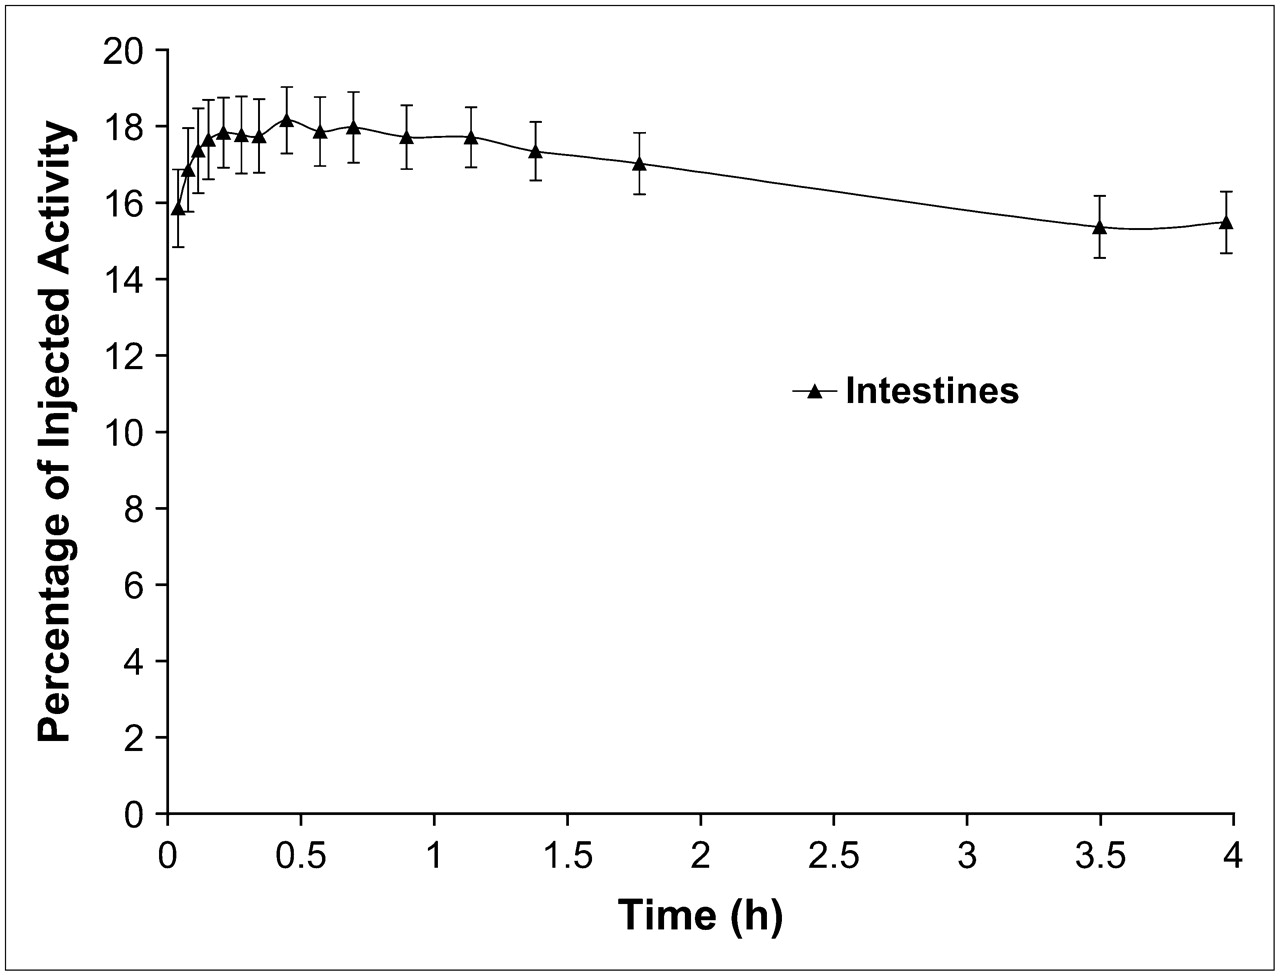
Time–activity curve for ROI surrounding intestines after injection of [18F]SPA-RQ. Activity data were determined from analysis of thin-slice images and are expressed, with correction for radioactive decay, as mean ± SEM of 7 subjects.
The average cumulative urine activity of the 7 subjects was fit with a biexponential curve using PRISM (version 4.0) software (GraphPad Software). For some subjects, the program was unable to fit the data. In these cases, a few of the initial data points were excluded, because the activity at these times was minimal and likely highly variable. The asymptote of the biexponential curve fit to the mean urinary activity data determined from the thin-slice images indicated that 41 %IA was excreted via urination (Fig. 4). The biologic half-lives were 2.9 and 8.3 h. The r2 value of the biexponential curve was 0.999, suggesting a high goodness of fit.

Cumulative urine excretion of decay-corrected radioactivity after injection of [18F]SPA-RQ. Data are expressed as mean ± SEM of 7 subjects. Biexponential curve was created with PRISM software (version 4.0). Asymptote of curve shows that about 41 %IA was excreted via urine.
The mean residence times of all source organs from all 3 analyses, with the exception of the intestines and urinary bladder, are displayed in Table 1. The data suggest the greatest variations in residence times occurred between the thin-slice and 2D planar image analyses. Additionally, organs that are asymmetrically localized in either the anterior or posterior aspect of the body (specifically the heart, kidneys, testes, and thyroid) showed the greatest degree of variance. Because the 2D planar image compressed all of the organs into a single horizontal plane, the ROIs encompassed activity both anterior and posterior to these localized organs and overestimated uptake and residence times. Because the body was split into anterior and posterior slices for the bisected images, the residence times obtained from this analysis were more similar than the 2D planar data to the thin-slice values.
Mean Residence Times of Identified Source Organs
The residence time of the red marrow was significantly higher for the thin-slice analysis than that for the bisected or 2D planar methods. As described in Materials and Methods, activity in red marrow was determined with a ROI overlying the skull. The horseshoe-shaped ROI drawn on bisected and 2D planar coronal images only accounted for activity confined to the superior and lateral aspects of the frontoparietal and temporal bones. In contrast, the thin-slice images showed the anterior portion of the frontal bone as well as the posterior portion of the parietal and occipital bones. The activity from these regions was then added to that in the horseshoe-shaped region. As a result, the measured uptake of activity and the residence time were higher for the red marrow in the thin-slice image analysis than they were in the other 2 image sets. Although counterintuitive, the residence times of “remainder of body” residence times were lower for the bisected and 2D planar images than those for the thin-slice data. One would expect the source organ activities to be overestimated in the compressed bisected and 2D planar images. This was, in fact, the case for individual organs. However, the cumulative uptake of activity accounted for in all ROIs for each method of analysis was relatively uniform (varying, on average, 2%−4% between the 3 methods across all time points). Thus, the differences in the calculated uptake of activity in the red marrow in large part account for the variation in the remainder of body residence times among the 3 image sets.
Varying the urine voiding intervals between 0.6, 1.2, 2.4, and 4.8 h resulted in modest changes to the dose of the urinary bladder wall, and the overall EDs at the respective voiding intervals were 27, 28, 30, and 31 μSv/MBq, respectively. Table 2 displays both the absorbed radiation doses of all pertinent organs and the overall EDs with an assumed urine voiding interval of 2.4 h for all 3 methods of analysis.
Radiation Dose Estimates for [18F]SPA-RQ in Standard Reference Man
The organs with the highest absorbed radiation doses in the thin-slice image analysis were the lungs (82 μGy/MBq), ULI wall (78 μGy/MBq), small intestine (70 μGy/MBq), urinary bladder wall (57 μGy/MBq), and kidneys (56 μGy/MBq). Similarly, these organs, as well as the thyroid, had the highest absorbed doses in both the bisected and 2D planar image analyses.
The ratios displayed in Table 2 suggest the organ doses obtained from the bisected and 2D planar image analyses were most often comparable with those determined from thin-slice image analysis. Organs asymmetrically localized in either the anterior or posterior aspects of the body showed the greatest variation in doses when comparing the 2D planar and thin-slice values. Thus, the doses for these organs were always overestimated in the 2D planar analysis. The ULI wall, small intestine, and LLI wall, along with the red marrow and osteogenic cells, were the only organs with significantly lower radiation doses in the 2D planar images than those in the thin-slice images. The differences in the red marrow and osteogenic cell doses were expected because the ROI of these “organs” underestimated activity in bone in both the bisected and the 2-D planar images, as described. Doses to the intestines were lower in the bisected and 2D planar analyses because the images were more highly compressed than the thin-slice images. Some of the activity in the intestines was probably underestimated and was likely assigned instead to overlapping portions of the kidneys and liver.
DISCUSSION
Whole-body PET with the NK1 receptor radioligand [18F]SPA-RQ suggested that the truest estimate of the ED of the tracer was 29.5 μSv/MBq (109 mrem/mCi) based on careful analysis of thin-slice images. This value does not seem to be meaningfully different than those reported for many other 18F-labeled PET tracers, suggesting that the radiation risks are largely driven by the physical properties of the radioisotope as opposed to the biologic properties of the radiopharmaceutical. It follows that the risks from doses that are typically injected should be well within accepted levels for human subjects who will not benefit from participating in research studies. For example, about 340 MBq (9.2 mCi) would be required to produce an ED of 10 mSv (1 rem) in the standard Reference Man. Although estimates vary, an exposure of 10 mSv is thought to increase the lifetime risk of developing a radiation-induced cancer of about 1 in 10,000 (20). This compares favorably to a baseline risk rate that varies between about 1 in 3 to 1 in 4 (21).
Comparison of Methods
If the thin-slice method is viewed as the gold standard, then the bisected analysis provided more accurate measures of individual organ doses than did the 2D planar method. For example, doses to asymmetrically located organs (i.e., testes, heart wall, thyroid, and kidneys) from the bisected images were more similar than the 2D planar images to results from the thin-slice analysis. The medical significance of any of these differences for either method might be questionable, however, as the higher values represent more conservative estimates of radiation risk. In contrast, doses to the intestines, red marrow, and osteogenic cells were lower for the bisected and 2D planar methods than for the thin-slice analysis, largely because of unavoidable deficiencies in the way their ROIs were drawn.
Despite the variations in organ doses, the overall estimate of the primary surrogate for radiation risk, the ED, was similar between the 3 methods. The ED determined from the bisected images (29.3 μSv/MBq), differed by <1% from the thin-slice value (29.5 μSv/MBq). The 2D planar ED (32.3 μSv/MBq) was approximately 10% higher than the thin-slice value. Thus, the higher, and more conservative, 2D planar dose estimates appear to be a reasonable strategy for assessing the radiation safety profile of most internally administered radiopharmaceuticals. Nevertheless, thin-slice analysis may be indicated for some tracers that are highly localized to small, asymmetrically located organs, tissues, or tumors.
Although not relevant to patient safety, analyses of the compressed bisected and 2D planar images required considerably less effort than the thin-slice method and took 1/5th and 1/10th the amount of time, respectively. Some gain in the precision of measurement also seems likely because organ boundaries can be very hard to demarcate on thin slices, with relatively few counting statistics in them, when compared with added images. The use of combined PET/CT images, which were not available at our institution at the time of data acquisition, might allow more accurate identification of source organ boundaries, but it is not clear that the extra effort required to place ROIs on thin slices would produce a meaningful improvement in the quality of the estimates.
Pharmacologic Effects
The average injected mass dose of [18F]SPA-RQ was 4.6 nmol (2.1 μg). This tracer dose of the radiochemical did not produce any subjective or meaningful changes in laboratory blood tests, blood pressure, pulse, and respiration rate in any subjects. Therefore, [18F]SPA-RQ appears to be safe from both pharmacologic and radiation exposure standpoints.
Pulmonary Uptake
Uptake of radioactivity in lungs far exceeded that in any other organ, with a peak value of 53 %IA shortly after injection of [18F]SPA-RQ. The lungs of guinea pigs and humans contain high densities of NK1 receptors that readily bind radioligand antagonists (22,23). It might be that a sizeable proportion of the early lung activity reflected [18F]SPA-RQ binding to NK1 receptors, not just activity in the pulmonary blood volume. Quantification of specific pulmonary binding was not feasible in this study because no competing NK1 receptor antagonists were coadministered. Regardless, and despite the high initial uptake of radioligand, the dose to the lungs (82 μGy/MBq) was only moderately higher than that to other organs because of the relatively fast elimination of activity. Lung activity decreased by about 50% within 30 min of [18F]SPA-RQ injection.
Excretion
With the exception of the lungs, 4 excretory organs (i.e., ULI wall, small intestine, urinary bladder wall, and kidneys) had the greatest radiation burdens with doses of 78, 70, 57, and 56 μGy/MBq, respectively. The mean, decay-corrected cumulative activity in urine was 41 %IA, and that entering the small intestine was 18 %IA. Thus, excretion of radioactivity from [18F]SPA-RQ via the urine was about twice that of the hepatobiliary route.
Assessment of Risk
Some experts believe that a single measure of radiation exposure (i.e., ED) is the best way to assess an overall radiation safety profile and to communicate the corresponding risk to research subjects. For the radioligands listed in Table 3, the EDs showed relatively little variation. For those studies based on human biodistribution data, the ED differed by a factor of 1.5, from 194 to 290 μSv/MBq. Although these values may vary because of true differences in radiation exposure among the ligands, differences in experimental design and data analysis may have contributed to these variations. If these variations in ED are real, then dosimetry studies such as that presented here are perhaps moderately useful for assessing relative risk. If these differences merely reflect subtleties in experimental design and analysis, however, then the utility of dosimetry studies for neuroreceptor radioligands containing pure, or nearly pure, γ-emitting radionuclides would seem questionable.
Comparison of Radiation Burden of [18F]SPA-RQ with Other 18F-Labeled Radiopharmaceuticals
CONCLUSION
Whole-body PET with [18F]SPA-RQ demonstrated a radiation risk profile that would allow a subject to receive multiple injections of the radioligand in a single year. Bisected and 2D planar images almost always provided more conservative organ dose estimates than thin-slice images, which may actually be beneficial for patient safety. Coupled with savings in time of image analysis, these conservative dose estimates suggest that either the bisected or the 2D planar method is acceptable to measure human radiation burden for radiotracers with a fairly broad distribution in the body.
Acknowledgments
This research was supported by the Intramural Program of NIMH (project Z01-MH-002852-01). We gratefully acknowledge the staff of the NIH Clinical Center PET Department and Vanessa Cropley, Anil Ramachandran, Masanori Ichise, and Janet Sangare for the successful completion of this study.
References
- Received for publication August 3, 2006.
- Accepted for publication September 25, 2006.


Jump to section
Related Articles
Cited By...
- Dosimetry of [64Cu]FBP8: a fibrin-binding PET probe
- Biodistribution, Dosimetry, and Pharmacokinetics of 68Ga-CBP8: A Type I Collagen-Targeted PET Probe
- Imaging of the Striatal and Extrastriatal Dopamine Transporter with 18F-LBT-999: Quantification, Biodistribution, and Radiation Dosimetry in Nonhuman Primates
- Whole-Body Biodistribution and Radiation Dosimetry of 18F-GE067: A Radioligand for In Vivo Brain Amyloid Imaging
- Human Brain Imaging and Radiation Dosimetry of 11C-N-Desmethyl-Loperamide, a PET Radiotracer to Measure the Function of P-Glycoprotein
- Whole-Body Biodistribution and Radiation Dosimetry of the Human Cannabinoid Type-1 Receptor Ligand 18F-MK-9470 in Healthy Subjects