


Abstract
Precise and reliable assessment of left ventricular (LV) function and dimensions is prognostically important in cardiac patients. As the integration of SPECT and multislice CT into hybrid scanners will promote the combined use of both techniques in the same patient, a comparison of the 2 methods is pertinent. We aimed at comparing LV dimensions, muscle mass, and function obtained by electrocardiographically gated 64-slice CT versus gated-SPECT. Methods: Sixty patients (mean age, 64 ± 8 y) referred for evaluation of coronary artery disease underwent 99mTc-tetrofosmin gated SPECT and 64-slice CT within 4 ± 2 d. LV ejection fraction (LVEF), end-systolic volume (ESV), and end-diastolic volume (EDV) from CT were compared with SPECT. Additionally, LV muscle mass and quantitative regional wall motion were assessed in 20 patients with both methods. Results: CT was in good agreement with SPECT for quantification of LVEF (r = 0.825), EDV (r = 0.898), and ESV (r = 0.956; all P < 0.0001). LVEF was 59% ± 13% measured by SPECT and slightly higher but not significantly different by CT (60% ± 12%; mean difference compared with SPECT, 1.1% ± 1.7%; P = not significant). A systematic overestimation using CT for EDV (147 ± 60 mL vs. 113 ± 52 mL; mean difference, 33.5 ± 23.1 mL) and ESV (63 ± 55 mL vs. 53 ± 49 mL; mean difference, 9.3 ± 15.9 mL; P < 0.0001) was found compared with SPECT. A good correlation for muscle mass was found between the 2 methods (r = 0.868; P < 0.005). However, muscle mass calculated by SPECT was significantly lower compared with CT (127 ± 24 g vs. 148 ± 37 g; mean difference, 23.0 ± 12.2 g; P < 0.001). The correlation for regional wall motion between the 2 methods was moderate (r = 0.648; P < 0.0001). Conclusion: LVEF and LV functional parameters as determined by 64-slice CT agree over a wide range of clinically relevant values with gated SPECT. However, interchangeable use of the 2 techniques should be avoided for LV volumes, muscle mass, and regional wall motion because of variances inherent to the different techniques.
A precise and reliable assessment of left ventricular (LV) function and LV dimensions is prognostically important in various cardiac diseases (1). Quantifying the degree and extent of LV function provides an objective basis for the risk stratification and therapeutic strategy and allows for the sequential follow-up of the therapeutic response (2–4). Several noninvasive techniques are available for this purpose, including 2-dimensional echocardiography (5), electrocardiographically (ECG) gated SPECT (6–10), radionuclide ventriculography (5,10,11), MRI (11–14), and, more recently, multislice CT (15–18). ECG gated SPECT offers the potential to assess LV function (LV volumes, LV ejection fraction [LVEF], regional wall motion, wall thickening) and myocardial perfusion simultaneously within a single study. The widespread quantitative gated SPECT analysis software (QGS; Cedars-Sinai Medical Center, Los Angeles, CA) used for assessing LV function and LV volumes has been extensively validated against other imaging modalities, including planar radionuclide ventriculography (19), echocardiography (20,21), and, more recently, MRI (8,22,23), which has become the current reference standard for quantification of LVEF and evaluation of regional wall motion (13,14). Retrospective ECG gated multislice CT has proven an excellent sensitivity and specificity for the detection of coronary artery disease (CAD) (24–28). However, simultaneous LV function analysis was not routinely performed, thus not taking full benefit of the acquired data. Previously published results with the 4- and 16-slice CT scanners proved the feasibility and good results for the assessment of LV function and LV volumes in comparison with MRI (15–18,29). The latest CT generation with 64 slices will accelerate the widespread clinical use of CT for noninvasive CAD assessment. So far, no published data exist on a comparison of LV functional parameters with gated SPECT and 64-slice CT. The recently developed 64-slice CT scanners may improve morphologic and functional measurements as compared with 16- or 4-slice CT systems because of an increased spatial and temporal resolution (30).
Therefore, the purpose of this study was to evaluate LV dimensions, muscle mass, and function using retrospectively ECG gated 64-slice CT in comparison with gated SPECT.
MATERIALS AND METHODS
Patients
We studied 60 consecutive patients (44 men, 16 women; mean age ± SD, 64 ± 8 y; age range, 38–81 y) who were referred for gated SPECT 99mTc-tetrofosmin myocardial perfusion imaging (MPI) for evaluation of suspected or known CAD. Gated SPECT and 64-slice CT were performed within 4 ± 2 d during which there was no clinical event or intervention. Exclusion criteria for CT were renal insufficiency (serum creatinine level, >115 μmol/L), atrial fibrillation, hemodynamic instability, or known iodine contrast allergy. According to these criteria, 2 additional patients with renal insufficiency could not be enrolled. The study protocol was approved by the local ethics committee. Written informed consent was obtained from all subjects.
Gated SPECT
All patients underwent a single-day stress/rest protocol. In this protocol, 300 MBq of 99mTc-tetrofosmin were injected after 3 min of a 7-min infusion of intravenous adenosine at a standard rate of 140 μg/kg/min, as reported previously (31,32). After 45–60 min, the nongated acquisition of the stress study was performed. One hour after the first injection, 900 MBq of 99mTc-tetrofosmin were injected, and the gated image acquisition of the rest examination began 45–60 min later. Only gated data from the high-dose rest examination were included in the present analysis.
Data acquisition was performed with a dual-head detector hybrid SPECT/CT camera (Millenium VG and Hawkeye; GE Healthcare); a low-energy, high-resolution collimator; a 20% symmetric window at 140 keV; a 64 × 64 matrix; an elliptic orbit with step-and-shoot acquisition at 3° intervals over 180°; and a 20-s dwell time per stop were used. Acquisitions were gated for 16 frames per R–R cycle with an acceptance window of 50%. Immediately after acquistion of the SPECT images, low-dose CT for attenuation correction of perfusion data was performed by use of the GE Hawkeye system as reported previously (33). CT data were transformed into attenuation maps and used for reconstructing SPECT data using an iterative ordered-subsets expectation maximization (OSEM) algorithm with 2 iterations and 10 subsets.
Images were viewed on a dedicated workstation (eNTEGRA or Xeleris; GE Healthcare). LV volumes were calculated from the gated SPECT images using the commercially available software package QGS, as described previously (7). Briefly, the algorithm segments the LV, estimates and displays the endo- and epicardial surfaces, and the valve plane for every gating interval, calculates LV end-systolic volume (ESV) and end-diastolic volume (EDV), and derives the related LVEF by dividing stroke volume (EDV – ESV) by EDV. In addition, polar maps of perfusion and wall motion were acquired. In a subgroup of 20 patients, regional wall motion was assessed with the QGS software analysis, which offers automatic quantitative indices of regional wall motion. A 20-segment model was used as suggested by the American Heart Association (34) (Fig. 1). Additionally, LV myocardial mass was calculated in these 20 patients using the Emory Cardiac Toolbox (ECToolbox; Emory University, Atlanta, GA) software package, as LV myocardial mass cannot be calculated by the QGS software. LV systolic dysfunction was defined as LVEF < 50%. All volumetric data and regional wall motion analysis were assessed by an experienced observer who was unaware of the CT results.

Schematic representation of 20-segment model used for gated SPECT and 64-slice CT. 1 = anterior basal; 2 = anteroseptal basal; 3 = inferoseptal basal; 4 = inferior basal; 5 = inferolateral basal; 6 = anterolateral basal; 7 = anterior midventricular; 8 = anteroseptal midventricular; 9 = inferoseptal midventricular; 10 = inferior midventricular; 11 = inferolateral midventricular; 12 = anterolateral midventricular; 13 = anterior apical; 14 = anteroseptal apical; 15 = inferoseptal apical; 16 = inferior apical; 17 = inferolateral apical; 18 = anterolateral apical; 19 = apex anterior; 20 = apex inferior.
64-Slice CT
Data acquisition was performed with a 64-slice CT scanner (LightSpeed VCT; GE Healthcare). Scanning parameters were detector collimation of 64 × 0.625 mm, total z-axis coverage of 40 mm per rotation, gantry rotation speed of 0.35 s, tube voltage of 120 kV, a pitch of 0.20–0.26, and ECG modulated tube current ranging from 88 to 228 mA·s. First, 2 localization scans without contrast material were performed to obtain an anteroposterior and a lateral view of the chest. Using this, we positioned the imaging volume extending from the carina to the diaphragm. Test-bolus tracking with 15 mL of iodinated, nonionic contrast material was applied to calculate the exact arrival time of contrast agent to the coronary arteries, considering the proximal part of the ascending aorta as the region of interest. A total of 70–100 mL of iodinated, nonionic contrast agent (Ultravist, 370 mg/mL; Schering) was injected continuously into the antecubital vein (50–80 mL at 5.0 mL/s, then 20 mL at 3.5 mL/s), followed by a 50-mL saline flush injected at a flow rate of 3.5 mL/s. After this, scanning was initiated during a single inspiratory breath hold for an acquisition time of 5–7 s. For optimal heart-phase selection, retrospective ECG gating was used. Retrospective reconstruction of the image data was performed for acquisition of images starting from early systole (5% of R–R interval) and ending at the end of diastole (95% of R–R interval) using 10% steps. All images were reconstructed with an effective slice thickness of 0.625 mm. Reconstructed image data were transferred to a remote workstation (Advantage Windows 4.2; GE Healthcare) for postprocessing. CT images were analyzed by 2 experienced observers who were unaware of the SPECT results.
To calculate LVEF and volumes, endocardial contours were automatically drawn on both the end-systolic and end-diastolic 4-chamber long-axis, short-axis, and 2-chamber views and manually adjusted, excluding the large papillary muscles (Fig. 2). ESV and EDV were calculated using a commercially available software tool (QardIQ Analysis; GE Healthcare) (35). For muscle mass and regional wall motion analysis, short-axis images with 5-mm section thickness without intersection gap were obtained in the short-axis plane using a commercially available software tool (QardIQ Function; GE Healthcare), covering the entire LV from the base to the apex, as reported previously (36). Endo- and epicardial contours were drawn semiautomatically with manual adjustment. The first slice with a visible lumen during the entire cardiac cycle was defined as LV apex, whereas the base of the LV was defined as the most basal slice surrounded by at least 50% myocardium in all heart phases. Slices not suitable for analysis due to motion artifacts were excluded. From the resulting polar maps, quantitative regional wall motion was obtained for all 20 segments corresponding to the 20 segments assessed by SPECT.
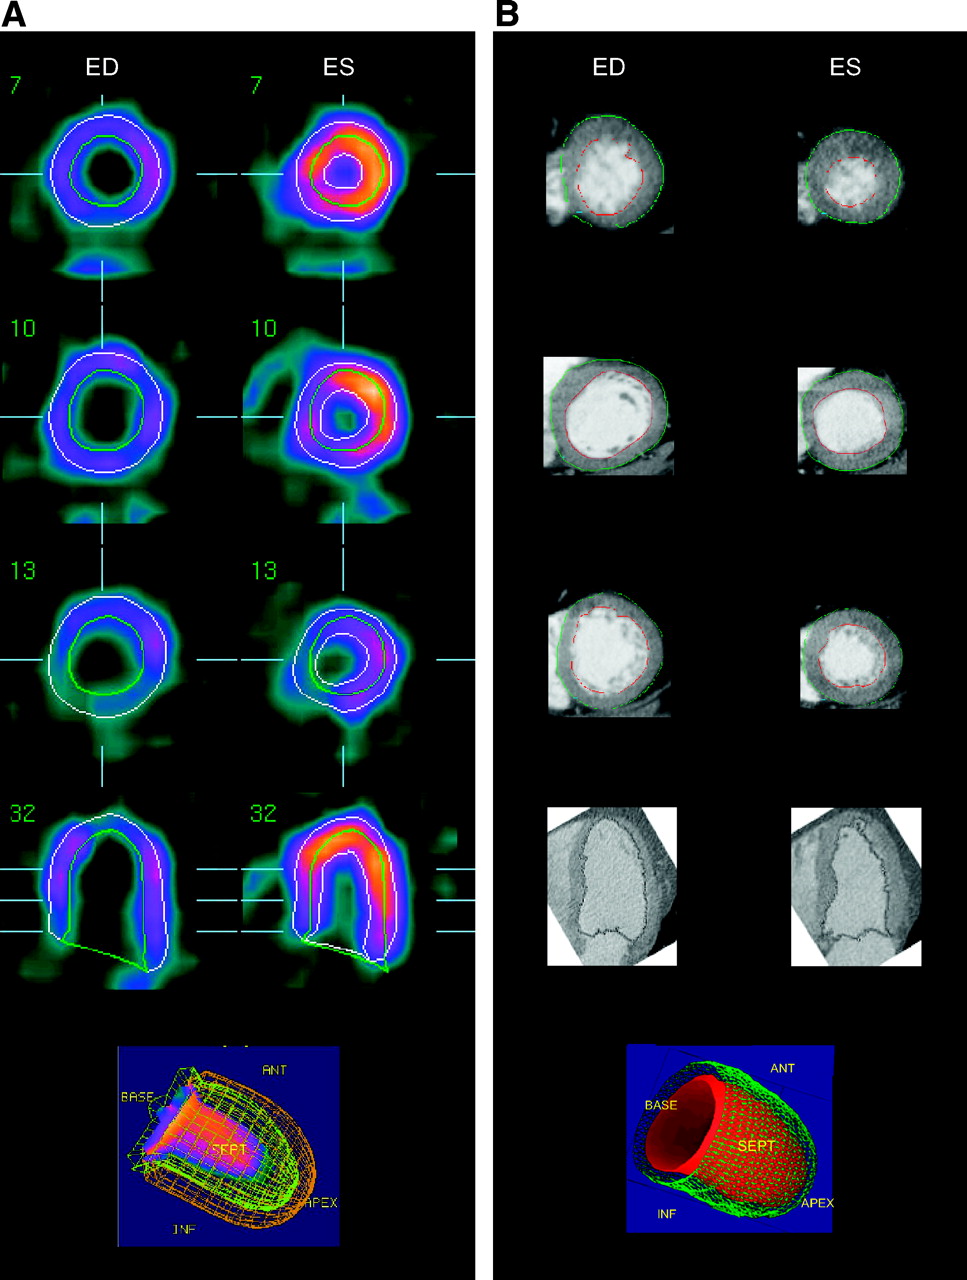
LV volumes were calculated for gated SPECT (A) and for 64-slice CT (B) by tracing of endocardial contour of standardized reformats in end-systolic (ES) and end-diastolic (ED) short- and long-axis view. ANT = anterior; SEPT = septal; INF = inferior.
Statistical Analysis
Data are reported as mean values ± SD and compared using the 2-tailed Student t test for paired data when appropriate. Linear regression analysis and the limits of agreement according to Bland and Altman (37) were determined to compare LV functional parameters between CT and gated SPECT. Heterogeneity was expressed as the coefficient of variance (COV) (SD/mean). Intraobserver reproducibility for LVEF and LV volume measurements was determined for the first 30 consecutive patients using linear regression analysis to assess the intrinsic consistency of each method. For all tests, P < 0.05 was considered significant.
RESULTS
Gated SPECT and CT were performed successfully in all patients, and no complications occurred. The mean heart rate of all subjects during the CT scan (62 ± 8 bpm) was not significantly different from that observed during gated SPECT at rest (63 ± 6 bpm). All SPECT and CT images were of sufficient image quality and suitable for analysis. Baseline characteristics of the study group are presented in Table 1.
Patient Characteristics
Intraobserver and Interobserver Reproducibility
Intraobserver reproducibility by gated SPECT was excellent for LVEF (r = 0.953), EDV (r = 0.989), and ESV (r = 0.993; all P < 0.0001). The mean paired difference was 1.6% ± 4.6% for LVEF, 1.3 ± 10.0 mL for EDV, and −1.1 ± 7.6 mL for ESV.
Similarly, a high interobserver agreement was observed for measuring LVEF (r = 0.904), ESV (r = 0.991), and EDV (r = 0.977; all P < 0.0001) using CT. The mean paired difference was −2.4% ± 6.4% for LVEF, −0.5 ± 14.9 mL for EDV, and 1.7 ± 8.8 mL for ESV.
LVEF and LV Volumes
Mean values and COVs for global LVEF, LV volumes, and myocardial mass are presented in Table 2.
LVEF, Volumes, and Mass
The mean LVEF measured by gated SPECT was 59% ± 13% (range, 11%–81%). LVEF derived from CT was slightly higher (60% ± 12%; range 14%–84%) but not significantly different compared with gated SPECT (mean difference, 1.1% ± 1.7%; P = not significant [NS]), demonstrating a good correlation and agreement between the 2 methods (r = 0.825) (Figs. 3A and 3B).
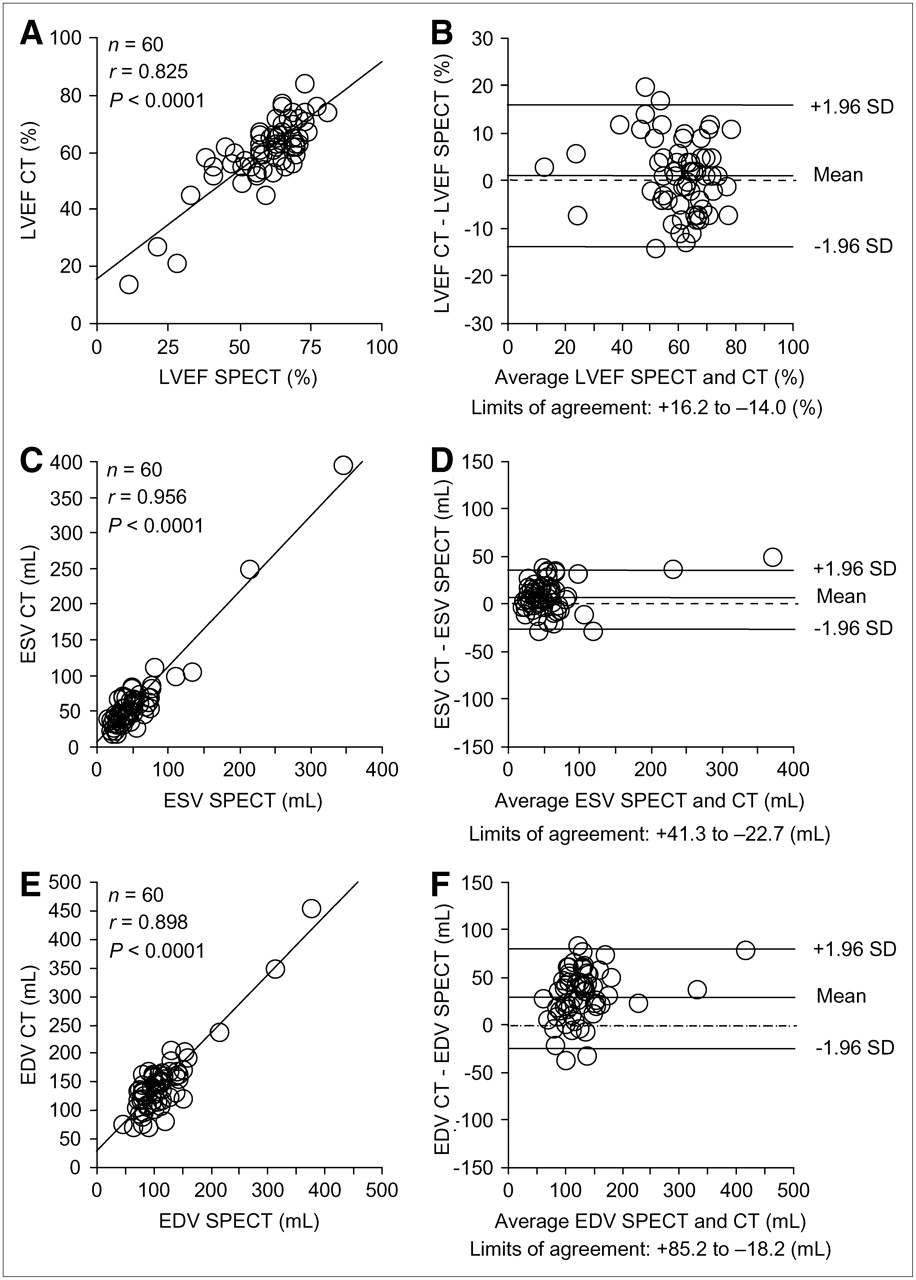
Correlation and Bland–Altman plots for LVEF (A and B), ESV (C and D), and EDV (E and F) by gated SPECT and 64-slice CT.
The mean EDV measured by gated SPECT was 113 ± 52 mL (range, 46–375 mL). The EDV derived from CT was significantly higher (147 ± 60 mL; range, 71–455 mL) compared with gated SPECT (mean difference, 33.5 ± 23.1 mL; P < 0.0001). The corresponding mean values for ESV were 53 ± 49 mL (range, 14–345 mL) for gated SPECT and 63 ± 55 mL (range, 18–395 mL) for CT (mean difference, 9.3 ± 15.9 mL; P < 0.0001). The correlation between both imaging modalities for EDV (r = 0.898) and ESV (r = 0.956; both P < 0.0001) was also high, although with slightly wider limits of agreement (Figs. 3C, 3D, 3E, and 3F).
A subgroup of 10 patients had LV systolic dysfunction (LVEF, 35% ± 12%; range, 11%–48%) calculated by gated SPECT. An excellent correlation between CT and gated SPECT for LVEF (r = 0.936), ESV (r = 0.983), and EDV (r = 0.977; all P < 0.0001) was confirmed in this group.
Left Ventricular Mass
The mean LV myocardial mass calculated by gated SPECT was significantly lower compared with CT (127 ± 24 g vs. 148 ± 37 g; mean difference, 23.0 ± 12.2 g; P < 0.001). A good correlation for LV myocardial mass was found between the 2 methods (r = 0.868; P < 0.005).
Regional Wall Motion Analysis
Four-hundred segments in 20 patients were analyzed and compared. Perfusion SPECT was normal in 12 patients. The remaining patients had reversible (n = 2) or fixed (n = 6) perfusion defects. The mean LVEF as determined by gated SPECT was 54% ± 14% (range, 21%–71%). Five patients had LV systolic dysfunction (LVEF, 38% ± 10%; range, 21%–48%).
Overall, absolute regional wall motion as assessed with CT compared well with gated SPECT, although the 2 techniques were less concordant for the septal segments (Table 3), resulting in a moderate correlation between the 2 methods (r = 0.648; P < 0.0001) (Figs. 4A and 4B). This was not influenced by the presence of an abnormal perfusion scan or by the presence of abnormal LV function. When the 5 patients with abnormal LV function were excluded from analysis, no relevant improvement of the correlation between CT and gated SPECT was observed (r = 0.632; P < 0.0001). A slightly inferior correlation between CT and gated SPECT was found for the 8 patients with fixed or reversible perfusion defects (r = 0.593; P < 0.0001).
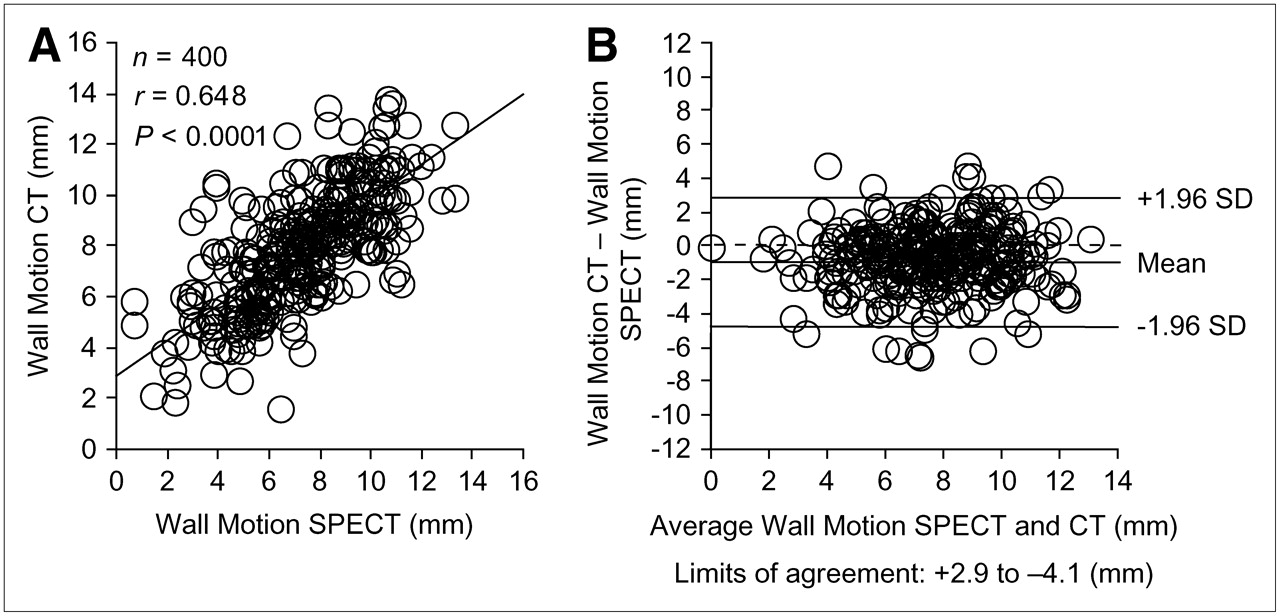
Correlation and Bland–Altman plots for regional wall motion by gated SPECT and 64-slice CT (A and B).
Quantitative Regional Wall Motion
DISCUSSION
To our knowledge, this is the first study comparing functional LV parameters with gated SPECT and 64-slice CT. Analysis of intraobserver reproducibility demonstrated excellent agreement for both CT and gated SPECT, indicating the reliability and intrinsic consistency for each method. LVEF derived from CT was not significantly different compared with SPECT, and good correlations for LVEF, LV volumes, and LV myocardial mass between CT and gated SPECT were found. However, CT yielded a substantial overestimation of EDV and ESV compared with gated SPECT, whereas LV myocardial mass was significantly underestimated by CT.
Several explanations are possible for the apparent overestimation of LV volumes using CT. Accuracy of gated SPECT largely depends on the proper delineation of the endocardial contours, which can be hampered in the presence of severe perfusion defects. However, in our study the observed overestimation of LV volumes by CT was preserved after exclusion of patients with perfusion defects in MPI and those with LV systolic dysfunction (EF < 50%). The good agreement for LVEF over a wide range of values by the 2 methods indicates that assessment of LV function is reliable in normal and distorted ventricles (as documented by the high COVs for LV volumes). These findings are in accordance with a previous study comparing gated SPECT with MRI in ischemic cardiomyopathy, which found a substantial underestimation of ESV and EDV with gated SPECT, whereas LVEF was comparable between the 2 methods (23).
Accuracy with gated SPECT is also known to be limited in patients with a small heart. Because of the partial-volume effect and a limited image resolution, ESV is underestimated more than EDV, resulting in an overestimation of LVEF.
A further reason for the relative overestimation of LV volumes by CT might be the fact that more outflow tract tissue was included on CT images than is routinely visible on gated SPECT images. The outflow tract is never part of the LV volume acquired by gated SPECT because the edge of the LV is defined by the mitral valve (38). Furthermore, the membranous part of the septum is not visible on gated SPECT images, whereas calculation of LV volumes on CT images includes this part of the septum.
The fact that end-systolic and end-diastolic timing was not identical in SPECT and CT might have further contributed to the differences between the 2 methods.
In a recent study, Yamamuro et al. compared LVEF assessed by gated SPECT and 8-slice CT versus MRI in 27 patients (29). Values obtained from CT showed a better agreement with MRI than did gated SPECT. Unfortunately, no data for ESV and EDV were provided and, to the best of our knowledge, no other published data comparing LV functional parameters including quantitative regional wall motion analysis between gated SPECT and CT exist.
The 64-slice CT scanners provide 0.4 × 0.4 × 0.4 mm3 isotropic voxels with a gantry rotation time of 330 ms, thus increasing temporal and spatial resolution and potentially improving morphologic and functional measurements as compared with 16- or 4-slice CT systems. Therefore, the introduction of 64-slice CT might improve the yield in this application. To our knowledge, this study provides the first report on quantitative assessment of regional wall motion analysis by CT. Overall, we found a good agreement in regional wall motion between CT and gated SPECT, except for the septal segments. This is attributed primarily to the fact that the basal part of the septum is membranous and, therefore, proper delineation of the endocardial contours by SPECT is less accurate.
Gated SPECT was chosen as the method of reference because it represents an increasingly used and accepted standard for measuring LV function simultaneously with the evaluation of myocardial perfusion. In addition, after the introduction of hybrid PET/CT scanners (39,40), the integration of SPECT and CT into SPECT/CT scanners will promote the combined use of both techniques in the same patient in the near future.
CONCLUSION
LVEF and LV functional parameters as determined by 64-slice CT agree over a wide range of clinically relevant values with gated SPECT. However, interchangeable use of the 2 techniques should be avoided for LV volumes, myocardial mass, and regional wall motion because of variances inherent to the different techniques.
Acknowledgments
We are grateful to our head radiographer Gabi Hasler for her excellent technical assistance. This work was supported by grants PP00A-68835 and 31-68386 of the Swiss National Science Foundation and the National Center of Competence in Research, Computer Aided and Image Guided Medical Interventions (NCCR CO-ME) of the Swiss National Science Foundation.
Footnotes
-
COPYRIGHT © 2006 by the Society of Nuclear Medicine, Inc.
References
- Received for publication December 7, 2005.
- Accepted for publication April 21, 2006.


Jump to section
Related Articles
Cited By...
- Phase I Clinical Trial of Autologous Stem Cell-Sheet Transplantation Therapy for Treating Cardiomyopathy
- Reference Ranges for LVEF and LV Volumes from Electrocardiographically Gated 82Rb Cardiac PET/CT Using Commercially Available Software
- Assessment of left ventricular ejection fraction and regional wall motion with 64-slice multidetector CT: a comparison with two-dimensional transthoracic echocardiography
- Comparison of Measures of Left Ventricular Function from Electrocardiographically Gated 82Rb PET with Contrast-Enhanced CT Ventriculography: A Hybrid PET/CT Analysis
- The Year in Cardiac Imaging
- Reply: Comparison of 64-Slice CT with Gated SPECT for Evaluation of Left Ventricular Function
- Comparison of 64-Slice CT with Gated SPECT for Evaluation of Left Ventricular Function
- Cardiac Image Fusion from Stand-Alone SPECT and CT: Clinical Experience