


Abstract
A recently developed 18F-labeled PET tracer for somatostatin receptor (sstr) imaging, Nα-(1-deoxy-d-fructosyl)-Nε-(2-[18F]fluoropropionyl)-Lys0-Tyr3-octreotate (Gluc-Lys([18F]FP)-TOCA), was evaluated in patients with sstr-positive tumors by assessing the pharmacokinetics, biodistribution, and diagnostic performance in comparison with [111In]DTPA-octreotide. Methods: Twenty-five patients with different sstr-positive tumors were included in the study and were injected with 105 ± 50 MBq Gluc-Lys([18F]FP)-TOCA. PET was performed up to 120 min with 2 different dynamic imaging protocols. Tracer kinetics in tumors and nontumor tissues and tumor-to-background ratios were described by region-of-interest analysis and standardized uptake values (SUVs). In 16 patients, sstr scintigraphy with [111In]DTPA-octreotide was performed (whole-body scans and SPECT). Two independent experts on PET and γ- camera scans performed lesion counts. Results: Gluc-Lys([18F]FP)-TOCA showed a fast and intense tumor accumulation as well as a rapid clearance from blood serum (biexponential elimination, with the half-lives of the initial and the terminal elimination phase calculated as t1/2(1) = 2.3 ± 1.3 min and t1/2(2) = 26.4 ± 14.6 min, respectively). Tumor-to-background ratios at 16 ± 9 min and 34 ± 12 min were as high as 80% and 90% (% of maximum ratios), respectively. Tumors showed high SUVs ranging from 13.7 ± 2.3 (tumors in lung) up to 26.9 ± 15.4 (abdominal tumors). Tracer distribution within tumor and nontumor tissues was stable up to 120 min (except spleen). No significant bowel activity was observed. Comparison of 29 tumors located in the liver showed a mean tumor-to-background ratio of 5.3 ± 2.6 for Gluc-Lys([18F]FP)-TOCA vs. 4.6 ± 3.3 for [111In]DTPA-octreotide (P = 0.24). Visual image analysis revealed a significantly higher number of lesions (factor of 2.4) and improved interobserver correlation (r = 0.99 vs. 0.86) for PET. Conclusion: Gluc-Lys([18F]FP)-TOCA PET allows a fast, high- contrast imaging of sstr-positive tumors. The biokinetics and diagnostic performance of Gluc-Lys([18F]FP)-TOCA are superior to [111In]DTPA-octreotide and—as far as can be derived from the literature—comparable with [68Ga]-DOTA-d Phe1-Tyr3-octreotide ([68Ga]DOTATOC).
Somatostatin receptor (sstr) scintigraphy is accepted as a standard diagnostic procedure for the localization of sstr-positive tumors. Currently, [111In]DTPA-octreotide ([DTPA is diethylenetriaminepentaacetic acid] Octreoscan; Tyco Healthcare) is the only radiopeptide with regulatory approval in Europe and in the United States. The reported sensitivity for tumor detection with [111In]DTPA-octreotide ranges from 60% to 90% and the specificity ranges from 85% to 98% (1–5). The imaging procedure generally requires delayed scans at 24–48 h and administration of laxatives to avoid significant accumulation of bowel activity. A high physiologic uptake in the liver and kidneys as well as rather low spatial resolution and high statistical noise of the SPECT technique constitute further limitations.
Recently, a glycosylated 18F-labeled somatostatin analog, Nα-(1-deoxy-d-fructosyl)-Nε-(2-[18F]fluoropropionyl)-Lys0-Tyr3-octreotate (Gluc-Lys([18F]FP)-TOCA), has been introduced for PET. Carbohydrate conjugation of octreotide analogs reduces lipophilicity, plasma protein binding, as well as hepatic uptake and enhances tumor uptake and renal excretion (6,7). Preliminary evaluation of Gluc-Lys([18F]FP)-TOCA showed promising results in an animal model and a single patient study (8). Low lipophilicity, rapid renal tracer elimination, low liver uptake and intestinal activity, as well as fast and intense tumor accumulation were observed and provided excellent tumor-to-nontumor ratios. Gluc-Lys([18F]FP)-TOCA demonstrates a very high affinity to hsst2, a moderate affinity to hsst4 and hsst5, and no affinity to hsst1 and hsst3.
The aim of this study was to evaluate Gluc-Lys([18F]FP)-TOCA in patients with sstr-positive tumors. In vivo pharmacokinetics, biodistribution, and tumor uptake were assessed. The diagnostic performance of Gluc-Lys([18F]FP)-TOCA was compared with that of [111In]DTPA-octreotide.
MATERIALS AND METHODS
Radiopharmaceuticals
Gluc-Lys([18F]FP)-TOCA was synthesized as recently described (8). [111In]DTPA-octreotide was prepared according to the manufacturer's instructions (Octreoscan; Tyco Healthcare).
Patients
Twenty-five patients (9 male, 16 female) with an average age of 58 ± 11 y (age range, 39–81 y) were included in the study. A positive [111In]DTPA-octreotide scan was the inclusion criterion. The patients had carcinoid tumors of the pancreas (n = 4), colon, rectum (n =1 each), small intestine, bronchus (n = 2 each), and of unknown origin (n =4). Two patients were diagnosed with insulinoma, 1 patient with pheochromocytoma, 1 patient with paraganglioma, and 1 patient with a glomus tumor. Six patients had thyroid carcinoma (medullary or follicular). The majority of patients had advanced metastatic disease (Table 1) and were referred for assessment of further therapy options. The main locations of the metastases were the liver, abdominal or intestinal sites, and the lung. Bone metastases were also found in several patients. In the patients with metastatic carcinoid tumors, somatostatin treatment was discontinued at least 2 d before the imaging session.
Patient Characteristics
All patients were investigated with Gluc-Lys([18F]FP)-TOCA PET. Sixteen of 25 patients underwent in-house [111In]DTPA-octreotide scintigraphy within 2 wk of PET. In 9 of 25 patients, the [111In]DTPA-octreotide scan had been already done in an external nuclear medicine department. Written informed consent was obtained from all patients before being included in the study, and the study was approved by the local ethics committee.
Data Acquisition
PET image acquisition was performed on dedicated PET systems (ECAT-EXACT 47 and ECAT-EXACT 951/R; Siemens/CTI) in 2-dimensional mode. Both scanners provide an axial resolution at full width at half maximum (FWHM) of ∼5 mm and a transaxial resolution at FWHM of ∼8 mm (9,10). The mean injected activity was 105 ± 50 MBq. Transmission measurement was performed with rotating 68Ge rod sources.
Two different acquisition protocols were used for PET. The first protocol was designed to determine tracer uptake kinetics in tumor and surrounding tissues. For this purpose, in 17 patients, dynamic measurements over 45 min were performed through a single bed position, followed by a whole-body study at ∼50 min. The single bed position included at least 1 tumor site and—in most cases—liver, spleen, pancreas, and kidneys. The frame rate was 1 frame per minute for the first 10 min, followed by 3-min frames for up to 30 min, and, finally, 5-min frames until the end of the scan. The subsequent whole-body study consisted of 5 or 6 overlapping bed positions (emission duration, 7 min per bed position). For attenuation correction, transmission measurements were performed before injection (single bed position) and after completion of emission scans (whole body).
The second acquisition protocol consisted of 6 serial whole-body scans over 120 min (5 or 6 bed positions per scan; emission duration, 3 min per bed position; “hot transmission;” 8 patients). This protocol was designed to obtain whole-body data over time.
PET data were reconstructed iteratively by an attenuation-weighted ordered-subsets expectation maximization (OSEM) algorithm using 8 iterations and 4 subsets. Image pixel counts were calibrated to activity concentrations (Bq/mL) and standardized uptake values (SUVs) were calculated as: SUV = tissue activity concentration/(injected activity/body weight). Venous serum samples were obtained in the first 10 patients at time points according to the time course of the dynamic frames. Blood samples were centrifuged, and 200 μL of the supernatant were measured in a well counter to obtain a serum time–activity curve for calculation of half-times.
[111In]DTPA-octreotide scintigraphy was performed on a dual-head γ-camera (ADAC Vertex) with medium-energy, general-purpose collimation according to guiding principles for sstr scintigraphy (11,12) (169 ± 52 MBq; dual-energy window at 170 keV ± 10% and 250 keV ± 10%). SPECT images were reconstructed by an iterative algorithm with 5 iterations and 4 subsets and a postreconstruction gaussian filtering (0.5-mm FWHM). Whole-body imaging and planar detail views were acquired at 4 and 24 h. SPECT was performed at 4 or 24 h depending on the discretion of the treating physician.
Data Analysis
In the reconstructed PET images, region-of-interest (ROI) analysis was performed. In 3 consecutive transversal slices depicting tumor sites (maximum tumor activity and the 2 adjacent slices), circular ROIs (diameter, 1.5 cm) were manually placed. To avoid partial-volume effects and the need for recovery corrections, tumors with a diameter of <2 times the ROI diameter were excluded from ROI analysis. A maximum of 4 tumors was evaluated in single patients to avoid bias by individuals with exceedingly high lesion numbers (up to >60 lesions in single patients). Only tumors that could be delineated on both the dynamic bed position image and the whole-body study were considered to enable observation of tumor activity uptake over ∼70 min.
Background was defined in tumor-free surrounding tissues by drawing circular ROIs in 3 adjacent transversal slices (3-cm ROI in liver, 5-cm ROI in lung and abdomen). From the ROI analysis, tumor-to-background ratios (T/B ratios) were determined using the mean activity within the tumor and background ROI.
In the reconstructed SPECT images, T/B ratios were calculated in the same way as for PET with the exception that tumor ROIs were drawn in only 1 transversal slice. This was done to take into account the different slice thickness of PET and SPECT images. Only tumors that were depicted on PET and SPECT images were included in comparative analyses between PET and SPECT.
For direct visual comparison of Gluc-Lys([18F]FP)-TOCA PET and [111In]DTPA-SPECT, 2 experienced, independent observers reviewed the scans. As a measure for diagnostic yield the number of lesions that could clearly be identified as single foci was determined. The nuclear medicine specialists were unaware of each other's findings. [111In]DTPA-octreotide images were analyzed first. Gluc-Lys([18F]FP)-TOCA image reading was done thereafter without simultaneous access to the [111In]DTPA-octreotide images.
Estimation of Radiation Exposure
An estimation of radiation exposure resulting from Gluc-Lys([18F]FP)-TOCA injection was calculated in 6 patients by using PET- measured organ activities (liver, gallbladder, spleen, kidneys, intestine, urinary bladder, lungs, muscle) and standard organ masses according to the OLINDA formalism (13). In 2 patients, the whole-body study did not include the entire urinary bladder. Therefore, these patients were not considered for this evaluation. Regions were drawn as described in the respective organs to obtain activity concentrations in Bq/mL. Organ activities were calculated with standard organ volumes from the OLINDA formalism. The OLINDA kinetic input form and fit data model was applied to calculate organ residence times. Under the assumption of muscle half-life time = whole-body half-life time, the mean whole-body residence time of the 6 patients was obtained. In the PET images, the urinary bladder volume was determined by ROI analysis. From the decay-corrected urinary bladder activity in the very last of the whole-body studies, the urinary bladder fraction was determined. With respect to the obtained whole-body half-life time, the OLINDA voiding bladder model was applied. The voiding interval was set to 2 h. Calculation of the gallbladder fraction was done applying the International Commission on Radiological Protection gastrointestinal model.
Statistical Analysis
Statistical analysis was performed using dedicated statistical software. Correlation and significance levels were calculated using StatView (SAS Insitute). Values were tested for significance applying the nonparametric Wilcoxon signed rank test for SUV. Because of the lack of normally distributed data, Spearman rank correlation was used rather than Pearson correlation to calculate the intra- and interobserver variability between PET and SPECT and the 2 different experts. Curve fitting of the serum activity concentrations was performed using an automated software (Table Curve 2D; Systat Software).
RESULTS
Safety and Tolerability
The bolus injection of Gluc-Lys([18F]FP)-TOCA was well tolerated. No local or systemic side effects were observed during the time of investigation (120 min).
Biodistribution
The time–activity course in venous blood serum showed rapid biexponential activity elimination. Correlation of the biexponential fitting curve with the data samples was excellent (r = 0.99). The effective half-lives of the initial and the terminal elimination phase were calculated as t1/2(1) = 2.3 ± 1.3 min and t1/2(2) = 26.4 ± 14.6 min, respectively (Fig. 1). The kidney activity rapidly increased until ∼4 min after injection, followed by a subsequent decline. Kidney activity leveled off at ∼20 min. The corresponding plateau was about 2 times higher than liver activity (Fig. 2).
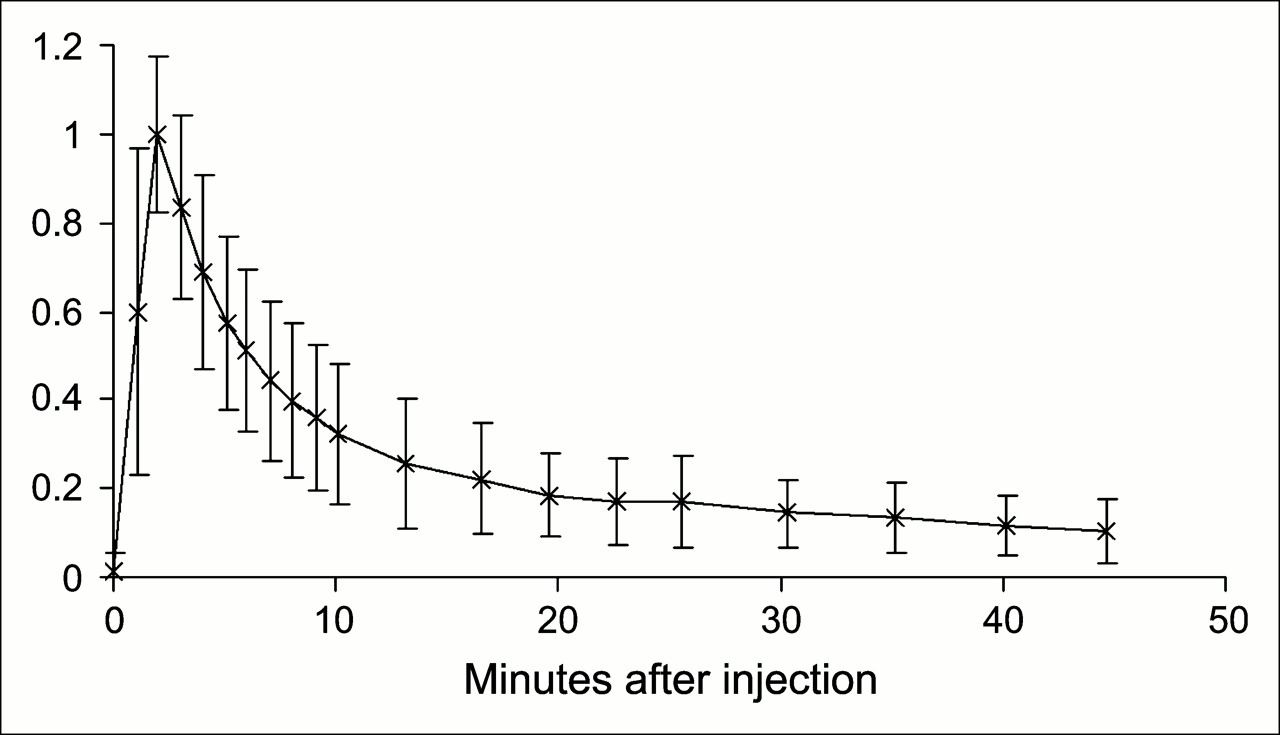
Normalized serum time–activity curves of 10 patients expressed as percentage maximum divided by 100. Serum activity shows a biexponential elimination, with half-lives of t1/2(1) = 2.3 ± 1.3 min for the fast component and t1/2(2) = 26.4 ± 14.6 min for the slow component (error bars = 1 SD).

Time–activity curve for kidney parenchyma and normal liver. Kidney activity shows initial rapid increase and continuous decrease until about 20 min after injection.
Lung and muscle showed stable activity concentrations over time—however, at very low levels. Tumor-free abdominal regions also showed a stable activity concentration at a slightly elevated level. The spleen had continuing activity uptake over time until the end of observation (120 min). Increasing activity in the urinary bladder over time indicated ongoing renal excretion. The gallbladder also exhibited increasing activity over time, indicating hepatobiliary excretion as an additional clearance way for Gluc-Lys([18F]FP)-TOCA (Fig. 3).

Time course of SUVs in normal tissue (n = 8; error bars = 1 SD). Mean values of 8 patients are shown. Liver, lung, and muscle remain stable or decrease slightly over time; spleen shows mild increase over time. Increasing SUV in bile indicates hepatobiliary tracer excretion.
At ∼60 min, static comparison of SUVs in normal organs and regions gave the following distribution (Table 2): brain, lung, and muscle showed very low mean SUVs. A distinct activity uptake was regularly found in the pituitary gland. The abdominal region (not involved with tumor) reached a mean SUV of 1.2, suggesting low intestinal uptake. Liver SUVs were, on average, 5.3, which was somewhat lower than that for kidney (8.9). The highest nontumor SUVs were found for gallbladder (12.7) and spleen (20.6) and were in the range of tumor activity uptake (Table 2).
Mean SUVs of Nonpathologic Tissues and Reference Regions
Tumor Uptake
Gluc-Lys([18F]FP)-TOCA was rapidly taken up in tumors. No decrease in tumor activity was observed until 60 min. Eighty percent and 90% of the maximum T/B ratio were reached within 16 ± 9 min and 34 ± 13 min, respectively, when averaging the T/B ratios for 37 tumors located in the liver (Fig. 4).
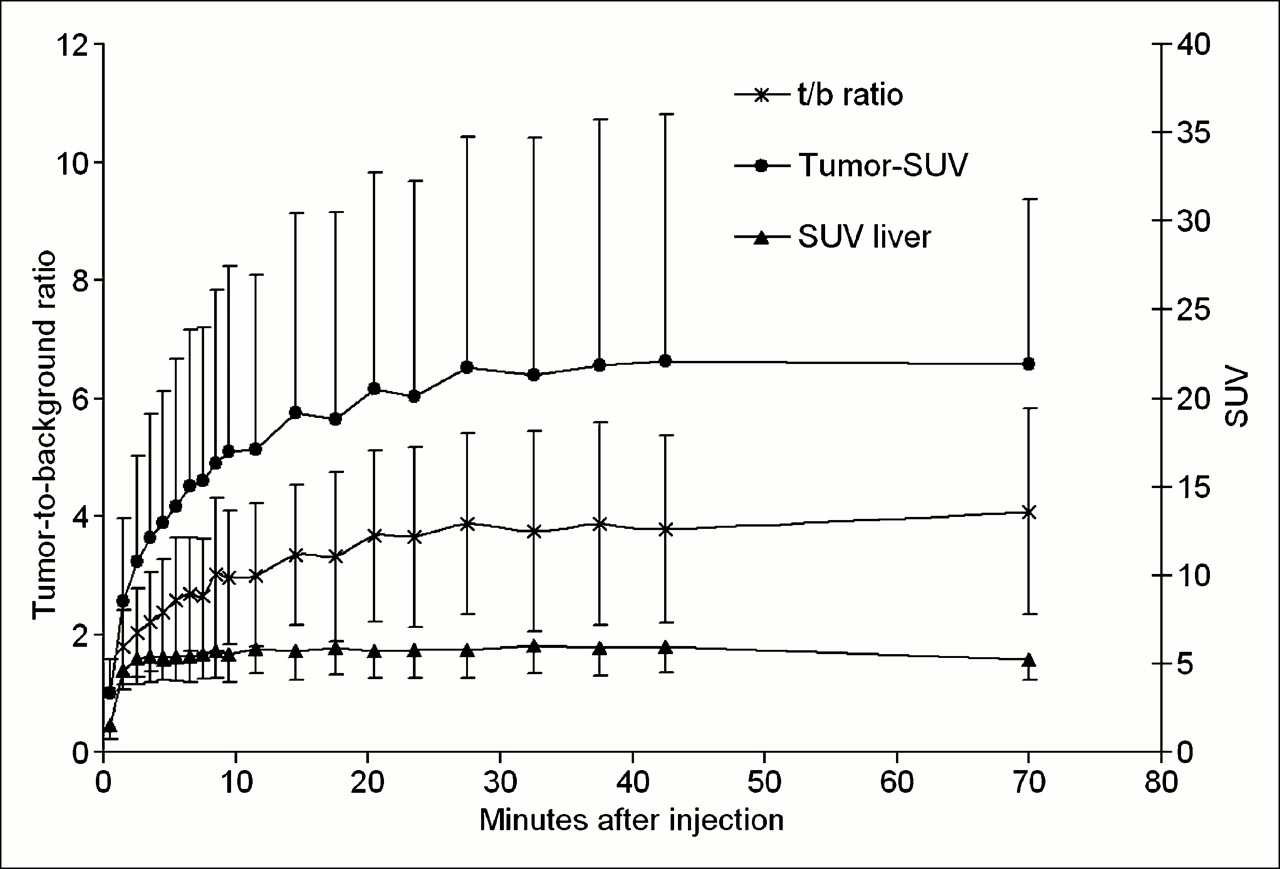
Rapid development of high T/B ratios (t/b ratio) after sstr imaging using Gluc-Lys([18F]FP)-TOCA PET. Plot shows mean target-to-background ratios of 37 tumors located in liver (error bars = 1 SD). Eighty percent of the maximum value was reached within 16 ± 9 min and 90% of maximum T/B ratio was reached within 34 ± 12 min. Solid circles denote development of tumor SUV over time, which reaches a plateau at ∼40 min. Solid triangles denote development of background SUV (liver) with mild decrease over time.
In total, 54 tumors were quantitatively assessed in the 25 PET studies. In the liver, mean tumor SUVs were 22 ± 10 in the late static image at ∼70 min after injection and ranged from 12 to 52 (n = 37). Tumors located in the abdomen reached an average SUV of 27 ± 15 within a range of 14–63 (n = 10); tumors in the spine were at 16 ± 7 (n = 3). Tumors in the lung were depicted with a mean SUV of 14 ± 2 (n = 3). Overall tumor average SUV (n = 54) was 21.6 ± 11.4. Depending on the tumor surroundings, the mean target-to-background ratios (T/B) ranged from T/Bliver = 4.2 ± 2.0 to T/Babd = 30.0 ± 10.9 for extrahepatic abdominal regions to T/Blung/spine = 38.3 ± 18.2. Due to the very low cortical background, the single glomus-tumor uptake achieved a T/Bcortex = 252 (Table 3).
Mean SUV and T/B Ratios at 60 Minutes for Tumors After Administration of Gluc-Lys([18F]FP)-TOCA
Comparison Between Gluc-Lys([18F]FP)-TOCA PET and [111In]DTPA-Octreotide Scintigraphy
T/B ratios were calculated for 29 tumors (n = 10 patients) matching on PET and SPECT. All tumors were located in the liver. PET scans were obtained at 60 min and SPECT images were obtained at 24 h. In 3 patients, T/B ratios were higher on SPECT than on PET compared with 4 patients with higher T/B ratios on PET. In 2 patients there was a mixed pattern. In 1 patient, SPECT and PET yielded identical T/B ratios. Mean T/B for PET was 5.3 ± 2.6 compared with 4.6 ± 3.3 for SPECT. All differences were statistically not significant (Wilcoxon signed rank test; P = 0.24) (Table 4).
Mean T/B Ratios for Gluc-Lys([18F]FP)-TOCA PET (PET) and [111ln]DTPA-Octreotide SPECT (SPECT) of 29 Liver Lesions in 10 Patients
On PET, >2 times as many lesions (Figs. 5 and 6) were detected than on SPECT (Wilcoxon signed rank test; P = 0.008 and P = 0.003 for investigator 1 and investigator 2, respectively). For this analysis, the field of view of SPECT determined the area for lesion counts on both SPECT and PET (Table 5). The first images to be evaluated were the SPECT studies, followed by PET after finishing all SPECT readings.
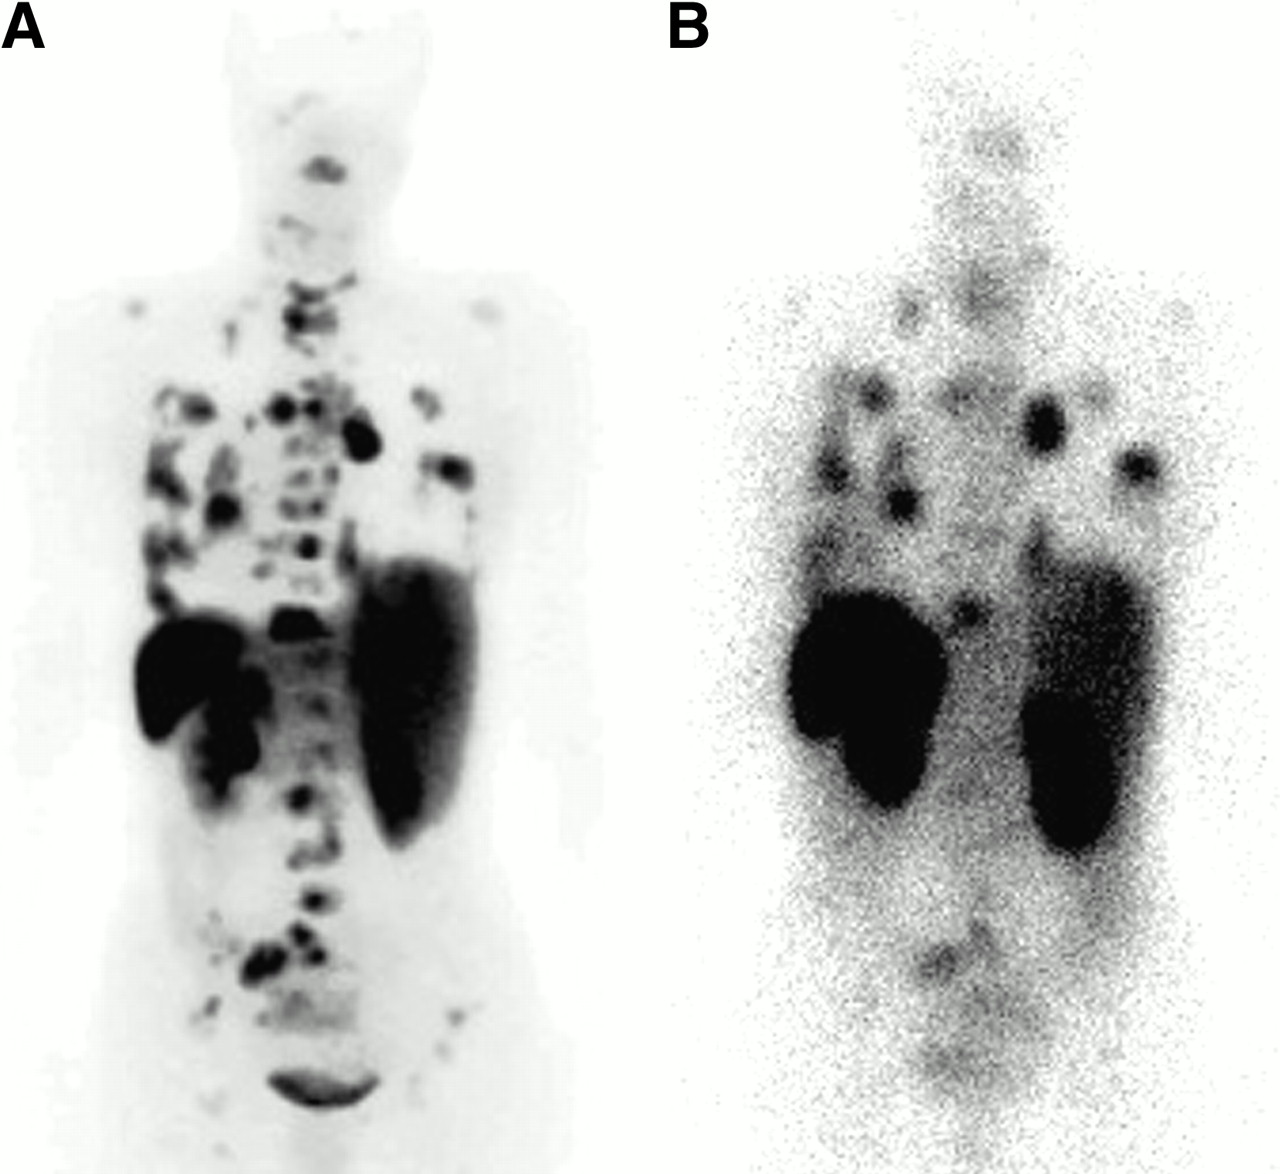
Gluc-Lys([18F]FP)-TOCA PET and [111In]DTPA-octreotide scintigraphy in 50-y-old female patient with history of metastatic paraganglioma. In dorsal view of PET projection images (A), a large number of lesions can be delineated that are not visible in the posterior view of late [111In]DTPA-octreotide scintigraphy (B, 48 h after injection).
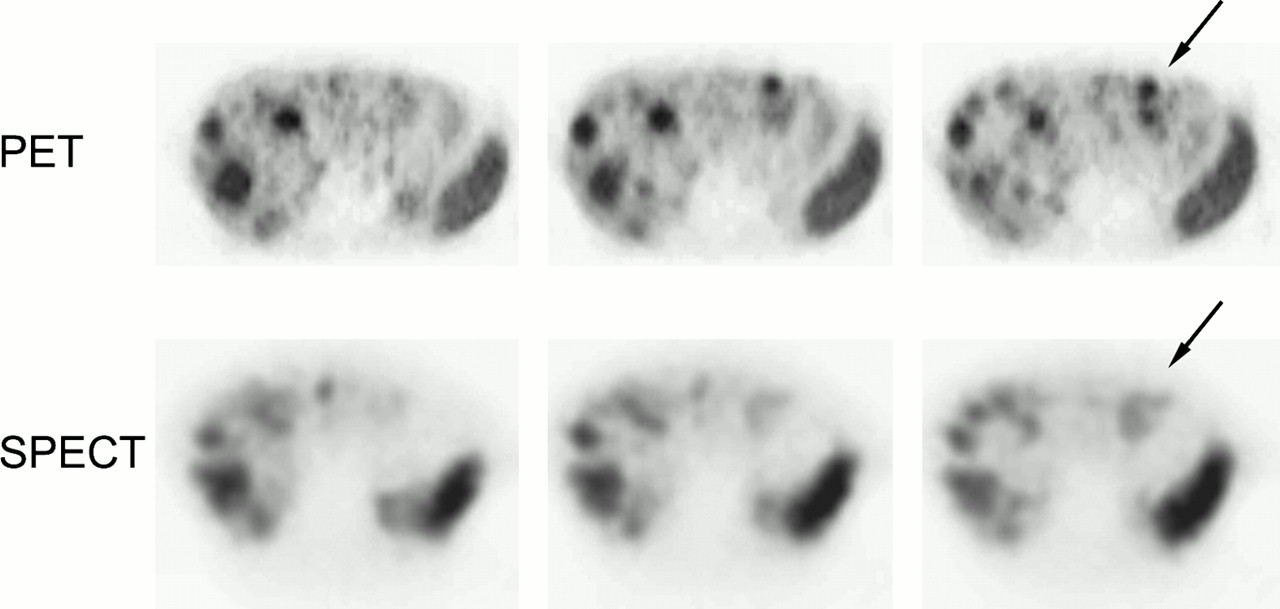
Gluc-Lys([18F]FP)-TOCA PET and [111In]DTPA-octreotide SPECT (48 h after injection) in 53-y-old female patient with metastatic carcinoid of small intestine. Images are from caudal to cranial in 3 adjacent slices. Arrows indicate better delineation of 2 lesions on PET than on SPECT.
Lesion Counts in PET vs. SPECT Images
Intraobserver variability (PET vs. SPECT) as well as interobserver variability for each modality delivered statistically significant correlations (P < 0.05). Interobserver correlation for PET was excellent (Spearman rank correlation coefficient, 0.99), whereas interobserver correlation was slightly decreased for SPECT (0.86). Correlation between PET and SPECT was even worse (0.84, observer 1; 0.66, observer 2).
Radiation Exposure
Radiation exposure to the whole body from Gluc-Lys([18F]FP)-TOCA PET was calculated in 6 patients as 1.3 mSv/100 MBq (effective dose). The mean excretion fraction for urinary bladder and gallbladder was calculated as 23% and 2%, respectively. The main exposed organs are spleen, urinary bladder wall, liver, and kidneys (Table 6).
Organ Doses from a Single Patient According to OLINDA Formalism
DISCUSSION
Gluc-Lys([18F]FP)-TOCA, after intravenous injection, shows a fast tumor accumulation, leveling off at ∼40 min. Blood serum is rapidly cleared from activity through the kidneys, with renal activity leveling off at ∼20 min. In liver, as the most important metastatic site, T/B ratios of 80%−90% (calculated as percent of the maximum achievable ratio) are reached as early as 16–34 min after tracer injection and remain rather stable over 1 h. Thus, 30–40 min after injection constitutes the recommended starting time point for scan acquisition. Hepatobiliary activity excretion is negligible with regard to potentially confounding abdominal or intestinal uptake. The organ with the highest activity uptake was the spleen, as observed with other radiolabeled somatostatin analogs (16,18). However, the precise uptake mechanisms in spleen are not yet elucidated (8,14).
Comparison with [111In]DTPA-Octreotide
For tumor detectability, a direct comparison between Gluc-Lys([18F]FP)-TOCA and [111In]DTPA-octreotide was performed in this study. Gluc-Lys([18F]FP)-TOCA detected >2 times as many lesions than did [111In]DTPA-octreotide. This overwhelming increase in diagnostic sensitivity was not based on a corresponding increase in tumor-to- background contrast. Although the binding affinity of Gluc-Lys([18F]FP)-TOCA to hsst2 is by a factor 10 higher than that of [111In]DTPA-octreotide (15), the differences in tumor-to-background contrast were statistically not significant between PET at 60 min and SPECT at 24 h. A recent work of Stahl et al. (16) demonstrated optimal tumor-to-background ratios at 24 h. Four-hour SPECT images were not considered.
The fact of increased binding affinity but similar target-to-background ratios is explained through the different fates of Gluc-Lys([18F]FP)-TOCA and [111In]DTPA-octreotide after binding to the sstr at cellular surfaces. [111In]DTPA-octreotide, after cellular internalization of the ligand–receptor complex, is known to be trapped, allowing intracellular activity accumulation over many hours. In contrast, for Gluc-Lys([18F]FP)-TOCA, such a trapping mechanism has not been found. Thus, the rapid and intense tumor activity uptake of Gluc-Lys([18F]FP)-TOCA is compensated by a slowly but prolonged accumulation of [111In]DTPA-octreotide. Therefore, the diagnostic advantages through Gluc-Lys([18F]FP)-TOCA appear to mainly relate to PET technique—that is, improved spatial resolution, noise reduction, and attenuation correction. Small lesions may not have been visualized on SPECT due to the lack of spatial resolution and interfering tissue attenuation. These factors may also contribute to the excellent interobserver correlation seen with PET. In comparison, interobserver correlation for SPECT was only moderate.
The short investigation protocol and the lack of a need for patient preparation are clear advantages of Gluc-Lys([18F]FP)-TOCA over [111In]DTPA-octreotide. Overlying intestinal activity, as frequently seen in late images with [111In]DTPA-octreotide, constitute no diagnostic problem on PET scans with Gluc-Lys([18F]FP)-TOCA.
Radiation exposure to the patient amounts to 8 mSv/100 MBq with [111In]DTPA-octreotide (17) and to ∼1.3 mSv/100 MBq with Gluc-Lys([18F]FP)-TOCA.
Taken together, Gluc-Lys([18F]FP)-TOCA has striking advantages over [111In]DTPA-octreotide in terms of diagnostic performance, amount of time needed, patient comfort, and radiation exposure.
As a potential limitation of this comparison, the lack of a gold standard should be mentioned. Most of the patients had advanced disease. Therefore, surgery was not justified to obtain a histopathologic correlation.
Comparison with [68Ga]-DOTA-d Phe1-Tyr3-Octreotide ([68Ga]DOTATOC)
Recently, [68Ga]DOTATOC has been described as a most promising PET tracer for imaging of sstr-positive tumors. Hofmann et al. (18) reported a fast, biexponential blood clearance of [68Ga]DOTATOC, with effective half-times of 2 min (T1) and 48 min (T2). These values are comparable with and slightly longer than the respective corresponding effective half-times of Gluc-Lys([18F]FP)-TOCA. Tumor accumulation of [68Ga]DOTATOC appears to be equally rapid as that of Gluc-Lys([18F]FP)-TOCA. Within 30 min, >80% of the maximum tumor activity is achieved with [68Ga]DOTATOC. Hofmann et al. (18) recommends starting imaging 30–40 min after injection to obtain maximum tumor-to-nontumor contrast at high counting rates. With Gluc-Lys([18F]FP)-TOCA, 80% of the maximally achievable tumor-to-background contrast occurs at 16 min. The start of imaging is also recommended at ∼30–40 min.
The biodistribution of [68Ga]DOTATOC and Gluc-Lys([18F]FP)-TOCA appear to be comparable. However, for [68Ga]DOTATOC, the absolute organ SUVs differ between Hofmann et al. (18) and Kowalski et al. (19). In liver, the tumor-to-background contrast for [68Ga]DOTATOC can be calculated from Hofmann et al. as 4.68 at 90 min. For Gluc-Lys([18F]FP)-TOCA, we found 4.2 at 60 min. Compared with [111In]DTPA-octreotide, the number of detected lesions with [68Ga]DOTATOC is higher by a factor of 1.7 (18), whereas it is higher by a factor of 2.3 with Gluc-Lys([18F]FP)-TOCA. However, the number of additional lesions detected with either tracer varied highly between single patients. Thus, the rather small deviations in diagnostic yield between [68Ga]DOTATOC and Gluc-Lys([18F]FP)-TOCA should be interpreted with care.
As for now, the most relevant difference between [68Ga]DOTATOC and Gluc-Lys([18F]FP)-TOCA relates to the ease of tracer preparation. Whereas radiometallation of DOTATOC, by chelator complexation, is achieved within minutes and at high radiochemical yields, the preparation of Gluc-Lys([18F]FP)-TOCA requires a multistep synthesis with an overall preparation time of about 3 h and limited radiochemical yield (20%–30% (19)). This preparational drawback of Gluc-Lys([18F]FP)-TOCA will significantly hamper its clinical use. The recent development of a high-yield chemoselective conjugation method for radiohalogenation, however, offers new perspectives for radiofluorination of octreotide analogs. Schottelius et al. (20) evaluated a 2-step synthesis of 3 novel 18F-labeled TOCA derivatives in comparison with Gluc-Lys([18F]FP)-TOCA. Among these novel tracers, Cel-S-Dpr([18F]FBOA]TOCA was considered suitable for large-scale clinical use because of a 65%–85% radiochemical yield within a 50-min preparation time and excellent binding affinity and biokinetics.
Comparison with Maltotriose-[123I]Tyr3-Octreotate ([123I]Mtr-TOCA)
Recently another carbohydrated tracer for SSTR imaging has been evaluated by our group (16). This 123I-labeled compound provides rapid kinetics, enabling 1-d imaging protocols. High-contrast images are obtained as early as 10.5 h after injection. However, in comparison with [111In]DTPA-octreotide, the overall diagnostic yield was not improved using [123I]Mtr-TOCA; liver metastases even showed a higher detectability with [111In]DTPA-octreotide. The binding profiles of [123I]Mtr-TOCA and Gluc-Lys([18F]FP)-TOCA are comparable. A reduction in tumor activity from 3 h on as described for [123I]Mtr-TOCA may also be true for Gluc-Lys([18F]FP)-TOCA but was not assessed in this study. With [123I]Mtr-TOCA, from 3 h on increasing background activity was found, indicating higher levels of circulating degradation products. However, this was also not assessed for Gluc-Lys([18F]FP)-TOCA because the imaging protocol only covered 2 h after injection.
Therefore, the improvement of diagnostic yield with Gluc-Lys([18F]FP)-TOCA compared with [111In]DTPA-octreotide is explained by the methodologic advantages of PET over planar imaging and SPECT. Because of the opportunity of having very short clinical protocols, the limitations observed for [123I]Mtr-TOCA, such as decreasing tumor activities and increasing background, are not relevant to Gluc-Lys([18F]FP)-TOCA.
CONCLUSION
PET with Gluc-Lys([18F]FP)-TOCA allows for a fast, high-contrast depiction of sstr-positive tumors. The diagnostic performance of Gluc-Lys([18F]FP)-TOCA is clearly superior to [111In]DTPA-octreotide and conventional γ-camera imaging. As far as can be determined from the literature, Gluc-Lys([18F]FP)-TOCA is fairly comparable to [68Ga]DOTATOC in terms of biokinetics, biodistribution, and diagnostic performance. However, from a physical point of view, 18F still constitutes the ideal radionuclide for PET. The main drawback of Gluc-Lys([18F]FP)-TOCA is the time-consuming multistep radiosynthesis with limited overall yield. Chemoselective 2-step radiofluorination of glycosylated TOCA derivatives possesses the potential to overcome these limitations and has already afforded the most-promising novel tracers.
Acknowledgments
The authors thank the nuclear medicine technicians of the PET Centre in the Department of Nuclear Medicine, Technische Universität München, for their dedicated work that helped to make this study possible. The authors also acknowledge the advice of Stefan Wagenpfeil, PhD, Institute for Medical Statistics and Data Analysis, Technische Universität München, relating to several questions with regard to data analysis.
References
- Received for publication November 7, 2005.
- Accepted for publication January 3, 2006.


Jump to section
Related Articles
Cited By...
- 18F-Labeled Somatostatin Analogs as PET Tracers for the Somatostatin Receptor: Ready for Clinical Use
- 18F-Labeled Somatostatin Analogs as PET Tracers for the Somatostatin Receptor: Ready for Clinical Use
- International Union of Basic and Clinical Pharmacology. CV. Somatostatin Receptors: Structure, Function, Ligands, and New Nomenclature
- Clinical Translation of a Click-Labeled 18F-Octreotate Radioligand for Imaging Neuroendocrine Tumors
- Nuclear medicine techniques for the imaging and treatment of neuroendocrine tumours
- Targeting Somatostatin Receptors: Preclinical Evaluation of Novel 18F-Fluoroethyltriazole-Tyr3-Octreotate Analogs for PET
- Somatostatin receptor-based imaging and therapy of gastroenteropancreatic neuroendocrine tumors
- Nuclear Imaging Probes: from Bench to Bedside
- Somatostatin Receptor Imaging in Patients with Neuroendocrine Tumors: Not Only SPECT?
- 68Ga-DOTA-Tyr3-Octreotide PET in Neuroendocrine Tumors: Comparison with Somatostatin Receptor Scintigraphy and CT