


Abstract
The response to cardiac resynchronization therapy (CRT) varies significantly among individuals. Preliminary data suggest that the presence of myocardial viability may be important for response to CRT. The aim of this study was to evaluate whether the extent of viability could predict response to CRT after 6 mo. Methods: Sixty-one consecutive patients with advanced heart failure, left ventricular ejection fraction < 35%, QRS duration > 120 ms, and chronic coronary artery disease were included. To determine the extent of viability all patients underwent nuclear imaging with 18F-FDG SPECT before implantation. Clinical and echocardiographic parameters were assessed at baseline and after 6 mo of follow-up. Results: The presence of myocardial viability was directly related to an increase in left ventricular ejection fraction after 6 mo of CRT. Furthermore, the extent of viability in responders (n = 38) was significantly larger compared with that of nonresponders (n = 23; 12 ± 3 vs. 7 ± 3 viable segments, P < 0.01). Moreover, the optimal cutoff value to predict clinical response to CRT was identified at an extent of 11 viable segments or more (in a 17-segment model), yielding a sensitivity of 74% and a specificity of 87%. Conclusion: The presence of myocardial viability is directly related to response to CRT in patients with ischemic heart failure. Interestingly, using a cutoff level of 11 viable segments or more, the extent of viability could be used to predict response. Therefore, evaluation for myocardial viability may be considered in the selection process for CRT.
Despite significant advances in the treatment of congestive heart failure, the 5-y mortality exceeds 50% (1,2). Cardiac resynchronization therapy (CRT) has been introduced as a new treatment option for patients with severe heart failure, depressed left ventricular (LV) function, and wide QRS complex. Various randomized studies have demonstrated improvement in symptoms, exercise capacity, and LV systolic function (3–6). Furthermore, CRT reduces rehospitalization for heart failure with a substantial survival benefit (7,8).
However, up to one third of patients with New York Heart Association (NYHA) class III or IV, impaired LV ejection fraction (LVEF, <35%), and QRS > 120 ms do not clinically respond after CRT (3,4). The reasons for nonresponse to CRT are not well known, although the presence of LV dyssynchrony is predictive for the response to CRT (9,10). In addition, extensive scar tissue in the posterolateral wall on contrast-enhanced MRI is associated with poor response to CRT and the extent of viable myocardium is associated with a benefit from CRT (11,12). One could anticipate that a substantial amount of viable myocardium is needed for improvement in LV function after CRT, and the extent of viability may be useful for a prediction of response to CRT.
Accordingly, the aim of this study was to evaluate the value of viability for response to CRT and, more specifically, to derive a cutoff value for the extent of viable myocardium that may be necessary for a good response to CRT.
MATERIALS AND METHODS
Patients
Consecutive patients with ischemic heart failure (NYHA class III or IV), depressed LVEF (<35%), and substantial LV dyssynchrony were prospectively included for implantation of a CRT device. Patients with a recent myocardial infarction (<3 mo) or decompensated heart failure were excluded. Etiology was considered ischemic in the presence of significant coronary artery disease (≥50% stenosis in 1 or more of the major epicardial coronary arteries) or a history of myocardial infarction with electrocardiographic evidence, prior percutaneous coronary intervention, or prior coronary artery bypass graft surgery.
Before CRT implantation, all patients underwent nuclear imaging with 18F-FDG to identify viable myocardium. Clinical status and echocardiographic parameters were evaluated before CRT implantation and repeated after 6 mo of CRT.
18F-FDG Imaging
18F-FDG imaging was performed after administration of acipimox (a nicotinic acid derivative, 500 mg, oral dose) (13). Acipimox enhances myocardial 18F-FDG uptake by reducing the plasma level of free fatty acids (14). A low-fat, carbohydrate-rich meal was provided to further enhance myocardial 18F-FDG uptake by stimulating endogenous insulin release. One hour after acipimox administration, a blood sample was taken to assess plasma glucose levels. When plasma glucose was between 5 and 7 mmol/L, 185 MBq 18F-FDG were injected at rest. Forty-five minutes thereafter, data acquisition was started (15). Metabolic imaging was performed at rest using a triple-head SPECT camera system (GCA 9300/HG; Toshiba Corp.) equipped with commercially available 511-keV collimators. Data were acquired over 360° and stored in a 64 × 64, 16-bit matrix.
Reconstructed 18F-FDG short-axis slides were displayed in polar map format (normalized to the maximum activity) and analyzed using a 17-segment model (16). Tracer uptake was analyzed quantitatively and categorized on a 4-point scale: 0, tracer activity > 75% (normal, viable); 1, tracer activity = 50%−75% (minimal scar); 2, tracer activity = 25%−50% (moderate scar); 3, tracer activity < 25% (extensive scar) (17). The number of viable (normal, score 0) segments per patient was noted. In addition, summation of the segmental scores yielded the total scar score, with the higher scores indicating more scar tissue (reflecting the extent of damage per patient).
Echocardiography
Transthoracic 2-dimensional (2D) echocardiography was performed the day before CRT implantation and after 6 mo of CRT. Patients were imaged in the left lateral decubitus position using a commercially available system (Vingmed Vivid Seven; GE Healthcare). Images were obtained using a 3.5-MHz transducer, at a depth of 16 cm in the parasternal and apical views (standard long-axis and 2- and 4-chamber images). Standard 2D and color Doppler data, triggered to the QRS complex, were saved in cine-loop format. LV volumes (end-diastolic, end-systolic) and LVEF were calculated from the conventional apical 2- and 4-chamber images, using the biplane Simpson's technique (18). Inter- and intraobserver agreement for assessment of LV function and volumes was 90% and 96%, respectively.
Clinical Evaluation
Clinical evaluation was performed before implantation and after 6 mo of CRT. NYHA class was used to evaluate heart failure symptoms and scored by an independent physician, who was unaware of all other patient data. NYHA class II was defined as shortness of breath during normal exercise, NYHA class III was defined as dyspnea during minimal exercise (e.g., not able to climb 1 flight of stairs), and NYHA class IV was defined as shortness of breath at rest. The quality-of-life score was assessed using the Minnesota Living with Heart Failure questionnaire (19). Exercise tolerance was evaluated with a 6-min walk test and expressed in meters (20). In all patients, QRS duration was measured from the surface electrocardiogram (ECG) using the widest QRS complex from leads II, V1, and V6. The ECGs were recorded at a speed of 25 mm/s and were evaluated by 2 independent observers without knowledge of the clinical status of the patient.
CRT Implantation
A coronary sinus venogram was obtained using a balloon catheter, followed by the insertion of the LV pacing lead. An 8-French guiding catheter was used to position the LV lead in the coronary sinus. The preferred position was a lateral or posterolateral vein (21). The right atrial and ventricular leads were positioned conventionally. All leads were connected to a dual-chamber biventricular implantable cardioverter-defibrillator (ICD).
Statistical Analysis
Results are expressed as mean ± SD. Comparison of data was performed using the paired and unpaired Student t test for continuous variables and the Fisher exact test for proportions. Linear regression analysis was performed to evaluate the relation between the extent of viability and scar on 18F-FDG imaging and the change in LVEF after 6 mo of CRT.
Uni- and multivariable logistic regression analyses were performed to determine the relation between potential risk factors at baseline and nonresponse to CRT. We considered the following variables to adjust for the extent of viability and scar score separately: QRS duration, LV dyssynchrony, rhythm, LVEF, LV volumes. All variables entered the multivariable stage, irrespective of the results of the univariable analyses. We report only adjusted odds ratios (OR) with their corresponding 95% confidence intervals (CI).
The optimal extent of viability needed to predict response to CRT was determined by receiver-operator-characteristic (ROC) curve analysis. For all tests, a P value < 0.05 was considered statistically significant.
RESULTS
Patient Characteristics
The baseline characteristics of the 61 patients (47 men, age 68 ± 9 y) included in this study are summarized in Table 1.
Patient Characteristics
By definition, all patients had severe heart failure (mean NYHA class, 3.0 ± 0.5). Echocardiographic evaluation revealed LV dilatation (mean end-diastolic volume, 245 ± 81 mL), severely depressed LV function (mean LVEF, 23% ± 6%), and substantial LV dyssynchrony (88 ± 41 ms). All patients had optimized medical therapy that included angiotensin-converting enzyme (ACE) inhibitors, β-blockers, and diuretics, if tolerated.
All patients received a biventricular ICD (Contak CD or Renewal [Guidant Corp.] or Insync III-CD or Marquis [Medtronic Inc.]). Two types of LV leads were used (Easytrak 4512-80 [Guidant Corp.] or Attain-SD 4189 [Medtronic Inc.]). The procedure was successful in all patients and no procedure-related complications were observed. Five patients died of worsening heart failure before the 6-mo follow-up evaluation.
Clinical Response to CRT
After 6 mo of CRT, the mean NYHA class had decreased from 3.0 ± 0.5 to 2.2 ± 0.8 (P < 0.01). The 6-min walking distance improved significantly from 301 ± 107 m to 386 ± 136 m (P < 0.01). Also, symptoms improved, as evidenced by the significant decrease in quality-of-life score (from 37 ± 16 at baseline to 22 ± 18 at follow-up; P < 0.01).
The LVEF increased significantly from 23% ± 6% to 29% ± 9% after 6 mo of CRT (P < 0.01). In addition, significant reverse remodeling was observed, as evidenced by a decrease in LV end-diastolic volume from 245 ± 81 mL at baseline to 217 ± 77 mL (P < 0.01) at follow-up and a decrease in LV end-systolic volume from 192 ± 72 mL to 156 ± 70 mL (P < 0.01).
Extent of Viability
On 18F-FDG imaging, 610 (59%) segments were classified as having normal tracer uptake. Of the 427 segments with reduced 18F-FDG uptake, 121 (12%) were classified as having minimal scar (score 1) and 306 (29%) as having moderate-to-extensive scar (scores 3 and 4). The number of normal, viable segments (extent of viability) ranged from 2 to 17 (mean, 10 ± 4). In addition, extensive regions of scar tissue were present, as indicated by a total scar score of 15 ± 9 per patient.
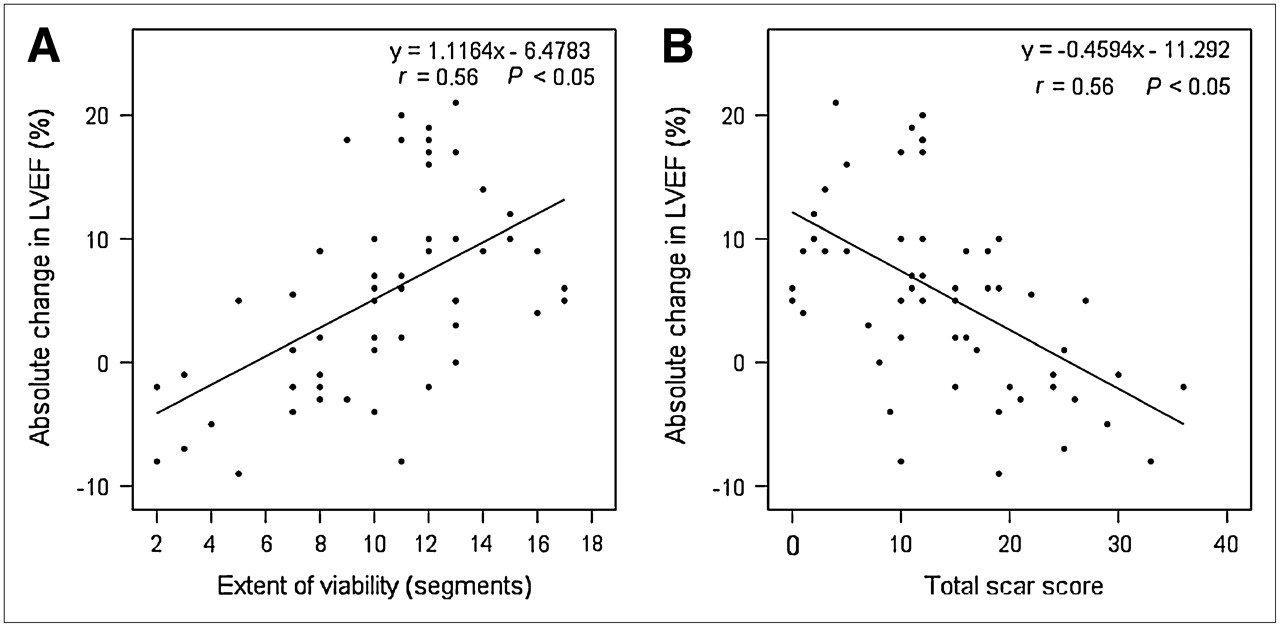
As shown in Figure 1A, there was a significant relation between the extent of viability on 18F-FDG imaging and the absolute change in LVEF after 6 mo of CRT. Furthermore, the total scar score was inversely related to the change in LVEF (Fig. 1B).

(A) Relationship between extent of viability (number of viable segments) and absolute change in LVEF after 6 mo. (B) Relationship between total scar score and absolute change in LVEF after 6 mo.
Responders and Nonresponders
After 6 mo of CRT, 38 patients (62%) were considered responders according to an improvement of ≥1 NYHA class after 6 mo of CRT. There were 23 (38%) nonresponders, of whom 5 died of progressive heart failure before the 6-mo follow-up.
At baseline, there were no significant differences in most of the clinical characteristics between responders and nonresponders. However, QRS duration was less in the nonresponders (147 ± 34 m vs. 175 ± 33 m; P < 0.05), and nonresponders tended to have smaller LV volumes, although the difference was not significant.
In the responders, there was a significant improvement in the NYHA class (2.9 ± 0.5 vs. 1.8 ± 0.5; P < 0.01), 6-min walking distance (305 ± 106 m vs. 438 ± 114 m; P < 0.01), and quality-of-life score (36 ± 15 vs. 14 ± 11; P < 0.01) after 6 mo of CRT. The nonresponders, however, showed no improvement in the clinical parameters. In addition, an improvement in LVEF and a reduction in LV volumes were observed in the responders, whereas these effects were not observed in the nonresponders (Fig. 2).
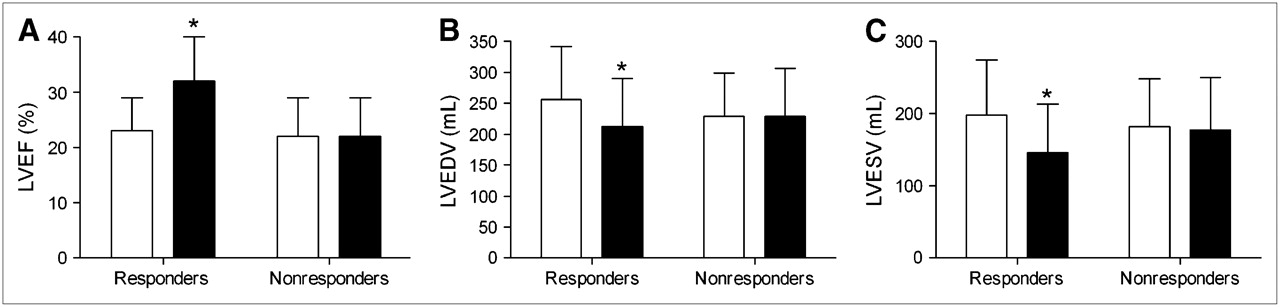
Mean LVEF (A), LV end-diastolic volume (LVEDV) (B), and LV end-systolic volume (LVESV) (C) at baseline (open columns) and after 6 mo of CRT (solid columns). *P < 0.01 baseline vs. follow-up.
The extent of viability at baseline was significantly larger in responders as compared with nonresponders (12 ± 3 vs. 7 ± 3 viable segments; P < 0.01). Furthermore, the total scar score was lower in the group of responders (responders: 11 ± 7 vs. nonresponders: 22 ± 8; P < 0.01). Multivariate analysis revealed that both extent of viability and total scar score were highly predictive for response to CRT (OR 1.632, 95% CI 1.235–2.156, P < 0.001, and OR 0.836, 95% CI 0.754–0.927, P < 0.001). Also, the presence of LV dyssynchrony was associated with response to CRT. Importantly, LV volumes at baseline had no influence on response, and QRS duration was only borderline predictive (P = 0.05).
Extent of Viability to Predict Response to CRT
To define the optimal cutoff value to predict response to CRT, ROC curve analysis was performed. Figures 3A and B show the ROC curves of the extent of viability to predict response and showed a good predictive value in differentiating responders and nonresponders (area under the curve [AUC] = 0.88). The optimal cutoff value, defined as the maximum value of (sensitivity + specificity)/2, was identified at an extent of 11 viable segments, yielding a sensitivity of 74% and specificity of 87% to predict response to CRT.
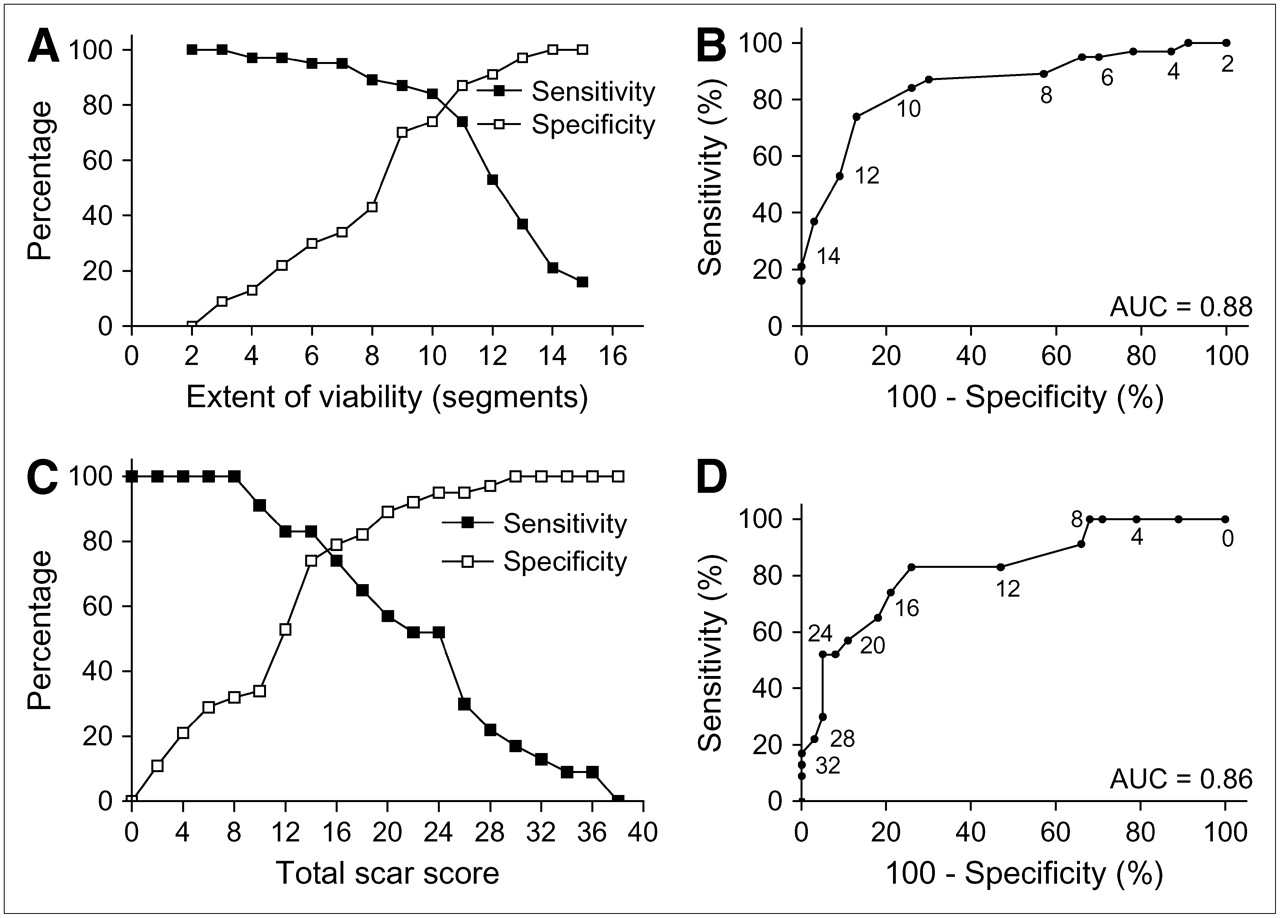
(A and B) ROC curve analysis on extent of viability before CRT implantation and response after 6 mo of CRT (A), with good predictive value (area under curve [AUC] = 0.88) to predict response (B). Small numbers (2−14) next to the line in B indicate extent of viability. (C and D) ROC curve analysis on total score before CRT implantation and response after 6 mo of CRT (C), also with good predictive value (AUC = 0.86) to predict nonresponse (D). Small numbers next to line indicate total scar score.
Furthermore, to predict nonresponse to CRT, ROC curve analysis of the total scar score was performed (Figs. 3C and 3D). The scar score showed a good predictive value (AUC = 0.86), and the optimal cutoff value to predict nonresponse was a scar score of 14 (sensitivity, 83%; specificity, 74%).
DISCUSSION
The findings in the current study demonstrate that response to CRT is directly related to the extent of viability. In addition, the presence of scar tissue is frequent and the total scar score shows an inverse relation to response to CRT. In attempt to define a cutoff value to determine how many viable segments are needed to result in response to CRT, ROC curve analysis was used; this analysis demonstrated that in the presence of 11 or more viable segments, a sensitivity of 74% and a specificity of 87% were obtained to predict clinical response to CRT. Furthermore, having a total scar score of >14 appeared to be predictive of nonresponse.
In large clinical trials, the beneficial effect of CRT has been demonstrated (3–8). On an individual basis, however, 20%−30% of patients still do not respond to CRT (3,4). Current selection of patients is based on heart failure symptoms, LV function, and QRS duration. Thus, additional criteria are needed to identify those patients who are likely to benefit from CRT. Observational studies have demonstrated that the presence of LV dyssynchrony is an important factor determining response to CRT (9,10). Furthermore, ischemic etiology has been identified to be a predictor of nonresponse (22). Also, Woo et al. reported that the benefits of CRT with respect to LVEF and reverse remodeling were greater in patients with nonischemic cardiomyopathy (23). These data suggest that a certain extent of viability is needed to permit a response to CRT.
Myocardial Viability Versus Response to CRT
Thus far, data relating to myocardial viability in CRT patients are scarce. Only one small study addressed this issue. Hummel et al. performed contrast echocardiography before CRT implantation in 21 patients with ischemic cardiomyopathy and demonstrated a significant relationship between the perfusion score index (based on contrast echocardiography)—calculated by dividing the summed scores by the number of segments—and the change in LVEF as determined immediately after CRT implantation (12). Also, the change in LVEF after 6 mo of CRT was significantly related to the perfusion score index. In line with these observations, a linear relation was demonstrated in the present study between the extent of viability (expressed as the number of viable segments on 18F-FDG imaging) and the improvement in LVEF after 6 mo of CRT (Fig. 1A). Moreover, a relationship was noted between the extent of scar tissue (expressed as the total scar score) and the improvement in LVEF after 6 mo, suggesting that extensive scar tissue does not permit improvement of systolic LV function after CRT (Fig. 1B).
Furthermore, in the study by Hummel et al. (12), patients with a higher perfusion score index, indicating more viable segments, tended to have greater improvement in the NYHA class, 6-min walking distance, and quality-of-life score. In the current study, significantly more viable segments were noted in the group of responders compared with that of the nonresponders. These results imply that, in patients with ischemic cardiomyopathy, CRT may not result in clinical and echocardiographic improvement after 6 mo when a substantial amount of viable myocardium is absent.
In the current study, nuclear imaging with 18F-FDG was used to assess myocardial viability. 18F-FDG imaging allows detection of cardiac glucose metabolism and is considered an accurate technique for viability assessment. Of note, in “classical viability studies” dysfunctional myocardium is evaluated for the potential to improve in function after revascularization (24–27). In CRT, however, one is interested not per se in dysfunctional but viable myocardium but, rather, in all myocardium that is alive, which has the potential to improve in contraction after CRT. Therefore, it is of more interest to detect normal, viable myocardium than severely dysfunctional myocardium. In this respect, the definition of viable myocardium in the current study was rather conservative and included only segments with 18F-FDG uptake of ≥75% of maximum tracer uptake, as these segments most likely do not contain scar tissue. Two other small studies used nuclear imaging to assess viability in a similar patient group (CRT candidates), but only described the definition of nonviable myocardium. Sciagra et al. used resting gated perfusion SPECT with 99mTc-tetrofosmin and quantified perfusion defects as the percentage of LV wall, with the defect threshold set at 50% of peak uptake, to identify the likely nonviable myocardium (28). De Winter et al. used resting gated SPECT with 99mTc-sestamibi and considered a myocardial wall to contain substantial nonviable tissue if none of the segments had a mean myocardial uptake higher than 55% of the maximum uptake in the myocardium on the resting perfusion images (29). Optimal assessment of viability may include the integration of perfusion and metabolic imaging (as used in assessment of myocardial hibernation), but in the current study only metabolic imaging with 18F-FDG was used.
From a methodologic point of view, it is important to emphasize that attenuation correction and scatter correction were not used in this SPECT study. However, substantial experience has been gained with 18F-FDG SPECT to predict improvement after revascularization, and the lack of attenuation correction and scatter correction did not negatively affect accuracy (which is comparable with that of FDG PET) (30).
How Much Viable Tissue Is Needed to Benefit from CRT?
Ideally, a cutoff value should be identified indicating how much viable myocardium needs to be present to result in response to CRT. Accordingly, ROC curve analysis was performed to identify this cutoff value. As can be observed from Figure 3A, a small amount of viable myocardium was very sensitive for prediction of response to CRT, but at the cost of a low specificity. Conversely, when a larger number of viable segments is present, a substantial increase in specificity is noted—however, with a drop in sensitivity. The optimal cutoff value was identified at 11 (65% in a 17-segment model) viable segments; this value yielded a sensitivity of 74% with a specificity of 87%. Moreover, having a total scar score of >14 appeared to be predictive of a nonresponse (sensitivity, 83%; specificity, 74%) (Figs. 3C and 3D). These cutoff values need further testing in prospective, larger studies on patients undergoing CRT.
CONCLUSION
The presence of myocardial viability is directly related to response to CRT in patients with ischemic cardiomyopathy. A cutoff value of ≥11 viable segments on 18F-FDG imaging yielded a sensitivity of 74% and a specificity of 87% to predict the response to CRT.
Acknowledgments
This work was supported by the Dutch Heart Foundation grant 2002B109.
Footnotes
-
COPYRIGHT © 2006 by the Society of Nuclear Medicine, Inc.
References
- Received for publication April 13, 2006.
- Accepted for publication June 26, 2006.


Jump to section
Related Articles
Cited By...
- Cardiac Resynchronization Therapy With Multipoint Left Ventricular Lead Pacing
- Influence of Pacing Site Characteristics on Response to Cardiac Resynchronization Therapy
- Radial Strain Delay Based on Segmental Timing and Strain Amplitude Predicts Left Ventricular Reverse Remodeling and Survival After Cardiac Resynchronization Therapy
- Impact of Myocardial Scarring on Outcomes of Cardiac Resynchronization Therapy: Extent or Location?
- Relative Merits of Left Ventricular Dyssynchrony, Left Ventricular Lead Position, and Myocardial Scar to Predict Long-Term Survival of Ischemic Heart Failure Patients Undergoing Cardiac Resynchronization Therapy
- Finding Pieces of the Puzzle of Nonresponse to Cardiac Resynchronization Therapy
- Electrocardiogram-Gated 18F-FDG PET/CT Hybrid Imaging in Patients with Unsatisfactory Response to Cardiac Resynchronization Therapy: Initial Clinical Results
- Stress echocardiography for selecting potential responders to cardiac resynchronisation therapy
- Nuclear Imaging in Cardiac Resynchronization Therapy