


Abstract
Recently, cardiac resynchronization therapy (CRT) has become implemented in the treatment of patients with severe heart failure. Although the improvement in systolic function after CRT implantation can be considerable, 20%–30% of patients do not respond to CRT. Evidence is accumulating that the presence of left ventricular (LV) dyssynchrony is mandatory for a response to CRT. Since the early 1980s attempts have been made to assess cardiac dyssynchrony with nuclear imaging, and it has been reported recently that information on LV dyssynchrony can be obtained from gated myocardial perfusion SPECT with phase analysis. Other studies with SPECT have shown that extensive scar tissue will limit the response to CRT; similarly, it has been demonstrated that viable tissue (assessed with SPECT) in the target zone for the LV pacing lead (usually the lateral wall) is needed for a response to CRT. Moreover, studies with PET have provided insight into the changes in myocardial perfusion, metabolism, and efficiency after CRT. In the current review, a comprehensive summary is provided on the potential role of nuclear imaging in the selection of heart failure patients for CRT. The value of other imaging techniques is also addressed.
Heart failure is a major health care problem in the Western world that will continue to worsen as the aged population increases. In the United States, approximately 5 million patients have heart failure, and each year >550,000 patients are newly diagnosed with heart failure (1). Despite optimal medical therapy and recent advances in heart failure treatment, the 5-y mortality still exceeds 50%.
Cardiac resynchronization therapy (CRT) has been demonstrated to be beneficial in patients with end-stage heart failure (2). Thus far, 8 large randomized, clinical trials on CRT have been completed (2–9), and the most important results are summarized in Table 1.
Results of CRT in Large Randomized, Clinical Trials
Various randomized studies have shown improvement in the New York Heart Association (NYHA) functional class, quality of life, and exercise capacity after CRT implantation (2–5,7). In addition, it has been demonstrated that CRT reduces hospitalization for heart failure and increases survival (8,9). The recent Cardiac Resynchronization-Heart Failure (CARE-HF) study focused primarily on morbidity and mortality, and a clear survival benefit after CRT implantation could be demonstrated as compared with optimized medical therapy alone (9).
Various imaging techniques can be applied to evaluate the effect of CRT and in the selection of potential candidates for CRT implantation. In this review, the role of nuclear imaging in patient selection and in evaluation of the effects of CRT is discussed.
NUCLEAR IMAGING FOR EVALUATION OF EFFECTS OF CRT
Several positive inotropic agents can be used to enhance systolic function in patients with heart failure; however, these drugs fail to improve patient longevity. It has been shown that dobutamine increased myocardial oxygen consumption (MVo2) not only by increasing the heart rate but also on a per-beat basis (10–12). The already failing heart was forced to increase its energy usage, contributing to the adverse impact of these agents. Similarly, it has been questioned whether the increased systolic function after CRT would be accompanied by an increase in energy cost.
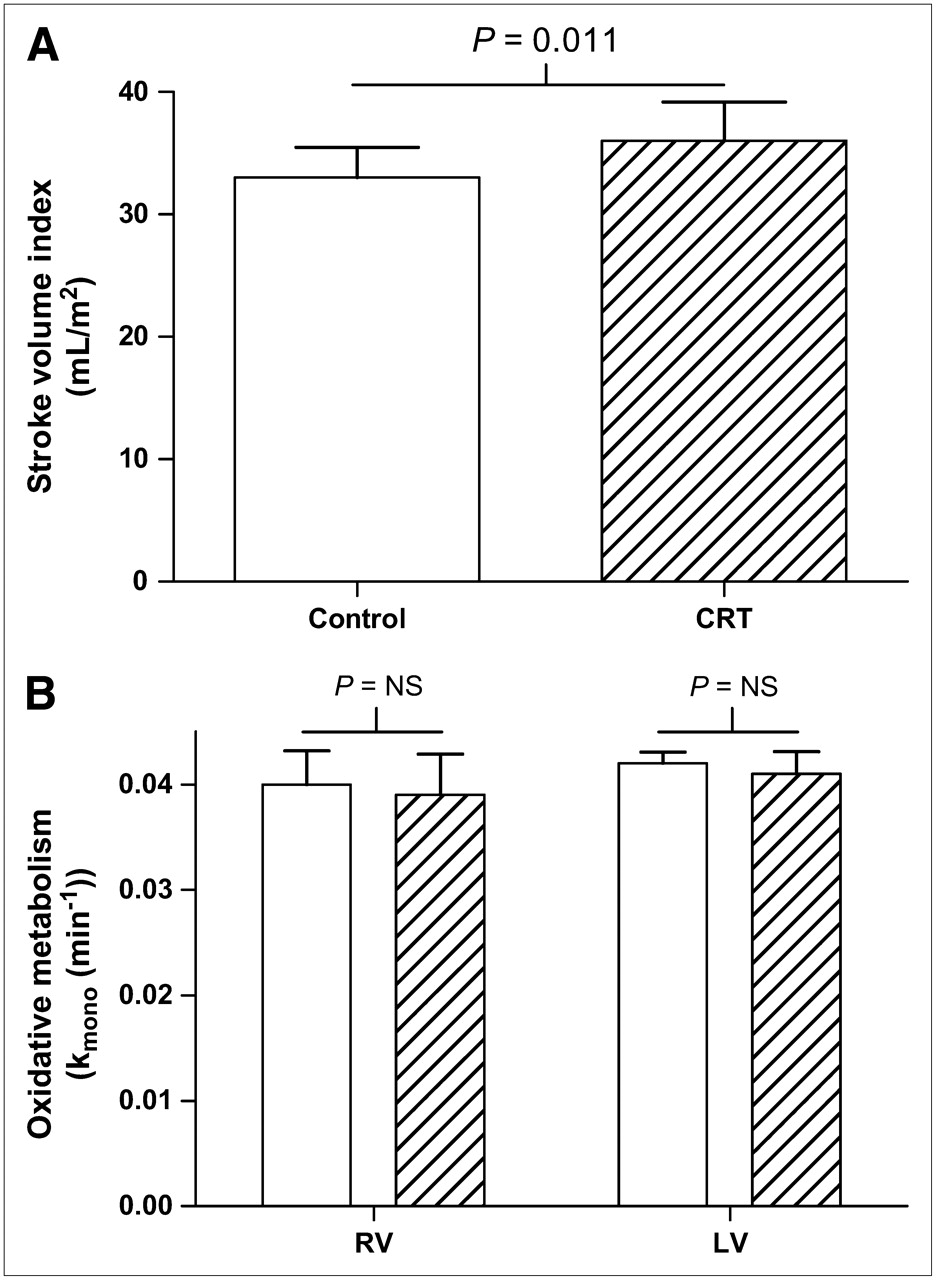
Sundell et al. (13) evaluated the effects of long-term CRT on left ventricular (LV) energetics and metabolic reserve in 10 patients with idiopathic dilated cardiomyopathy. All patients underwent CRT implantation 8 ± 5 mo before study enrollment and were evaluated under 2 conditions: while CRT was “on” and after CRT was “off” for 24 h. LV function and oxidative metabolism were evaluated by echocardiography and 11C-acetate PET, respectively, at rest and during dobutamine-induced stress. The authors showed that when CRT was off, LV stroke volume decreased significantly (from 72 ± 18 to 63 ± 15 mL; P < 0.05), whereas LV oxidative metabolism remained unchanged, thus resulting in a significant decline in myocardial efficiency. During dobutamine-induced stress, there was no significant difference in LV stroke volume and oxidative metabolism between CRT on and CRT off. However, a nonsignificant tendency toward a reduction in myocardial efficiency and metabolic reserve (the response of oxidative metabolism to dobutamine) was noted when CRT was off. Several other studies have evaluated the effect of CRT on MVo2 with 11C-acetate (13–18) (Table 2). All studies demonstrated no significant change in the global MVo2, whereas a significant improvement in LV systolic function (13,15–18) and a decrease in LV diameters (14,18) could be observed. Ukkonen et al. (16) investigated the effect of CRT on myocardial oxidative metabolism and efficiency in 8 patients with severe heart failure during atrial pacing (control) and biventricular pacing. The authors reported a significant improvement in LV function (stroke volume index, 33 ± 7 vs. 36 ± 9 mL/m2; P = 0.011) with CRT, without a change in global myocardial oxidative metabolism (Figs. 1 and 1B).

(A) Stroke volume index control vs. CRT. CRT significantly increased stroke volume index. Open bar = CRT on; hatched bar = control. (Based on (16).) (B) Right ventricular (RV) and LV myocardial oxidative metabolism with CRT on vs. CRT off. RV and LV myocardial oxidative metabolism index (kmono) were unchanged by CRT. Open bars = CRT on; hatched bars = CRT off. NS = not significant. (Adapted from (16).) All data are expressed as mean ± SD.
Effect of CRT on Global MVo2, MBF, and Regional Glucose Use as Measured by PET
In addition, 8 studies (124 patients; Table 2) have investigated the effect of CRT on myocardial blood flow (MBF) (13–15,18–22). None of these studies demonstrated a statistically significant difference in global MBF with CRT compared with no CRT. Knaapen et al. (22) investigated the effects of CRT on MBF and myocardial perfusion reserve in 14 patients with heart failure. All patients underwent PET with 15O-water at baseline, after 3 mo of CRT on and shortly after cessation of CRT, to evaluate global MBF. Although there was a trend toward a reduction in MBF during CRT (0.69 ± 0.24 vs. 0.82 ± 0.25 mL·min−1·mL−1; P = 0.09), no statistically significant differences were observed in resting global MBF between baseline, CRT on, and CRT off. However, a significant increase in LV ejection fraction (LVEF) was observed after 3 mo of CRT compared with baseline (37% ± 9% vs. 25% ± 7%; P < 0.01). The authors concluded that global resting MBF is not altered by CRT despite an increase in LV function, suggesting an improvement in LV efficiency. Similar findings were reported by Lindner et al. (18); global MBF did not change, but the authors noted a more homogeneous distribution of MBF throughout the LV after CRT.
The effect of CRT on myocardial glucose use has been studied with 18F-FDG PET (Table 2) (21,23). Before CRT implantation, glucose uptake was reduced in the septum compared with that in the lateral wall. During CRT, a more homogeneous distribution of glucose uptake was noted. The studies discussed earlier demonstrate that the benefits of CRT are not accompanied by an increase in global MVo2 or MBF, although regional changes were noted. CRT may induce a more balanced wall stress and energy requirements as shown by the more homogenous myocardial uptake of glucose with CRT.
ROLE OF CARDIAC DYSSYNCHRONY IN PREDICTION OF RESPONSE TO CRT
The current selection criteria for CRT are severe heart failure (NYHA class III or class IV), an LVEF of <35%, and a wide QRS complex (>120 ms) (24). However, it has been demonstrated that a consistent percentage of patients (approximately 20%–30%) do not respond to CRT when the current selection criteria are applied (2). In addition, it has been noted that, for a response to CRT, the presence of cardiac mechanical dyssynchrony is important, and various types of mechanical dyssynchrony can be present: (a) atrioventricular dyssynchrony (i.e., dyssynchrony between atrial contraction and ventricular contraction), (b) interventricular dyssynchrony (dyssynchrony between the LV and the right ventricle [RV]), and (c) LV intraventricular dyssynchrony (dyssynchrony within the LV).
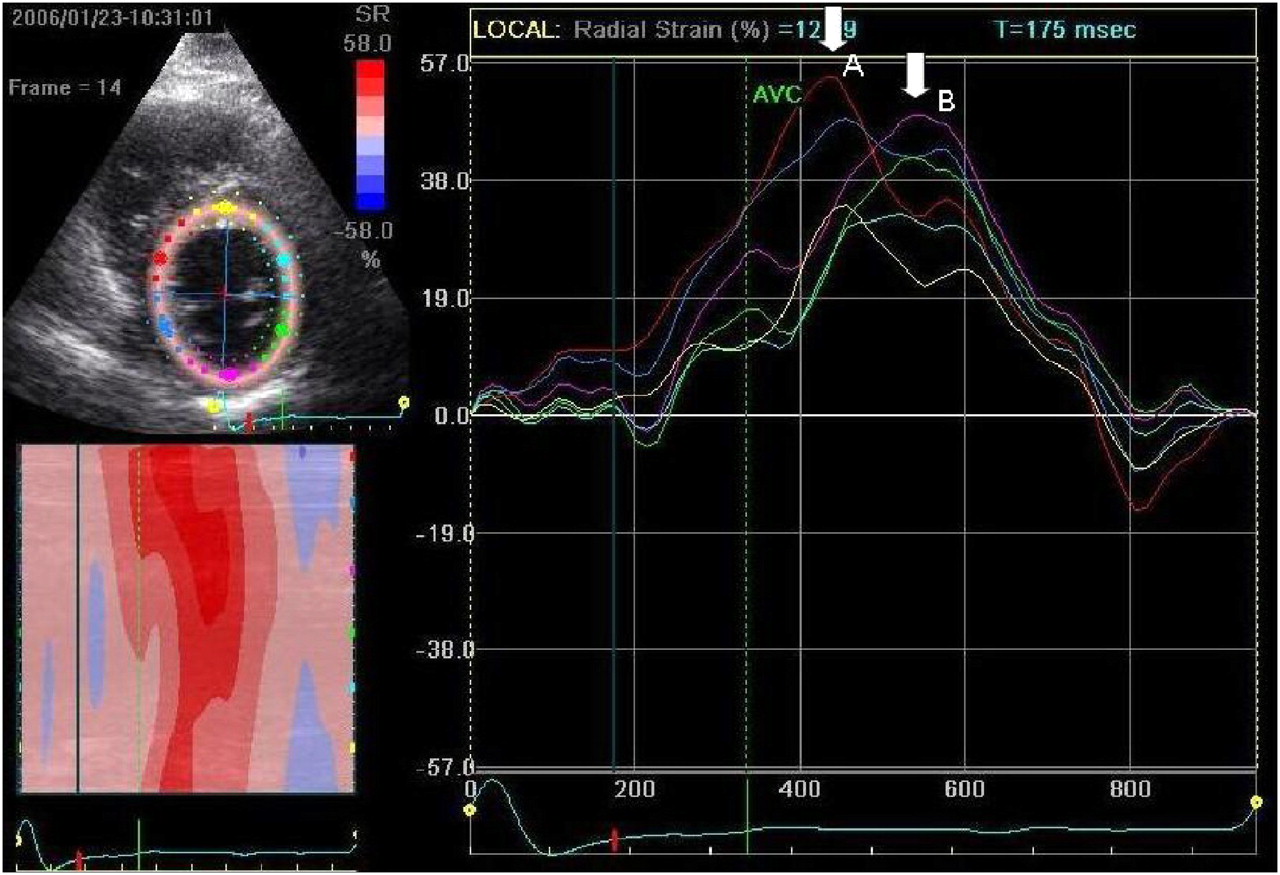
However, it is currently unknown which of these dyssynchronies is most important for the response to CRT. It has been suggested that QRS duration reflects interventricular dyssynchrony rather than LV dyssynchrony (25), thus making QRS duration a less suitable parameter for prediction of a response. It was reported that in approximately 30% of patients with a wide QRS complex, LV dyssynchrony was absent, whereas one third of the patients with a narrow QRS complex exhibited substantial LV dyssynchrony (26). Several studies have suggested that LV dyssynchrony may predict a response to CRT more accurately and, indeed, it was demonstrated that patients with LV dyssynchrony as assessed with tissue Doppler imaging (TDI) were more likely to respond to CRT (27). However other imaging techniques can also provide valuable information on the presence of LV dyssynchrony. Recently, Suffoletto et al. (28) demonstrated in 50 patients with CRT that baseline speckle-tracking radial dyssynchrony of ≥130 ms predicted a significant increase in LVEF (≥15%) at long-term follow-up, with a sensitivity of 89% and a specificity of 83%. An example of radial dyssynchrony assessment with speckle-tracking is provided in Figure 2. In addition to echocardiographic techniques, evaluation of cardiac dyssynchrony with nuclear imaging has also been attempted, especially with phase analysis of radionuclide angioscintigraphy (29–32).

Echocardiography with speckle tracking–derived radial strain imaging in parasternal short-axis view. Septal regions reach peak radial strain early in systole (white arrow A), whereas lateral regions reach peak radial strain late in systole (white arrow B). This finding indicates a dyssynchronous LV contraction.
NUCLEAR IMAGING TECHNIQUES FOR ASSESSMENT OF CARDIAC DYSSYNCHRONY
Since the early 1980s, nuclear imaging techniques have been investigated for the assessment of dyssynchronous cardiac contraction. Most studies were performed with gated blood-pool ventriculography and phase analysis for evaluation of cardiac dyssynchrony.
Phase image analysis is based on the first Fourier harmonic fit of the blood-pool time-versus-radioactivity curve. The result is a cosine curve that can be characterized by its amplitude and phase angle. The amplitude is the magnitude or the depth of the fitted curve and is insensitive to the timing or the phase angle. The phase angle refers to the timing or the placement of the cosine curve within the cardiac cycle, from 0° to 360° (33). The earliest ventricular phase angle relates to the time of the onset of the ventricular contraction, the mean ventricular phase angle reflects the mean time of the onset of the ventricular contraction, and the standard deviation (SD) of the ventricular phase angle relates to the synchrony of the ventricular contraction (33).
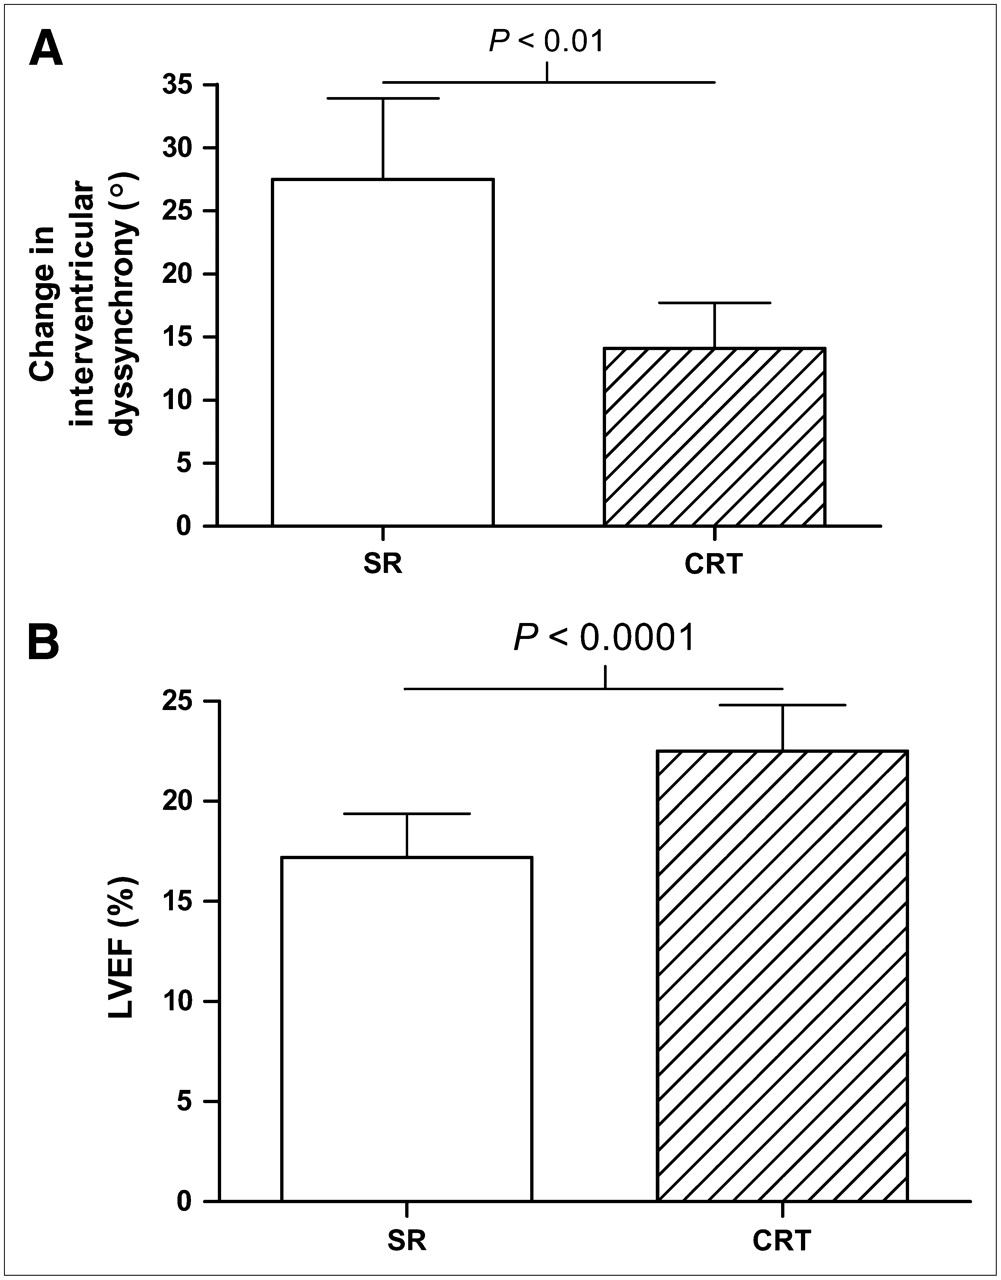
Kerwin et al. (29) have investigated 13 patients with dilated cardiomyopathy and intraventricular conduction delay with multiple gated equilibrium blood-pool scintigraphy to measure ventricular contractile synchrony. For this purpose, phase image analysis was applied to the scintigraphic data. Interventricular contractile synchrony was measured as the absolute difference in RV and LV mean phase angles, whereas LV intraventricular synchrony was measured as the SD of the mean phase angle for the LV. Patients were imaged in sinus rhythm as well as during atrial sensed biventricular pacing to evaluate the effect of biventricular pacing on contractile synchrony and LVEF. In sinus rhythm, all patients showed to some extent contractile dyssynchrony. During biventricular pacing, 9 of the 13 patients showed improvement of interventricular synchrony. For the group overall, a decrease in interventricular dyssynchrony of 27.5° ± 23.1° to 14.1° ± 13.0° (P = 0.01) was demonstrated (Fig. 3A). In contrast, the LV intraventricular dyssynchrony increased significantly during biventricular pacing (32.8° ± 26.2° to 38.5° ± 22.0°; P = 0.02). During biventricular pacing, an increase in LVEF was observed (17% ± 7% to 23% ± 8%; P < 0.05) (Fig. 3B). The degree of improvement of interventricular dyssynchrony during biventricular pacing correlated well with the increase in LVEF (r = 0.86; P < 0.001), whereas no significant correlation was observed between baseline QRS duration and the improvement in LVEF.

(A) Change in interventricular dyssynchrony: sinus rhythm (SR) vs. CRT. Interventricular dyssynchrony decreased significantly during CRT compared with SR. Open bar = SR; hatched bar = CRT on. (Based on (29).) (B) Change in LVEF: SR vs. CRT. LVEF increased significantly during CRT compared with SR. Open bar = SR; hatched bar = CRT on. (Based on (29).) All data are expressed as mean ± SD.
The prognostic value of interventricular and intraventricular dyssynchrony was studied by Fauchier et al. (30) in a large patient population (n = 103) with idiopathic dilated cardiomyopathy. All patients underwent multigated equilibrium blood-pool scintigraphy. Furthermore, a hemodynamic study was performed and the risk of ventricular arrhythmia was evaluated. Phase images were generated from the scintigraphic data, and mean phase angles and SDs were computed for RV and LV. During a follow-up period of 27 ± 23 mo, 7 patients died from a cardiac event and 11 patients underwent heart transplantation due to worsening heart failure. It was shown by multivariate analysis that LV intraventricular dyssynchrony and increased pulmonary capillary wedge pressure were the only independent predictors of cardiac events. The same authors also studied a control group of 20 healthy individuals (30). Accordingly, they set the upper limits for interventricular dyssynchrony at 40 ms and for LV intraventricular dyssynchrony at 45 ms, based on the mean values + 2 SD (31). Application of these normal values to the 103 patients described earlier demonstrated that LV intraventricular dyssynchrony was observed in the majority of patients with left bundle branch block. However, LV intraventricular dyssynchrony was also present in 78% of the patients with an incomplete left bundle branch block and in 41% of the patients with a normal QRS duration (31). Toussaint et al. (32) prospectively investigated the long-term effects of biventricular pacing on ventricular electromechanical resynchronization with radionuclide angioscintigraphy phase analysis. Thirty-four patients with severe heart failure (NYHA functional class III–IV), an LVEF of <40%, and a wide QRS (>150 ms) with a left bundle branch block pattern underwent radionuclide angioscintigraphy before CRT implantation, 8 d after implantation, and thereafter every 6 mo. Follow-up duration was 20 ± 7 mo. It was shown that biventricular pacing early after implantation reduced electrical and mechanical dyssynchrony and improved clinical status. Furthermore, these changes were maintained during follow-up, whereas LV function improved progressively (LVEF improved from 20.2% ± 8.1% at baseline to 23.3% ± 11.2% early after implantation to 27.4% ± 12.3% at late follow-up, P < 0.003).
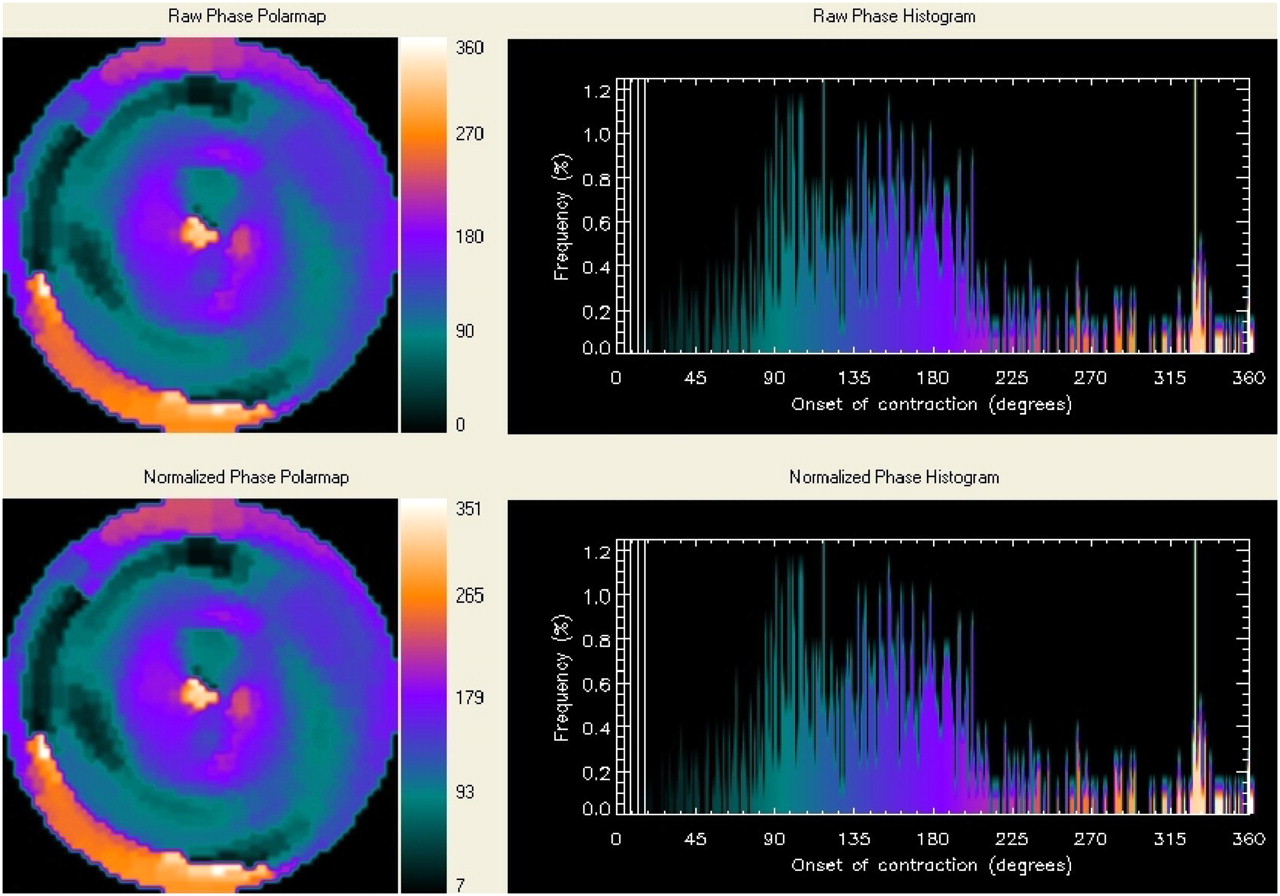
Chen et al. (34) developed a count-based method using gated myocardial perfusion SPECT to assess synchrony of LV mechanical contraction. This count-based method allows extraction of amplitude (which reflects systolic wall thickening) and phase from the regional LV count changes throughout the cardiac cycle. The phase information is related to the time interval when a region in the LV myocardial wall starts to contract. Figure 4 shows an example of a patient with important LV dyssynchrony. The authors investigated 90 healthy individuals to create a normal database. Recently, LV dyssynchrony assessment with gated myocardial perfusion SPECT and phase analysis was compared with LV dyssynchrony assessment with TDI in 75 patients with severe heart failure (35). It was shown that of the 4 quantitative indices of phase analysis, the variables histogram bandwidth and phase SD correlated best with LV dyssynchrony as assessed with TDI. A future application of phase analysis with gated myocardial perfusion SPECT could be the identification of patients with severe heart failure who might benefit from CRT. Furthermore, the site of the latest activation can also be identified with this technique. This could be of great value in deciding on optimal LV lead positioning. However, for validation of this technique in daily clinical practice large outcome studies are needed.

Example of phase analysis with gated myocardial perfusion SPECT in patient with important LV dyssynchrony. Nonnormalized (upper) and normalized (lower) phase distributions show significant nonuniformity and corresponding phase histograms are widely spread distributions.
Echocardiography is currently preferred for assessment of resynchronization after device implantation. However, if information on LV volumes/LVEF and perfusion/ischemia is needed, gated myocardial perfusion SPECT may be considered.
IMPORTANCE OF SCAR TISSUE AND MYOCARDIAL VIABILITY
Besides the presence or absence of cardiac dyssynchrony, other factors can potentially influence the response to CRT. The relationship between QRS duration, LV volumes, and prevalence of nonviable tissue in the inferolateral wall in patients with coronary artery disease (CAD) was studied by De Winter et al. (36). Patients with a QRS duration of >120 ms had significantly higher end-diastolic and end-systolic LV volumes; however, no significant relation between QRS duration and LVEF could be demonstrated. In addition, nonviable tissue in the inferior or lateral wall was more frequently present in patients with a QRS of >120 ms than in patients with a QRS of <120 ms (29% vs. 7%; P < 0.01). The authors suggested that this could be one explanation of why CRT is ineffective in a substantial number of patients with CAD. Also, it has been suggested that the presence of extensive scar tissue in the region in which the LV pacing lead is positioned (usually the posterolateral region) may hamper the response to CRT (37,38). Ypenburg et al. (37) have evaluated the presence of scar tissue with gated SPECT using 99mTc-tetrofosmin before CRT implantation. Patients without scar tissue in the LV pacing target region significantly improved in the NYHA class, quality of life, 6-min walk test, LV volumes, and LVEF at 6-mo follow-up, whereas no improvement was observed in patients with scar tissue.
Furthermore, the extent of viable myocardium in itself was positively related to the decrease in LV volumes and the improvement in LVEF. Similarly, the number of scar segments (total scar score) was inversely related to the changes in LV volumes and LVEF.
Sciagrà et al. (39) reported similar findings; patients with extensive resting perfusion defects had a limited clinical response to CRT, without reverse LV remodeling; conversely, patients with smaller defects showed significant reverse LV remodeling. Adelstein and Saba (40) used 201Tl SPECT and showed that a larger scar burden was related to the nonresponse to CRT.
Ypenburg et al. (41) reported on the prediction of the response to CRT using FDG imaging. The clinical response to CRT could be predicted with a sensitivity of 74% and a specificity of 87% when substantial viability was present. Likewise, extensive scar tissue could predict a nonresponse to CRT with a sensitivity of 83% and a specificity of 74%. These findings suggest that improvement of LV function is prohibited in the presence of extensive scar tissue.
WHAT CAN OTHER IMAGING MODALITIES OFFER?
Besides nuclear imaging, other imaging modalities are frequently used in evaluation of patients who may benefit from CRT. A well-investigated imaging technique is 2D echocardiography, especially TDI and strain imaging, for the assessment of LV dyssynchrony. Recent data have shown that the presence of LV dyssynchrony is an important predictor of response to CRT (27). Bax et al. (27) have studied the prognostic value of LV dyssynchrony in 85 patients with end-stage heart failure, wide QRS complex (>120 ms), and left bundle branch block. The only difference in baseline variables was the presence of extensive LV dyssynchrony (87 ± 49 ms) in responders to CRT (as compared with 35 ± 20 ms in nonresponders, P < 0.01). A cutoff value of 65 ms for LV dyssynchrony was predictive both for response to CRT and for long-term prognosis.
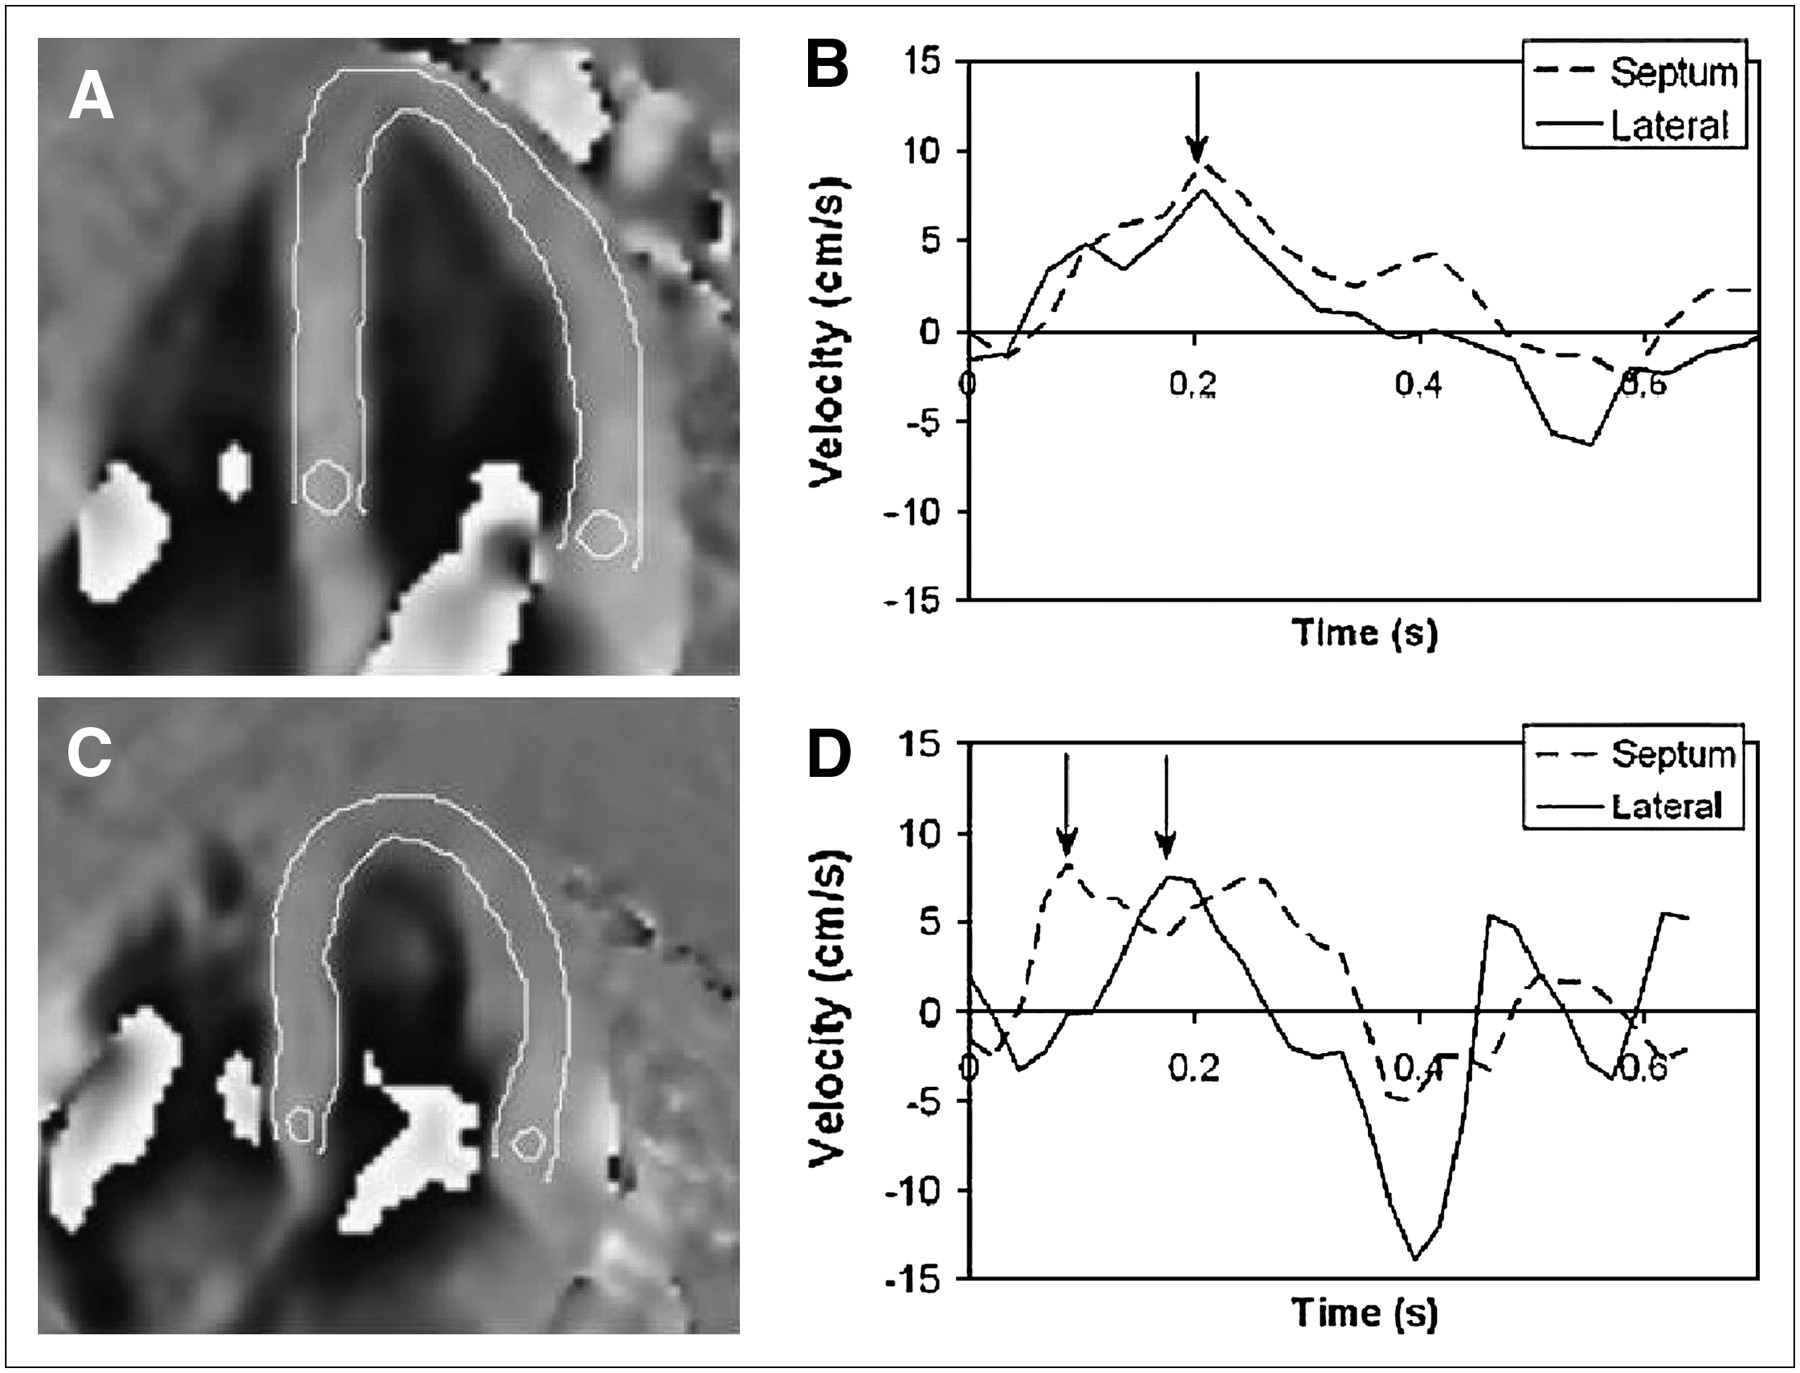
Another imaging modality available for LV dyssynchrony evaluation is cardiac MRI. Westenberg et al. (42) have compared LV dyssynchrony assessment by TDI with LV dyssynchrony assessment by velocity encoded (VE) MRI in 20 patients with heart failure. LV dyssynchrony assessment by VE MRI was demonstrated to correlate well with LV dyssynchrony assessment by TDI (r = 0.97, P < 0.01). Bland–Altman analysis showed a small, nonsignificant underestimation of 6 ± 9 ms in LV dyssynchrony with VE MRI compared with TDI. Examples of VE MRI are shown in Figure 5.

Example of assessment of LV dyssynchrony with VE MRI in healthy individual (A and B) and in patient with substantial LV dyssynchrony (C and D). (A) VE cardiac MR image in longitudinal long-axis orientation at midsystole of healthy individual. Sample volumes are placed at basal level of septum and lateral wall. (B) Corresponding velocity graph shows absence of LV dyssynchrony (arrow). (C) VE MR image in longitudinal long-axis orientation at midsystole of patient with substantial LV dyssynchrony (arrow). Sample volumes are placed at basal level of septum and lateral wall. (D) Corresponding velocity graph shows substantial LV dyssynchrony of 115 ms (left arrow indicating peak systolic velocity of the septum and right arrow indicating peak systolic velocity of the lateral wall). (Modified from (42).)
An important advantage of MRI is the possibility of visualizing scar tissue using contrast-enhanced imaging. Bleeker et al. (38) have investigated the relationship between the response to CRT and the presence of scar tissue in the posterolateral wall in 40 patients with ischemic heart failure. After a 6-mo follow-up, 23 patients responded to CRT with an improvement in the NYHA class and an increase in the 6-min walking distance. Furthermore, 21 of the 26 (81%) patients without transmural scar tissue in the posterolateral region responded to CRT compared with only 2 of the 14 (14%) patients with transmural scar tissue in the posterolateral area. Moreover, patients without transmural posterolateral scar exhibited a statistically significant increase in LVEF at 6-mo follow-up compared with patients with transmural posterolateral scar (24% ± 7%–32% ± 10%; P < 0.05 vs. 22% ± 7%–23% ± 10%; P = NS, respectively) (Fig. 6A). No statistically significant difference in LV dyssynchrony was present between both groups at baseline. However, patients with transmural posterolateral scar exhibited no significant reduction in LV dyssynchrony the day after CRT implantation, which was suggested to indicate the absence of LV resynchronization. In addition, it was observed that patients without transmural posterolateral scar and severe baseline LV dyssynchrony (≥65 ms) showed an excellent response rate to CRT of 95% (38). An example of a patient with scar tissue in the posterolateral region is provided in Figure 6B.

(A) Change in LVEF at baseline and after 6 mo of CRT: patients with transmural posterolateral scar compared with patients without transmural posterolateral scar. Open bars = baseline; hatched bars = 6-mo follow-up after CRT. All data are expressed as mean ± SD. (Based on (38).) (B) Short-axis contrast-enhanced MR image shows extensive transmural scar tissue in posterolateral region (white arrows).
Recently, increasing interest has been focused on visualization of the coronary veins with multislice CT (MSCT). Knowledge of the cardiac venous anatomy may be helpful for successful LV lead placement in patients scheduled for CRT. Van de Veire et al. (43) have retrospectively investigated the cardiac venous anatomy in 100 patients with 64-slice MSCT to evaluate the relationship between variations in cardiac venous anatomy and previous myocardial infarction. The coronary sinus, anterior interventricular vein, and posterior interventricular vein could be visualized in nearly all patients. However, in patients with a history of myocardial infarction, the left marginal vein was significantly detected less often (27%). These findings suggest that patients with previous infarction may have less suitable venous anatomy for LV lead placement, and surgical (epicardial) LV lead positioning may be considered. An example of cardiac venous anatomy in a patient with a previous infarction is provided in Figure 7.
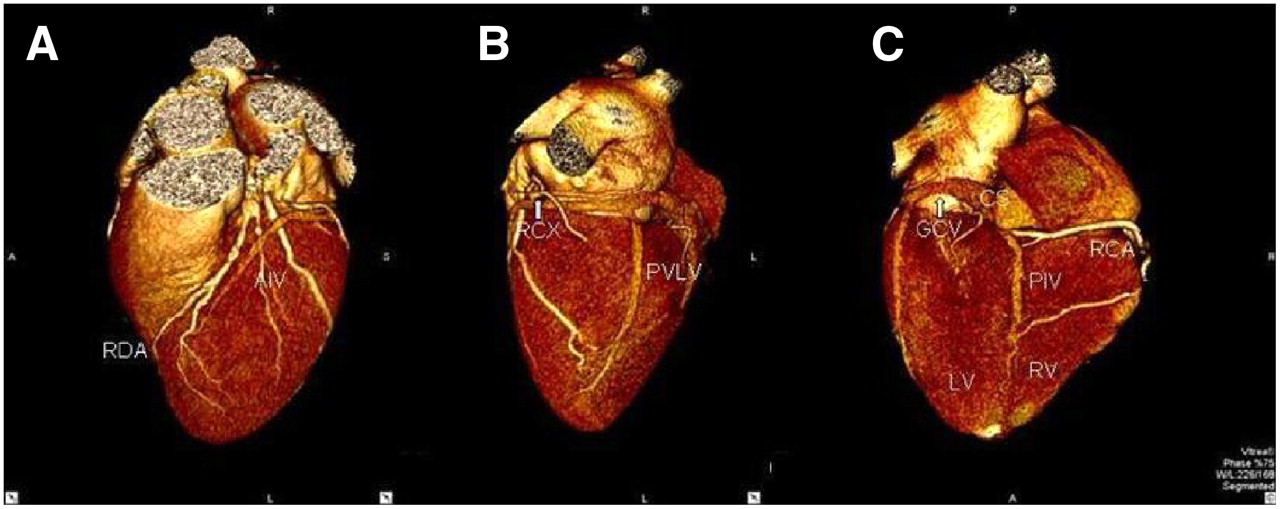
Example of venous anatomy with MSCT in patient with previous anterior myocardial infarction: volume-rendered reconstruction of heart. (A) Posterior view. (B) Lateral view. (C) Anterior view. First tributary of coronary sinus (CS) is posterior interventricular vein (PIV), running in posterior interventricular groove (A). Second tributary of CS is posterior vein of left ventricle (PVLV); great cardiac vein (GCV) will then continue as anterior interventricular vein (AIV) (B and C). Left marginal vein is absent. Also note ramus descendens anterior (RDA), ramus circumflexus (RCX), and right coronary artery (RCA).
CONCLUSION
Various issues are important in the selection of heart failure patients who are considered for CRT implantation (Fig. 8). Substantial ventricular dyssynchrony (primarily LV dyssynchrony) needs to be present to permit the response to CRT. In addition, the extent and location of scar (and viable myocardium) are important. Scar tissue in the region of the LV pacing lead prohibits a response to CRT, but also extensive scar formation in the LV hampers a response to CRT. Finally, the venous anatomy is important. In the absence of suitable cardiac veins (as may be observed in patients with previous infarction), transvenous LV lead implantation is not possible and surgical LV lead positioning may be considered. Nuclear imaging can partially provide the information needed for CRT. Recent SPECT studies with phase analysis suggest good accuracy to detect LV dyssynchrony. At present, LV dyssynchrony assessment is performed primarily by echocardiography. Assessment of scar tissue and viability with nuclear imaging is considered one of the most reliable approaches. This may also be assessed by contrast-enhanced MRI. Assessment of venous anatomy is not feasible with nuclear imaging. The precise role of nuclear imaging versus other imaging techniques in patients considered for CRT needs to be established in the coming years. However, many patients with heart failure undergo nuclear imaging with SPECT, and integrated assessment of LV dyssynchrony, viability, and scar tissue may be an attractive option.
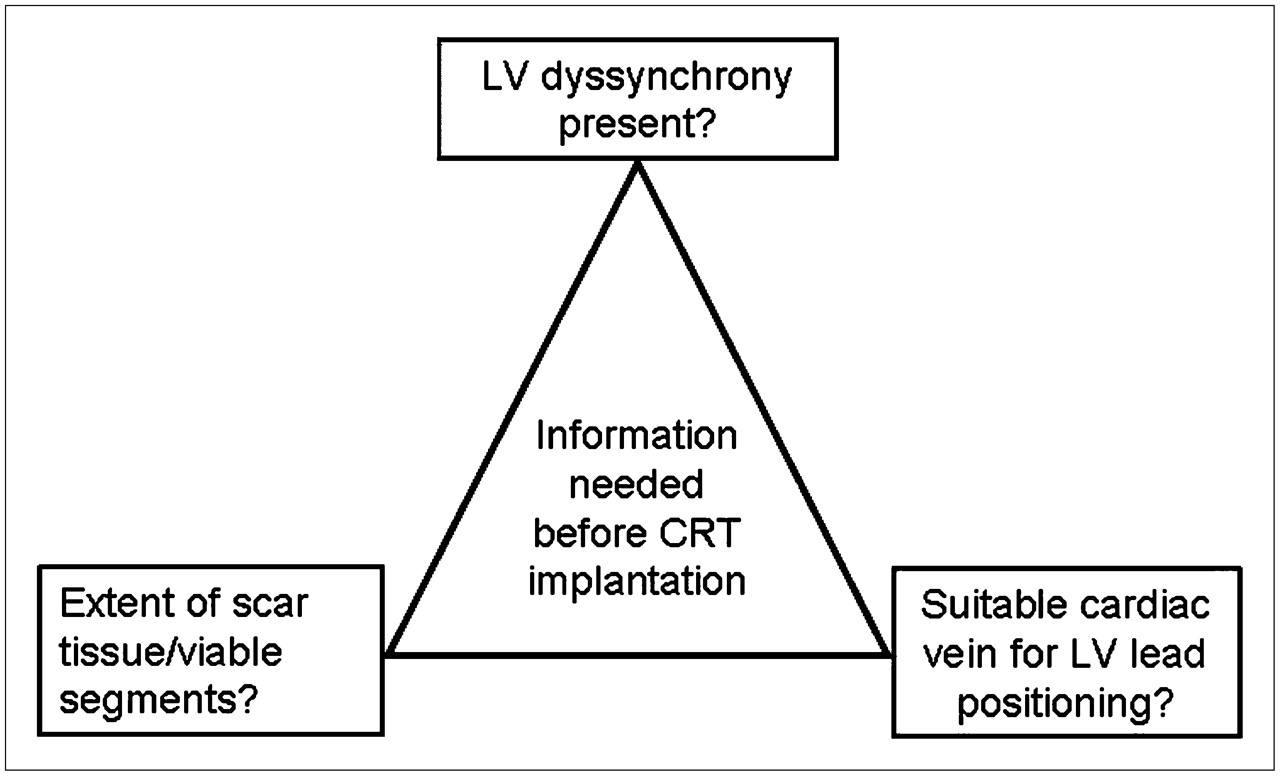
Information that is needed before CRT implantation: a noninvasive approach. Presence of LV dyssynchrony can be assessed not only with echocardiographic techniques but also with nuclear imaging and with VE MRI. For evaluation of extent of scar tissue and extent of viable myocardium, nuclear imaging and MRI can be used, whereas MSCT can be of value for evaluating venous anatomy before LV lead implantation.
Acknowledgments
This research was supported by grant 2002B109 from the Dutch Heart Foundation. Ernest V. Garcia receives royalties from the sale of the Emory Cardiac Toolbox. The terms of this arrangement have been reviewed and approved by Emory University in accordance with its conflict-of-interest practice.
Footnotes
-
↵* NOTE: FOR CE CREDIT, YOU CAN ACCESS THIS ACTIVITY THROUGH THE SNM WEB SITE (http://www.snm.org/ce_online) THROUGH DECEMBER 2008.
-
No potential conflict of interest relevant to this article was reported.
-
COPYRIGHT © 2007 by the Society of Nuclear Medicine, Inc.
References
- Received for publication February 1, 2007.
- Accepted for publication May 31, 2007.


Jump to section
- Article
- Abstract
- NUCLEAR IMAGING FOR EVALUATION OF EFFECTS OF CRT
- ROLE OF CARDIAC DYSSYNCHRONY IN PREDICTION OF RESPONSE TO CRT
- NUCLEAR IMAGING TECHNIQUES FOR ASSESSMENT OF CARDIAC DYSSYNCHRONY
- IMPORTANCE OF SCAR TISSUE AND MYOCARDIAL VIABILITY
- WHAT CAN OTHER IMAGING MODALITIES OFFER?
- CONCLUSION
- Acknowledgments
- Footnotes
- References
- Figures & Data
- Info & Metrics
Related Articles
Cited By...
- No citing articles found.