


Abstract
High photon attenuation and scatter in obese patients affect image quality. The purpose of the current study was to optimize lutetium orthosilicate (LSO) PET image acquisition protocols in patients weighing ≥91 kg (200 lb). Methods: Twenty-five consecutive patients (16 male and 9 female) weighing ≥91 kg (200 lb; range, 91–168 kg [200–370 lb]) were studied with LSO PET/CT. After intravenous injection of 7.77 MBq (0.21 mCi) of 18F-FDG per kilogram of body weight, PET emission scans were acquired for 7 min/bed position. Single-minute frames were extracted from the 7 min/bed position scans to reconstruct 1–7 min/bed position scans for each patient. Three reviewers independently analyzed all 7 reconstructed whole-body images of each patient. A consensus reading followed in cases of disagreement. Thus, 175 whole-body scans (7 per patient) were analyzed for number of hypermetabolic lesions. A region-of-interest approach was used to obtain a quantitative estimate of image quality. Results: Fifty-nine hypermetabolic lesions identified on 7 min/bed position scans served as the reference standard. Interobserver concordance increased from 64% for 1 min/bed position scans to 70% for 3 min/bed position scans and 78% for 4 min/bed position scans. Concordance rates did not change for longer imaging durations. Region-of-interest analysis revealed that image noise decreased from 21% for 1 min/bed position scans to 14%, 13%, and 11% for, respectively, 4, 5, and 7 min/bed position scans. When compared with the reference standard, 14 lesions (24%) were missed on 1 min/bed position scans but only 2 (3%) on 4 min/bed position scans. Five minute/bed position scans were sufficient to detect all lesions identified on the 7 min/bed position scans. Conclusion: Lesion detectability and reader concordance peaked for 5 min/bed position scans, with no further diagnostic gain achieved by lengthening the duration of PET emission scanning. Thus, 5 min/bed position scans are sufficient for optimal lesion detection with LSO PET/CT in obese patients.
Conventional PET attenuation correction is performed using an external transmission source whereby transmission scans are acquired for 3–4 min/bed position. Together with 4 min/bed position emission scans, this results in total PET times of 50–70 min. PET/CT reduces whole-body scanning times to 35 min or less, because whole-body CT data that are acquired in 80 s or less can be used for attenuation correction (1). The higher light output and shorter scintillation decay time of lutetium orthosilicate (LSO) detectors than of bismuth germanate detectors allows the former to handle higher activity concentrations in the field of view, with fewer dead-time losses. These features allow whole-body scans to be acquired in 3-dimensional (3D) mode using the same dose of injected activity as for 2-dimensional (2D) mode, resulting in an enhanced sensitivity (2). 3D acquisition is not limited to LSO PET but has also been used with bismuth germanate–or gadolinium orthosilicate–based PET systems.
Weight-based PET emission protocols for PET/CT can further reduce overall PET/CT times (3). Using this approach, we have demonstrated that emission scans of as short as 1 min/bed position in patients weighing <59 kg (130 lb) provide sufficient image quality. Our initial data had suggested that emission scans of 4 min/bed position would be sufficient to obtain diagnostic PET studies in obese patients (3). However, these data were only preliminary because only a few of the prospectively enrolled patients were obese. PET image quality is always limited in obese patients because of the prominent photon attenuation and high scatter fractions resulting in increased image noise. Thus, an additional study was required to optimize LSO PET acquisition protocols for PET/CT of obese patients.
MATERIALS AND METHODS
Patients
The study population consisted of 25 consecutive patients (16 male and 9 female) with a mean age (±SD) of 57 ± 12 y who underwent clinical PET/CT for staging or restaging of lymphoma (n = 9), breast cancer (n = 6), lung cancer (n = 2), esophageal cancer (n = 2), melanoma (n = 2), colon cancer (n = 1), thyroid cancer (n = 1), endometrial cancer (n = 1), or renal cell cancer (n = 1).
Patient weight averaged 113 ± 23 kg (249 ± 50 lb) and ranged from 91 to 168 kg (200–370 lb). The body mass index (BMI) was calculated according to the most recent guidelines of the National Institutes of Health, whereby a BMI of 25–30 represents overweight, 30–40 represents obesity, and >40 represents malignant obesity (4). The BMI of the study patients averaged 37.1 ± 7.0 and ranged from 26.2 to 50.2.
Image Acquisition
Images were acquired with the Biograph PET/CT scanner (Siemens Medical Solutions). Because this system does not have interplane septa, the PET images are acquired exclusively in 3D mode (5). The absence of septa allows the system to acquire a larger fraction of the emitted photons than is possible with 2D mode. In the latter, detection is restricted to photons emitted within a thin slice, limited by the septa. Thus, sensitivity is higher in 3D mode than in 2D mode, but to fully use the 3D mode, a detection system that can process the higher data rates is necessary (i.e., a system with fast scintillators and electronics).
The PET component of the Biograph is an ECAT ACCEL scanner (CPS Innovations), which acquires 47 transaxial images simultaneously. It consists of 3 rings of 8 × 8 detector blocks, with a total of 144 LSO block detectors in the system. The CT component is a Somatom dual-slice helical scanner (Siemens Medical Solutions), which acquires whole-body scans in less than 80 s. The characteristics of the device have been described in detail previously (3).
All patients fasted for at least 6 h before undergoing PET/CT. Sixty minutes after intravenous injection of 7.77 MBq (0.21 mCi) of 18F-FDG per kilogram of body weight (up to a maximum of 740 MBq [20 mCi]), all patients were positioned on the imaging table with their arms up. After the imaging field had been determined with an initial scout scan, a 80- to 110-s whole-body CT acquisition was performed using the following parameters: 130 kV(p), 120 mA, 1-s tube rotation, 4-mm slice collimation, and a bed speed of 8 mm/s (i.e., pitch = 2). On completion of the CT portion, the PET emission data were acquired for 7 min/bed position for all patients. Imaging included 6–8 bed positions per patient, resulting in whole-body PET emission durations ranging from 42 to 56 min. Patients were instructed to breathe shallowly during the PET and CT portions of the study to minimize misregistration and attenuation artifacts between PET and CT images (6).
Image Reconstruction
The PET images were reconstructed using the CT-based attenuation correction algorithm developed at the University of Pittsburgh (1). In this approach, the Hounsfield units in the CT images are scaled to appropriate attenuation coefficients at 511 keV (1,7). CT images were used both for attenuation correction and for lesion localization.
All PET data were acquired by collecting prompt and accidental events separately. On the Biograph system used in this study, the accidental coincidences can be determined using only the delayed coincidence technique. Thus, estimation of accidental events from single events is not possible.
Shorter PET acquisitions were generated from the original 7 min/bed position scans by using a random subsampling technique of the prompt and accidental coincidence events in the sinogram, as described previously (3). In brief, to generate a single-minute frame, one seventh of the total number of prompt and accidental coincidence events are randomly picked from the sinogram data. Once an event is selected, it is not replaced (i.e., the number of events in the particular sinogram bin is reduced by 1). Once the total number of prompt and accidental events is completely sampled, the accidental events are subtracted from the prompt distribution to produce the net true coincidence distribution. No noise-reducing techniques, such as smoothing, were applied to the accidental events before subtraction, since such techniques are not implemented in the standard software of the Biograph system.
The 7-min and the subsampled scans were reconstructed using an attenuation-weighted ordered-subsets expectation maximization algorithm (2 iterations, 8 subsets) followed by a postreconstruction smoothing gaussian filter (6 mm in full width at half maximum), resulting in an image resolution of 8.8 mm (determined from line source measurements at the center of the field of view). The images were reconstructed in a 128 × 128 matrix without zoom, resulting in a pixel size of 5.1 mm. These processing parameters were the same as used in all routine clinical studies.
Image Analysis
First, all 175 image sets (25 patients; 7 images per patient) were analyzed independently by 3 experienced nuclear medicine physicians. All readers were board-certified nuclear medicine specialists and had more than 2 y of PET/CT experience, including the interpretation of numerous CT scans. This step was included to determine the interobserver variability for each scan. The scans were presented to the readers in the following sequence: 1 min/bed position scans followed by 2, 3, 4, 5, 6, and 7 min/bed position scans. Each reader recorded the number and location of lesions for each of the 175 whole-body image sets (7 per patient). This approach was chosen to minimize a lesion recognition bias introduced by first reviewing scans reconstructed from longer acquisition times. A consensus interpretation followed in cases of disagreement.
A reference standard was established by determining the number and location of hypermetabolic lesions from the 7 min/bed position scans. 18F-FDG uptake was considered abnormal if the hypermetabolic activity was focal and greater than background activity. All hypermetabolic foci had an anatomic correlate. If there had been cases of hypermetabolic foci (by consensus) without an anatomic correlate, they still would have been counted as true abnormalities. Because lesions were not biopsied and the aim of the study was to assess lesion detectability, further classification of abnormal 18F-FDG uptake patterns as malignant or benign was not attempted.
For quality assessment, images were windowed at each interpreter’s preference. Each interpreter then graded image quality subjectively as good (3), moderate (2), poor (1), or nondiagnostic (0). In general, the smoothness versus graininess of the liver was used as a criterion to distinguish poor from moderate quality. Image sharpness, usually seen best in the thorax at the lung/chest wall junction, was used to distinguish good from moderate quality.
Image noise, and thus image quality, was also determined quantitatively as follows: Regions of interest (ROIs) were placed around the liver throughout 3 planes on the 7 min/bed position scans. To ensure that reasonably large ROIs were depicted, we selected the 3 axial planes exhibiting the largest liver diameter. ROIs were then copied to identical planes on each of the single-minute frames obtained for each patient. This approach ensured that image noise was measured for the same ROIs within each patient throughout all 1–7 min/bed position scans. Noise was quantified as follows: 100% × ROI SD/ROI mean, which has been shown to equal image noise in PET (8). Standardized uptake values (SUVs) were then obtained for all recorded lesions (9). Basically, a volume of interest was defined across multiple axial planes of the lesion. Finally, CT lesion size was determined using commercially available software.
Statistical Analysis
Noise was compared between all image sets using ANOVA. Lesion size, SUV, patient weight, and BMI were compared using the unpaired t test.
RESULTS
Lesion Distribution, Lesion Size, and SUV
Fifty-nine hypermetabolic lesions were identified on 7 min/bed position reference standard images. Thirty-three (56%) were located in the chest, 10 in the pelvis (17%), 9 in the abdomen (15%), and 7 in the head and neck region (12%). Forty-one percent of the lesions corresponded to masses on CT, and 59% to lymph nodes.
Mean lesion size was 1.8 ± 1.3 cm (range, 0.8–7.9 cm). Maximum SUVs averaged 4.5 ± 3.9 (range, 0.8–17.6). Forty-three of the 59 lesions (73%) were smaller than 2 cm. All hypermetabolic lesions corresponded to anatomic abnormalities on CT. Twenty-seven of the 59 lesions (46%) had a maximum SUV below 3.0. Thus, the study sample included a considerable number of small, only mildly hypermetabolic lesions.
Lesion Detectability
Fifty-nine lesions were identified by consensus on 7 min/bed position scans and were used as the reference standard. Fourteen of these (24%) were missed on 1 min/bed position scans, 12 (20%) on 2 min/bed position scans, 9 (15%) on 3 min/bed position scans, and 2 (3%) on 4 min/bed position scans (Table 1). As expected, mean lesion size and maximum SUVs were lower for the 14 lesions that were missed on shorter scans (Table 2). Thus, 4 min/bed position scans were sufficient to detect 57 (97%) of 59 lesions in patients weighing more than 91 kg (200 lb), whereas 5 min/bed position scans were sufficient to detect all lesions (100%) identified on 7 min/bed position scans. Figures 1 and 2 represent 2 typical cases.
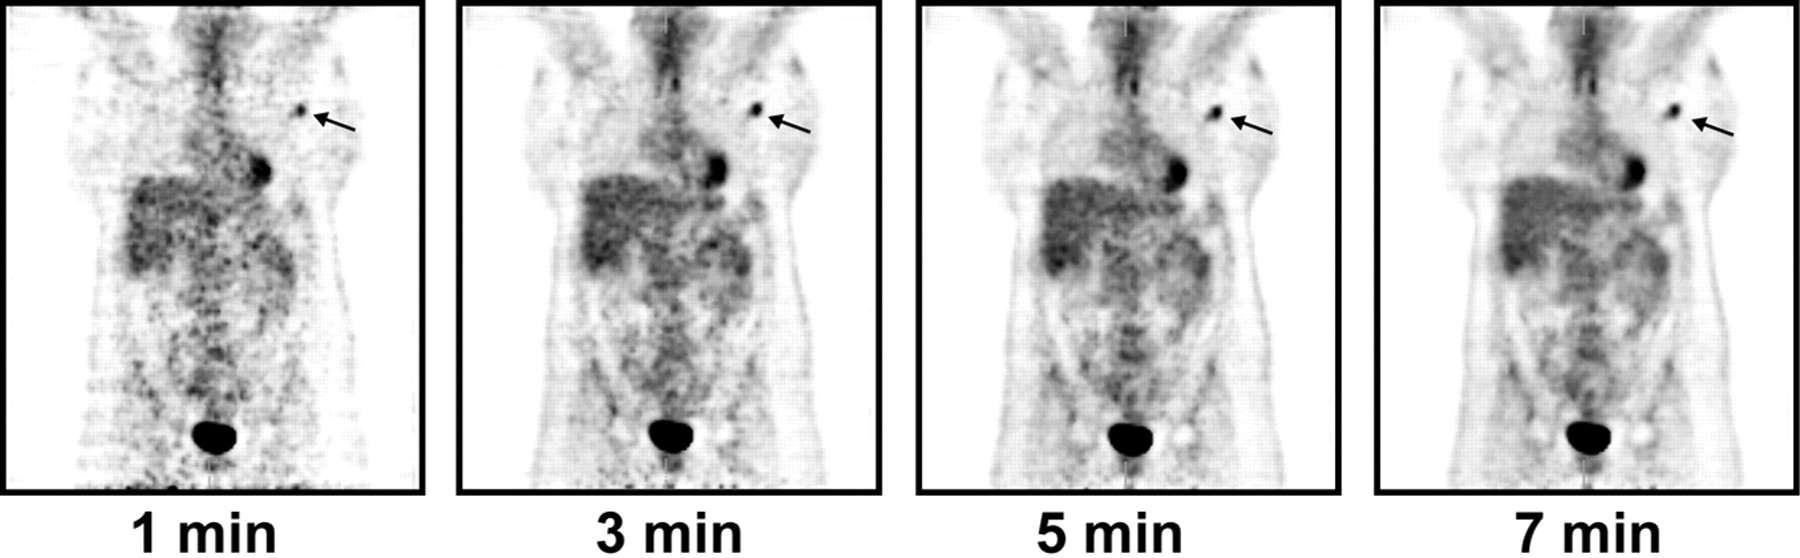
Images of 38-y-old, 114-kg (250 lb) patient with breast cancer. Small focus of increased glycolytic activity (arrows) seen on 1, 3, 5, and 7 min/bed position scans corresponded to enlarged lymph nodes on CT. Despite considerable noise on 1 and 3 min/bed position scans, lesion was identified even on these short scans.
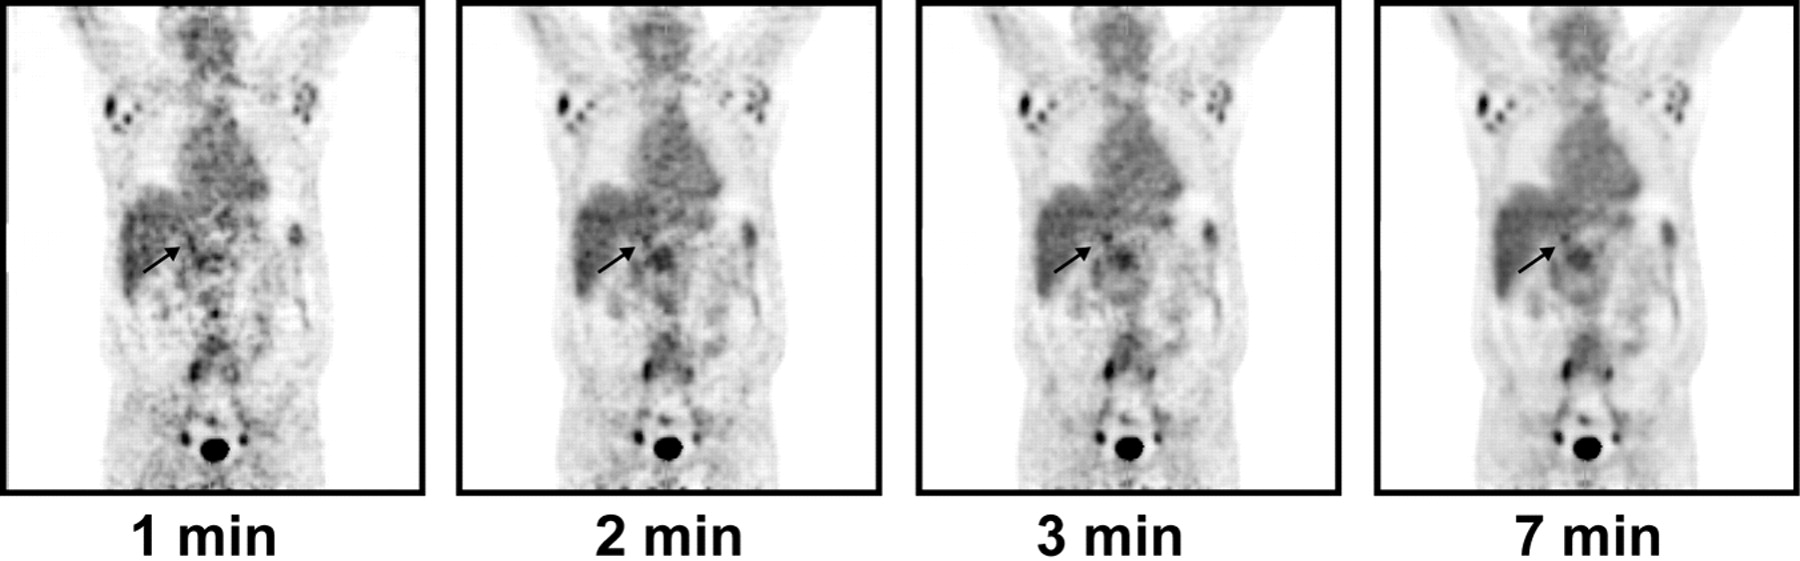
Images of 54-y-old, 93-kg (205 lb) patient with lymphoma. Small focus of increased 18F-FDG uptake (arrows) seen in right upper abdomen corresponded to 1.1-cm perihepatic lymph node. Because of substantial image noise, this lesion was missed on 1 and 2 min/bed position scans.
Missed Lesions
Missed Lesions vs. Detected Lesions
Interobserver variability in lesion detection decreased with increasing scan duration, from 36% for 1 min/bed position scans to 30% for 3 min/bed position scans and 22% for 4 min/bed position scans. Interobserver variability was lowest for 5 min/bed position scans—15%—and remained unchanged for 6 and 7 min/bed position scans (Table 3).
Interobserver Variability in Lesion Detection
Image Quality
The image quality score increased from 1.3 (poor) for 1 min/bed position scans to 2.2 (moderate) for 4 min/bed position scans and a maximum of 2.6 (moderate to good) for 7 min/bed position scans (Table 4). Significant differences were observed for 1–4 min/bed position scans (P < 0.05), but not for 5 and 6 min/bed position scans when compared with the 7 min/bed position reference standard.
Subjective and Objective Analysis of Image Quality
Image noise decreased with imaging duration, from 20.5% on 1 min/bed position scans to 13.3% on 5 min/bed positions scans to 10.9% on 7 min/bed position scans (Table 4). Differences were statistically significant for 1–3 min/bed position scans (P < 0.05) but not for 4–6 min/bed position scans when compared with the 7 min/bed position reference standard.
DISCUSSION
In the current study, we attempted to optimize LSO PET/CT protocols for obese patients. Five minute/bed position scans were sufficient to detect all lesions detected on the reference standard 7 min/bed position scans. Image quality was best on 7 min/bed position scans, but lesions were no better detected on 7 min/bed position scans than on 5 or 6 min/bed position scans.
Obesity is an increasingly important health problem in the United States, and the incidence of obesity is rising (10). Obesity affects PET image quality because photon attenuation and scatter fractions are higher in obese patients than in patients with a normal BMI. Because the scatter fraction is higher in 3D mode, resulting in higher noise levels, this problem is further accentuated in systems without septa, such as LSO PET/CT systems. We previously showed that LSO PET/CT times can be as short as 1 min/bed position in thin patients (3). Such short scans provided the same diagnostic information as 4 min/bed position scans in patients with weights of <59 kg (130 lb). That study was limited in that it included few obese patients. The current study was performed to determine the best LSO PET protocol for heavy patients, and the findings suggested that the best diagnostic results in patients weighing ≥91 kg (200 lb) are obtained from emission scans of 5 min/bed position.
As expected, image quality declined subjectively and objectively for shorter emission scans, because shorter acquisition times result in poor count statistics and increased image noise. In the current study, this resulted in reduced sensitivity for lesion detection (using the 7 min/bed position scans as the reference standard). As expected, fewer lesions were detected on shorter imaging frames. The absence of false-positive findings was surprising. However, readers had the option to qualify scans as nondiagnostic if they believed that the image noise level was too high. Six scans were classified as nondiagnostic on 1 and 2 min/bed position scans. This number declined to 1 scan on 3 min/bed position scans. If the readers had interpreted scans at a higher sensitivity level, or if the design of the study had excluded the nondiagnostic group, false-positive findings would have occurred.
Interobserver variability was significantly greater for shorter image acquisitions than for longer acquisitions. However, interobserver variability remained stable and low once the imaging duration was ≥5 min/bed position. Fourteen (24%) of 59 lesions detected on the reference standard 7 min/bed position scans were not detected on 1 min/bed position scans (Table 1). The number of undetected lesions declined to 3% on 4 min/bed position scans, and all lesions depicted on 7 min/bed position scans were also apparent on 5 and 6 min/bed position scans. However, lesions may have been missed on the 7 min/bed position scan and the true number of false-negative findings is difficult to determine. All whole-body CT images were inspected and reviewed for anatomic lesions that were not hypermetabolic on PET mages. Importantly, no such additional lesions were found.
This study had several limitations. These included the lack of a pathologic gold standard and the use of 7 min/bed position scans as the reference standard. When one is following the vendor’s recommendation for image reconstruction, the currently proposed protocol might not be ideal for other available PET/CT systems. For instance, on other systems the ordered-subsets expectation maximization algorithm with 2 subsets and 8 iterations may result in overly smooth images, thereby reducing the detectability of small lesions even on 7 min/bed position scans. This would bias the results in favor of good lesion detectability with 1 min/bed position scans.
The reconstruction parameters may not have been optimal for shorter scans. No attempt was made to reduce image noise on shorter image frames by using different filters. Thus, data might have been biased against lesion detectability on short imaging frames, and optimizing reconstruction parameters for short scans might allow further shortening of image acquisition protocols.
Additionally, the effect of lesion location on lesion detectability could not be addressed completely in this study because the majority of lesions (56%) were in chest or lung tissue, which has fewer attenuation problems than, for instance, the abdomen or pelvis. However, 32% of the lesions were in the abdomen or pelvis, and we did not find lesion location to have a specific effect on reader concordance or lesion detectability.
CONCLUSION
The findings of the current study are important for designing imaging protocols at LSO PET/CT centers. On the basis of the identical lesion detection found for 5 and 7 min/bed position scans, we have modified our PET/CT protocol and are now using 5 min/bed position scans for all patients weighing ≥91 kg (200 lb), as outlined in Table 5.
Change of Protocol
Footnotes
Received Jul. 30, 2004; revision accepted Dec. 8, 2004.
For correspondence or reprints contact: Johannes Czernin, MD, UCLA School of Medicine, Nuclear Medicine, AR 128 CHS, 10833 Le Conte Ave., Los Angeles, CA 90095-6942.
E-mail: jczernin{at}mednet.ucla.edu
In this issue


Jump to section
Related Articles
Cited By...
- 18F-NaF PET/CT of Obese Patients on a Lutetium-Yttrium Oxyorthosilicate PET/CT System: Patient Dosimetry, Optimization of Injected Activity, and Acquisition Time
- Impact of 68Ga-PSMA-11 PET/CT on Staging and Management of Prostate Cancer Patients in Various Clinical Settings: A Prospective Single-Center Study
- Total-Body 68Ga-PSMA-11 PET/CT for Bone Metastasis Detection in Prostate Cancer Patients: Potential Impact on Bone Scan Guidelines
- 18F-FDG PET/CT and PET/MRI Perform Equally Well in Cancer: Evidence from Studies on More Than 2,300 Patients
- Influence of Statistical Fluctuation on Reproducibility and Accuracy of SUVmax and SUVpeak: A Phantom Study
- 18F-FDG-PET/CT Imaging as an Early Survival Predictor in Patients with Primary High-Grade Soft Tissue Sarcomas Undergoing Neoadjuvant Therapy
- 18F-FDG PET/CT for Monitoring Treatment Responses to the Epidermal Growth Factor Receptor Inhibitor Erlotinib
- Evaluation of Optimal Acquisition Duration or Injected Activity for Pediatric 18F-FDG PET/CT
- Patient Weight-Based Acquisition Protocols to Optimize18F-FDG PET/CT Image Quality
- Impact of Obesity on Nuclear Medicine Imaging
- Variations in Clinical PET/CT Operations: Results of an International Survey of Active PET/CT Users
- Obesity and Medical Imaging Challenges
- Radiation Dosimetry of 89Zr-Labeled Chimeric Monoclonal Antibody U36 as Used for Immuno-PET in Head and Neck Cancer Patients
- Comparison of Imaging Protocols for 18F-FDG PET/CT in Overweight Patients: Optimizing Scan Duration Versus Administered Dose
- FDG-PET/CT Imaging Predicts Histopathologic Treatment Responses after the Initial Cycle of Neoadjuvant Chemotherapy in High-Grade Soft-Tissue Sarcomas
- 18F-FDOPA PET and PET/CT Accurately Localize Pheochromocytomas
- Combined Assessment of Metabolic and Volumetric Changes for Assessment of Tumor Response in Patients with Soft-Tissue Sarcomas
- Quantitative Assessment of the Influence of Location, Internal Temperature, Idle Time, and Normalization on the Sensitivity of a Mobile PET/CT Scanner
- Deep-Inspiration Breath-Hold PET/CT of Lung Cancer: Maximum Standardized Uptake Value Analysis of 108 Patients
- Reduction of Glucose Metabolic Activity Is More Accurate than Change in Size at Predicting Histopathologic Response to Neoadjuvant Therapy in High-Grade Soft-Tissue Sarcomas
- Sensitivity and Daily Quality Control of a Mobile PET/CT Scanner Operating in 3-Dimensional Mode
- Prevalence, Challenges, and Solutions for 18F-FDG PET Studies of Obese Patients: A Technologist's Perspective
- Standard PET/CT of the Chest During Shallow Breathing Is Inadequate for Comprehensive Staging of Lung Cancer
- Optimizing Injected Dose in Clinical PET by Accurately Modeling the Counting-Rate Response Functions Specific to Individual Patient Scans