


Abstract
Frontotemporal dementia (FTD) is a common cause of presenile dementia. The aim of the current study was 2-fold: (a) to delineate the brain regions with reduction of glucose metabolism, and (b) to investigate the hemispheric asymmetry of glucose metabolism in FTD using 18F-FDG PET. Methods: We compared the regional metabolic patterns on 18F-FDG PET images obtained from 29 patients with FTD and 11 healthy subjects using a voxel-wise analysis (statistical parametric mapping [SPM]). The hemispheric asymmetry of glucose metabolism was computed based on 2 different measures: one (AIROI) by counting the 18F-FDG activity of each hemisphere on the normalized and spatially smoothed PET images and the other (AISPM) by counting the number of voxels with significant hypometabolism based on SPM results. Results: Significant hypometabolism was identified in extensive prefrontal areas, cingulate gyri, anterior temporal regions, and the left inferior parietal lobule. Hypometabolism was also found in the bilateral insula and uncus, left putamen and globus pallidus, and medial thalamic structures. Frontal hypometabolism was more prominent in the left hemisphere than in the right. Twenty-six (90%) of the 29 patients with FTD had AIROI values indicating significant lateralization of glucose metabolism; 18 patients had hypometabolism more severe on the left than right side, and only 8 patients had the opposite pattern. Results from AISPM showed similar patterns. Conclusion: The voxel-wise analysis of 18F-FDG PET images of patients with FTD revealed hypometabolism in extensive cortical regions, such as frontal and anterior temporal areas, cingulate gyri, uncus, and insula and subcortical areas, including basal ganglia (putamen and globus pallidus) and medial thalamic regions. The hemispheric asymmetry of hypometabolism (more frequently lateralized to the left) was common in patients with FTD, which may be another metabolic feature that helps to differentiate FTD from Alzheimer’s disease or other causes of dementia.
- frontotemporal dementia
- glucose metabolism
- 18F-FDG PET
- statistical parametric mapping
- hemispheric asymmetry
Frontotemporal lobar degeneration is one of the most common forms of cortical dementia, accounting for approximately 20% of presenile dementia. Frontotemporal lobar degeneration is clinically and pathologically heterogeneous and thus has been poorly recognized. The Lund and Manchester Group (1,2) proposed clinical diagnostic criteria to help clinicians better identify patients with frontotemporal lobar degeneration. They divided frontotemporal lobar degeneration into 3 prototypical syndromes: frontotemporal dementia (FTD), progressive nonfluent aphasia, and semantic dementia.
Patients with progressive nonfluent aphasia and semantic dementia usually experience language disturbances and thus are easily distinguished from individuals with other dementing disorders. However, patients with FTD, the most common form of frontotemporal lobar degeneration, may experience forgetfulness or a variety of behavioral abnormalities and are often misdiagnosed as having Alzheimer’s disease, vascular dementia, or psychiatric illnesses. Thus, an accurate differentiation of FTD from other dementing disorders should be important from the diagnostic and therapeutic points of view. Accurate diagnoses of dementias have become more important since the advent of new drugs, such as cholinesterase inhibitors, for treatment of Alzheimer’s disease.
The degeneration of the frontal and anterior parts of the temporal areas in FTD results in atrophy seen on brain CT or MR imaging and hypoperfusion or hypometabolism seen on SPECT or PET (3,4). Most previous SPECT and PET studies that investigated functional changes in the brain regions of patients with FTD used the region-of-interest (ROI) method. The ROI method, however, selects only those brain regions that are expected to have functional changes, whereas recently developed voxel-wise analysis, such as the statistical parametric mapping (SPM) method, can detect any brain region with functional changes, without an a priori hypothesis.
The aim of the current study was 2-fold: first, to delineate the brain regions with reduction of glucose metabolism in FTD using SPM analysis of 18F-FDG PET images; and second, to investigate the hemispheric asymmetry of glucose metabolism in FTD, which has not been systematically studied.
MATERIALS AND METHODS
Subjects
Between January 1995 and May 2002, 64 patients were diagnosed with frontotemporal lobar degeneration at the hospital where this study was conducted, according to the consensus clinical diagnostic criteria (2). This group included 40 patients with FTD, 9 with FTD plus motor neuron disease, 7 with progressive nonfluent aphasia, and 8 with semantic dementia. Of the 40 patients with FTD, 29 patients who had undergone 18F-FDG PET scans were included in this study. All patients fulfilled the consensus clinical diagnostic criteria for FTD (2). For comparison with FTD patients, PET scans were also obtained in 11 age- and sex-matched healthy individuals. These healthy controls had no history of neurologic or psychiatric illnesses and no specific abnormalities on neurologic and neuropsychologic examinations. Characteristics of patient and control groups are presented in Table 1. Patients’ onset symptoms and main symptoms at the initial visit are described in Table 2. All patients showed early loss of personal and social awareness, executive dysfunctions, abulic features, and stereotyped or compulsive behaviors.
Characteristics of the Patient and Control Groups
Clinical Characteristics of Patients
PET Imaging
PET scans of 30 min were acquired starting 40 min after intravenous injection of 4.8 MBq/kg 18F-FDG using an Advance PET scanner (GE Healthcare). In-plane and axial resolution of the scanner were 4.9 and 3.9 mm full width at half maximum (FWHM), respectively. Subjects fasted for at least 4 h before PET imaging. PET images were reconstructed using a Hanning filter (cutoff frequency = 4.5 mm) and displayed in a 128 × 128 matrix (pixel size = 1.95 × 1.95 mm, with a slice thickness of 4.25 mm). Attenuation correction was performed with a uniform attenuation coefficient (μ = 0.096 cm−1).
PET Data Analysis
SPM Analysis of Regional Glucose Metabolism.
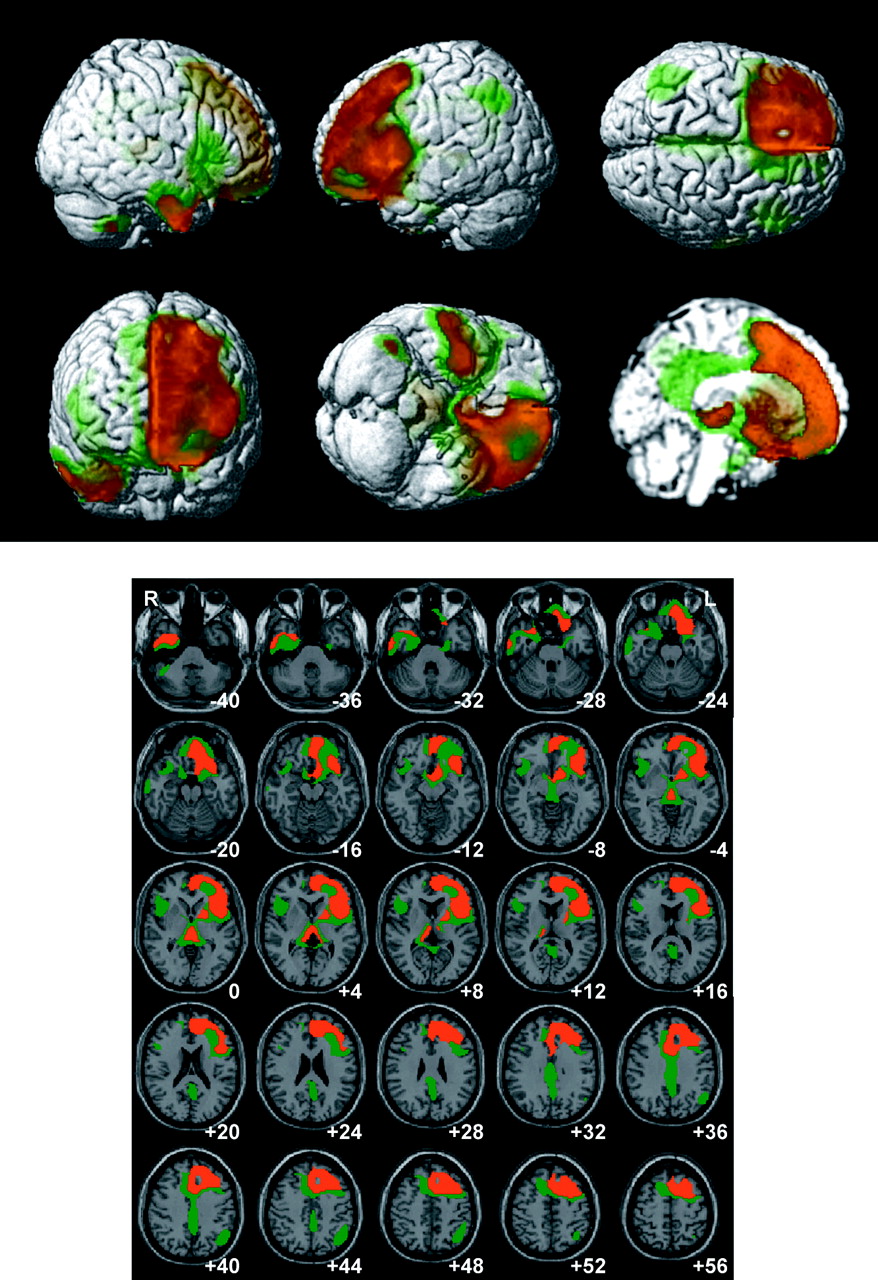
Before statistical analysis, using SPM99 (Wellcome Department of Cognitive Neurology, Institute of Neurology, University College London) implanted in a Matlab 5.3 environment (MathWorks, Inc.), all images were preprocessed for spatial normalization into the Montreal Neurological Institute (MNI) template to remove intersubject anatomic variability, then smoothed with a FWHM 16-mm Gaussian kernel to increase the signal-to-noise ratio and to account for subtle variations in anatomic structures (5). The count of each voxel was normalized to the average count of cerebellum using a customized program, because cerebellum is known to be one of the least affected regions in FTD. Images of patients with FTD were compared with those of healthy controls in a voxel-wise manner using SPM99 both for between-group analysis and for individual-to-group analysis (P < 0.001, uncorrected; extent threshold, k = 200). For the group analysis, a 2-sample t test was used to detect differences between the FTD and healthy control groups. For the individual analyses, a 2-sample t test was performed for each patient, so that each patient as 1 group (n = 1) was compared with the same healthy control group (n = 11). For the group analysis, 2 different statistical criteria were used: P < 0.01 (T = 5.18), corrected for multiple comparison (extent threshold, k = 50); and P < 0.0005 (T = 6.29), corrected (extent threshold, k = 50). Even if the former statistical criterion (P < 0.01, corrected) was stringent enough for imaging research, areas with significant group differences in the current study were far too extensive to identify and localize the peak coordinates for each brain region. Therefore, we applied an additional criterion that was more stringent (P < 0.0005, corrected). For display, green was used for the lower threshold (T = 5.18) and red for the higher threshold (T = 6.29) (Fig. 1). However, the table of local maxima (Table 3) was composed based on the lower threshold.

Hypometabolic regions in patients with FTD compared with healthy controls. These regions are displayed on surface-rendered (top) and transaxial (bottom) images. Hypometabolic regions were displayed according to 2 different thresholds in green (P < 0.01; corrected, T = 5.18) and red (P < 0.0005; corrected, T = 6.29). Number in each transaxial brain image indicates distance (mm) from anterior commisure–posterior commisure plane.
Hypometabolic Regions in Patients with FTD
For visualization of the t-score statistics (SPM{t} map), significant voxels were projected onto the 3-dimensional rendered brain or a standard high-resolution MR image template provided by SPM99, thus allowing anatomic identification. The MNI coordinates of the local maximum of each cluster were converted into Talairach coordinates (6) and listed in Table 3 in bold, along with T-values and cluster sizes. For a cluster that contained extensive areas, the coordinates of its local submaxima were also listed in the table in a regular font.
Analysis of Hemispheric Asymmetry of Glucose Metabolism.
To evaluate the hemispheric asymmetry of glucose metabolism in FTD, we obtained asymmetry indices (AIs) of metabolism between the hemispheres using ROI and SPM analyses of 18F-FDG PET images in each patient with FTD. From the preprocessed PET images, including cerebellar normalization (mean 18F-FDG activity of cerebellum = 50) as described previously, the average 18F-FDG activity of each hemisphere was counted using the ROI method and an AI between the hemispheres was computed using the following equation: AIROI = (average 18F-FDG activity of left hemisphere − average 18F-FDG activity of right hemisphere)/(average 18F-FDG activity of left hemisphere + average 18F-FDG activity of right hemisphere) × 200. The brain-mask image given in SPM software was divided into the left and right hemispheres according to the x-coordinate of each voxel to define the ROIs. On an SPM{t} map of each patient, the number of voxels with significant (P < 0.001, uncorrected) hypometabolism compared with the healthy control group was counted in each hemisphere, and an AI between the hemispheres was calculated using the following equation: AISPM = (number of hypometabolic voxels in right hemisphere − number of hypometabolic voxels in left hemisphere)/(number of hypometabolic voxels in right hemisphere + number of hypometabolic voxels in left hemisphere) × 200. Positive AIROI and AISPM values indicate that the right hemisphere is more hypometabolic (in terms of extent and/or intensity) than the left hemisphere; negative values indicate the opposite.
Statistical Analysis
Data are expressed as mean ± SD. A difference between unpaired data was analyzed by an unpaired Student t test. Correlation between AIROI and AISPM was evaluated by calculating the Pearson linear correlation coefficient. Except for SPM analysis, P < 0.05 was considered significant.
RESULTS
Regional Glucose Metabolism on 18F-FDG PET Imaging
Figure 1 and Table 3 show the brain regions with reduced glucose metabolism in patients with FTD compared with the healthy control group. With a height threshold of P < 0.01 (corrected for multiple comparison, T = 5.18), there was significant hypometabolism in extensive prefrontal areas, including superior, middle, and inferior frontal gyri as well as orbitofrontal and medial frontal areas and the entire cingulate gyri. Metabolism was significantly reduced in the bilateral anterior/ventral temporal regions, left inferior parietal lobule, and right cerebellar tonsil. Hypometabolism was also found in the bilateral insula and uncus and subcortical structures, including left putamen and globus pallidus. There was also hypometabolism in the dorsomedial thalamus, hypothalamic region, and pulvinar. With a stringent statistical criterion (P < 0.0005; corrected, T = 6.29), hypometabolism was more prominent in the left prefrontal areas than in the right. Results of individual analyses are shown in Figure 2. Although hypometabolic areas were variable among patients, all patients showed decreased metabolism in the frontal and/or anterior temporal regions.

Hypometabolic regions in individual patients with FTD compared with the healthy control group (P < 0.001, uncorrected).
Hemispheric Asymmetry of Glucose Metabolism
Figure 3 shows the distribution of AIROI and AISPM values in patients with FTD. The absolute AIROI was significantly higher in patients with FTD (8.7 ± 4.5) than in healthy controls (2.6 ± 1.1) (P < 0.001). Hemispheric asymmetry of glucose metabolism was considered to be present if the absolute AIROI value was greater than the upper limit of the 95% confidence interval of values obtained from the control group which was more than 3.4. With this criterion, 26 (90%) of the 29 FTD patients had asymmetric metabolism (Table 2); 18 patients had hypometabolism more severe in the left hemisphere (left dominant), and 8 patients had hypometabolism more severe in the right hemisphere (right dominant). The mean (±SD) absolute AISPM value in patients with FTD was 116.9 ± 57.2. Using AISPM, 24 (83%) of the 29 FTD patients had asymmetric metabolism, in that the absolute AISPM values of these patients were larger than 50; 15 were left dominant, and 9 were right dominant. This was similar to the result from AIROI. There was a significant correlation between AIROI and AISPM (r = 0.90; P < 0.001).
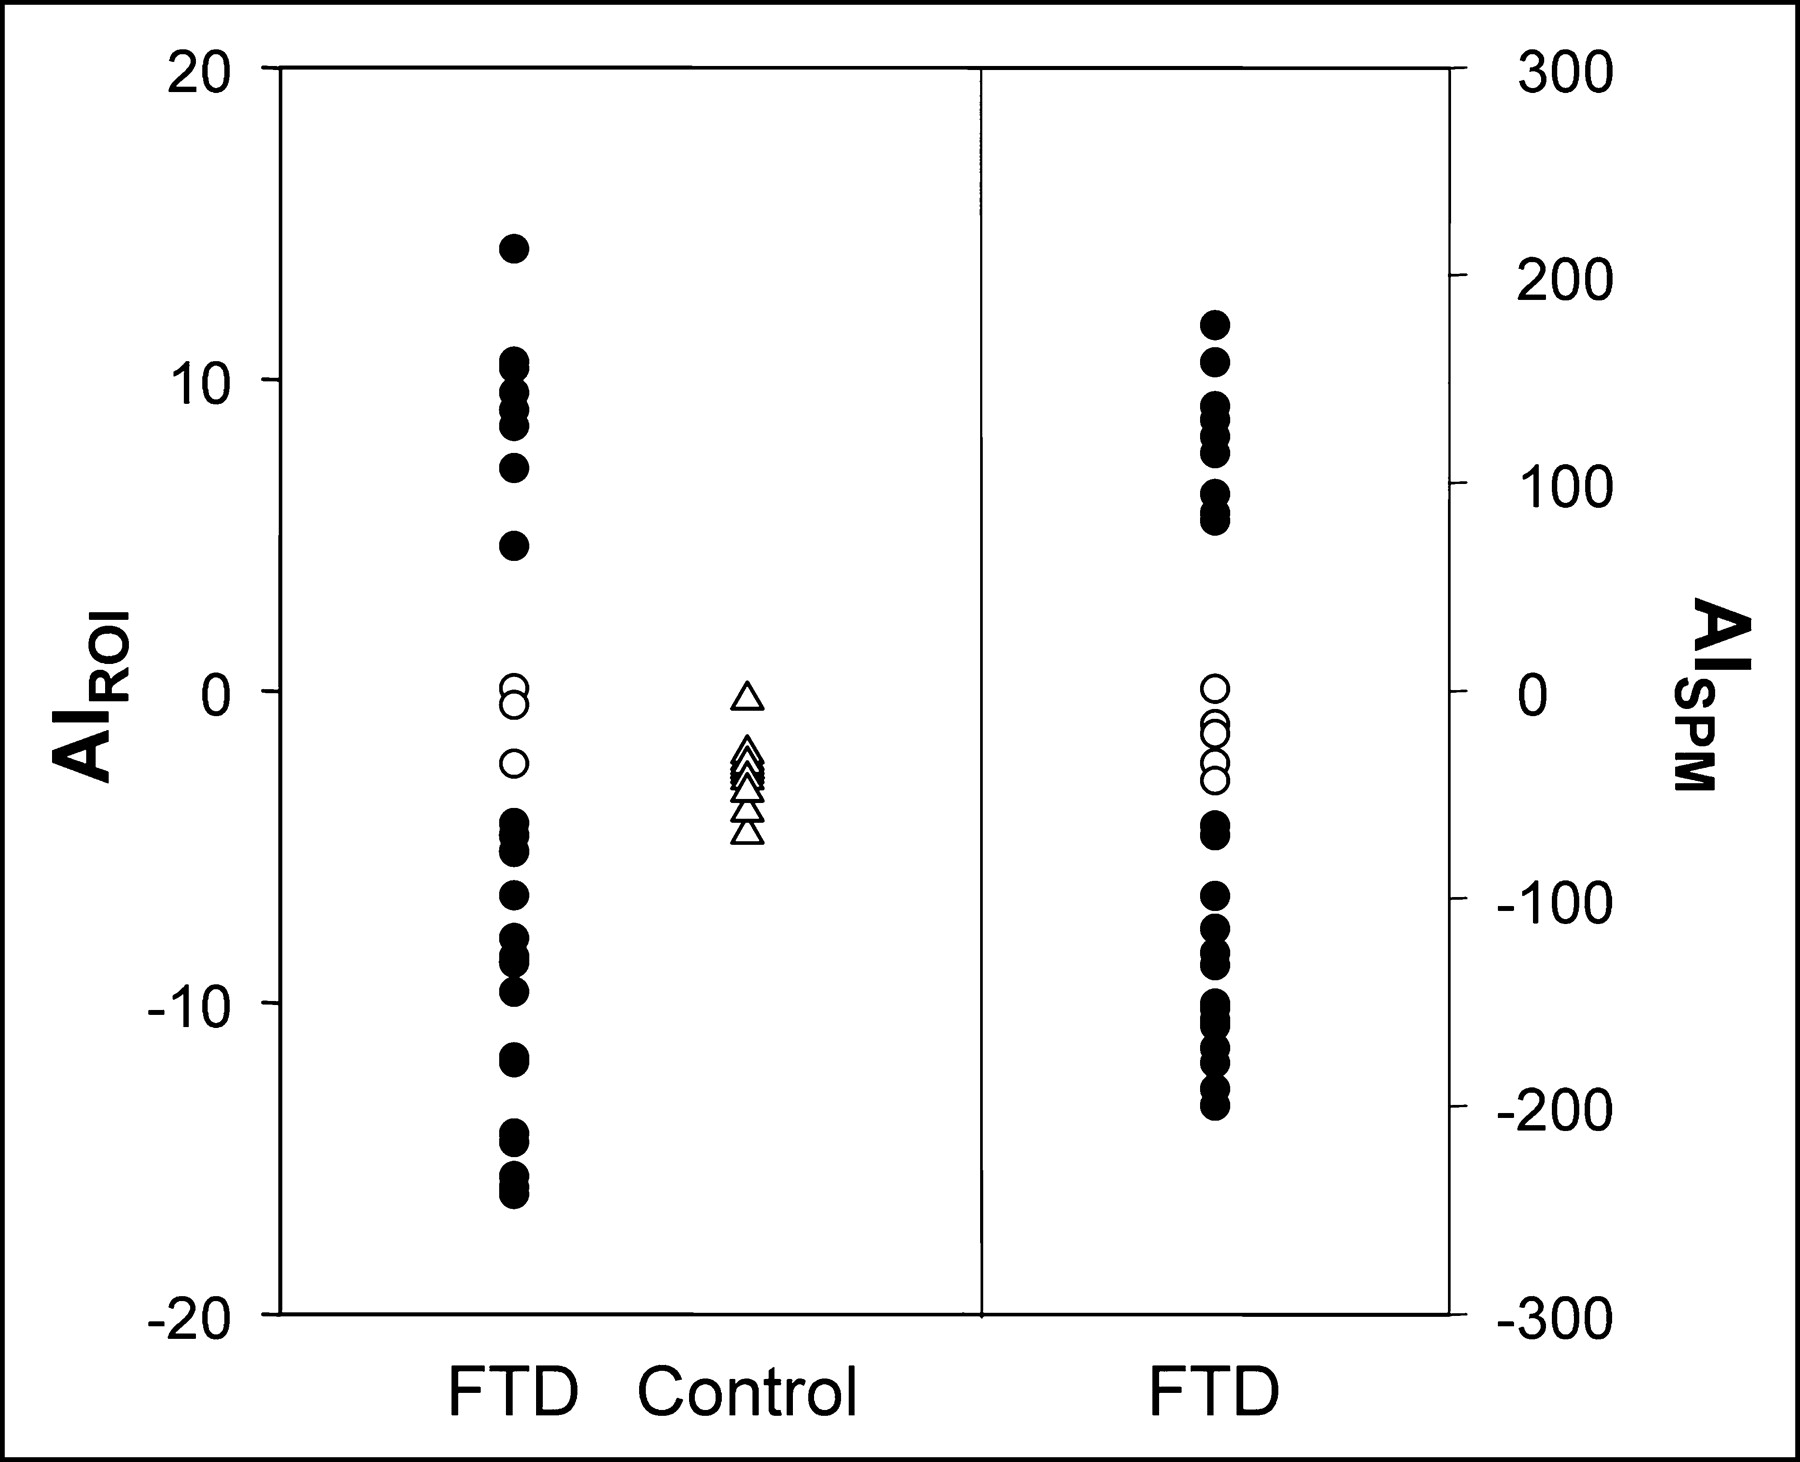
Scatter plots showing distribution of AIROI and AISPM values in patients with FTD. Positive AIROI and AISPM values indicate that right hemisphere was more hypometabolic than left hemisphere; negative values indicate the opposite. Closed circles denote significant hemispheric metabolic asymmetry.
DISCUSSION
Several 18F-FDG PET studies of FTD have been reported (4,7–11). Most of these investigated the regional brain metabolism using visual rating or ROI methods (4,7,9,10). Only one study used SPM analysis, but this research included only a small number of patients (n = 6) and these included patients with combined motor neuron disease (12). Our SPM analysis of 18F-FDG PET images of patients with FTD showed widespread areas of decreased metabolism involving bilateral prefrontal areas, including dorsolateral frontal, orbitofrontal and medial frontal areas, and anterior/ventral temporal regions, as expected. Hypometabolism was also found in the left inferior parietal lobule, bilateral insula and uncus, and subcortical structures, including left basal ganglia and bilateral thalami. These findings replicate the results of previous imaging or pathologic studies (3,4,9,11,13).
We found additional hypometabolic brain regions that have not been reported in prior studies. These areas were the insula and uncus. The insula, with its connection with cerebral cortex, basal ganglia, thalamus, and limbic structures such as amygdala and entorhinal cortex, is known to be involved in a variety of brain activities, including somatosensory, swallowing, gustatory, vestibular, cardiovascular, and language functions (14). It has also been reported that damage to the insula produces subjective feelings of anergia, underactivity, and tiredness (15). Thus, it may be possible that insular lesions in our patients may partly contribute to such symptoms as lack of energy and reduced speech and activities. Also, the insula is one of the brain structures involved in a network recruited during memory testing. Its activity level may show a compensatory change with aging in healthy old individuals (16). Failure of this compensatory change may be associated with cognitive impairment in patients with FTD. No functional imaging studies have reported insular involvement in FTD. Rosen et al. (17) reported an atrophy of the insula in FTD using voxel-based morphometry of MR images. They suggested the possibility of a role for the insula in social behavior. Hypometabolism in the uncus may be associated with a dysfunction in the amygdala. The amygdala has strong links with emotional processing. Removal of the amygdala and surrounding structures resulted in profound social disturbances in primates (18). Also, the uncus is a part of brain regions reported to be involved in emotional expression and visual processing of emotions (19). Metabolic impairment of the uncus as revealed in this study may be associated with disturbances in emotional processing and social behavior in patients with FTD.
It has been suggested that asymmetric hemispheric degeneration is common in patients with FTD (11,20–22). However, no systematic analysis has been performed. Furthermore, those studies included patients with progressive nonfluent aphasia and semantic dementia, which are known to preferentially affect the left hemisphere. We evaluated the hemispheric asymmetry of metabolism only in patients with FTD. We found that hemispheric metabolic asymmetry was common (90%) and intense in FTD, even after patients with progressive nonfluent aphasia and semantic dementia were excluded. Thus, it can be suggested that FTD is a disorder that causes an asymmetric degeneration of cerebral hemispheres. According to our definition, 29 patients with FTD recruited in this study were classified into left-dominant (hypometabolism more severe in the left hemisphere; n = 18), right-dominant (n = 8), or bilateral groups (n = 3). The clinical significance of the metabolic asymmetry is unknown. The right-dominant group appeared to be heterogeneous in clinical manifestations. On the other hand, patients who presented with naming difficulty (patients 1, 3, 23, and 26) or had naming difficulty at initial examination (patient 15) all belonged to the left-dominant group. This correlation does not seem to be specific, however, because a large portion of the left-dominant group (13/18) did not have such language disturbance–predominant profiles. The reason for the overrepresentation of the left-dominant group remains speculative. One possible explanation is that FTD may preferentially affect the left hemisphere. A pathology study demonstrated greater left- than right-sided atrophic changes in most cases of FTD (13). Alternatively, this may be caused by a sampling bias. Left-dominant patients can show language disturbances even in early stages. Thus, it is more likely that these patients are brought to neurology clinics. On the other hand, right-dominant patients may present predominantly with behavioral or psychiatric abnormalities, and so are first seen at psychiatric clinics and potentially are misdiagnosed as having psychiatric illnesses.
A potential limitation of this study is that brain PET images were corrected for attenuation using a calculated instead of a measured method. In our previous study, however, there was a strong linear correlation (r = 0.99) between regional brain counts on 18F-FDG PET images corrected for attenuation using calculated and measured methods (23). In the present study, before the performance of SPM analysis, brain activity values were normalized to average cerebellar activity (i.e., cerebellar normalization) instead of average whole brain activity (i.e., global normalization), because cerebellum is known to be one of the least affected regions in FTD. In patients with FTD as well as Alzheimer’s disease, average whole brain activity may be abnormally low, resulting in a relatively high value for certain voxels relative to whole brain activity. This would compromise test sensitivity and might even lead to results indicating that certain areas of the brain were showing higher activity in those patients than in controls (24). In this study, partial-volume correction of PET data was not performed. To our knowledge, systematic investigation of the influence of brain atrophy on 18F-FDG PET findings in patients with FTD has not been reported. However, there are consistent reports on the persistence of hypometabolism after partial-volume correction in neurodegenerative diseases and in healthy aging (25–27). Nevertheless, studies are needed to investigate to what extent the partial-volume effect as a result of brain atrophy influences 18F-FDG PET findings in FTD.
CONCLUSION
SPM analysis of 18F-FDG PET images of patients with FTD showed decreased metabolism in the frontal and anterior temporal areas, cingulate gyri, uncus, insula, and subcortical areas, including basal ganglia (putamen and globus pallidus) and medial thalamic regions. We found additional hypometabolic brain regions that have not been reported in prior studies. These areas were the insula and uncus, supporting previous neuropathologic and neuropsychologic findings in FTD. Hemispheric asymmetry of hypometabolism (more frequently lateralized to the left) was common in patients with FTD, which can be another metabolic feature to help differentiate FTD from Alzheimer’s disease or other causes of dementia.
Acknowledgments
This study was supported by research grants from the Brain Research Center of the 21st Century Frontier Research Program funded by the Ministry of Science and Technology of the Republic of Korea (M103KV010016-03K2201-01630) and the Biomedical Brain Research Center, Ministry of Health and Welfare, Republic of Korea (01-PJ8-PG6-01NE01-0003).
Footnotes
Received June 11, 2004; revision accepted Sep. 13, 2004.
For correspondence or reprints contact: Sang Eun Kim, MD, PhD, Department of Nuclear Medicine, Seoul National University Bundang Hospital, 300 Gumi-dong, Bundang-gu, Seongnam-si, Gyeonggi-do, 463-707, Korea.
E-mail: kse{at}snu.ac.kr
REFERENCES
In this issue


Jump to section
Related Articles
Cited By...
- Unraveling Shared Pathways: A Comprehensive Systematic Review of Common Fiber Tracts in Amyotrophic Lateral Sclerosis and Frontotemporal Dementia using Diffusion Tensor Imaging
- 18F-FDG PET Imaging in Neurodegenerative Dementing Disorders: Insights into Subtype Classification, Emerging Disease Categories, and Mixed Dementia with Copathologies
- Clinical and Technical Considerations for Brain PET Imaging for Dementia
- Systematic Comparison of the Performance of Integrated Whole-Body PET/MR Imaging to Conventional PET/CT for 18F-FDG Brain Imaging in Patients Examined for Suspected Dementia
- Differentiation of frontotemporal dementia from dementia with Lewy bodies using FP-CIT SPECT
- Putaminal Volume in Frontotemporal Lobar Degeneration and Alzheimer Disease: Differential Volumes in Dementia Subtypes and Controls
- Sensitivity of current criteria for the diagnosis of behavioral variant frontotemporal dementia
- Multicenter Standardized 18F-FDG PET Diagnosis of Mild Cognitive Impairment, Alzheimer's Disease, and Other Dementias
- Role of Neuroimaging in Alzheimer's Disease, with Emphasis on Brain Perfusion SPECT
- 11C-PIB PET imaging in Alzheimer disease and frontotemporal lobar degeneration
- Hypoperfusion in frontotemporal dementia and Alzheimer disease by arterial spin labeling MRI.