


Abstract
In tumors the process of apoptosis occurs over an interval of time after chemotherapy. To determine the best timing for detecting apoptosis in vivo with 99mTc-annexin V after chemotherapy, we examined the changes in 99mTc-annexin V accumulation over time in comparison with those of caspase-3 and terminal deoxynucleotidyl transferase-mediated deoxyuridine triphosphate nick-end labeling (TUNEL) expression level after cyclophosphamide treatment in an experimental model. Methods: Hydrazinonicotinamide (HYNIC)-annexin V was labeled with 99mTc (99mTc-annexin V). Rats were inoculated with allogenic hepatoma cells (KDH-8) into the left calf muscle. Eleven days after the inoculation, the rats were randomly divided into the group receiving a single dose of cyclophosphamide (150 mg/kg intraperitoneally) and the control group. 99mTc-Annexin V (18.5 MBq [0.5 mCi] per rat) was injected intravenously in the rats 4, 12, and 20 h after the treatment and also to the control rats (n = 5 in each group). Radioactivity in tissues was determined 6 h after 99mTc-annexin V injection. Immunostaining of caspase-3 and TUNEL were performed to detect apoptosis, and the rates of positively stained cells were calculated. Results: 99mTc-Annexin V accumulation in tumors significantly increased at 20 h (0.077 ± 0.007 [%ID/g] × kg, where %ID/g = percentage injected dose per gram) but not at 4 or 12 h (0.048 ± 0.008 and 0.052 ± 0.014 [%ID/g] × kg, respectively) after cyclophosphamide treatment. 99mTc-Annexin V accumulation in tumors and the rate of apoptotic cells determined by caspase-3 immunostaining and TUNEL were significantly higher in treated rats 20 h after cyclophosphamide treatment as compared with control rats. Conclusion: The effective detection of apoptotic tumor response with 99mTc-annexin V required 20 h after cyclophosphamide treatment in an experimental model. The present results provide an important basis for determining the best timing of annexin V imaging after the start of chemotherapy in a clinical setting.
Apoptosis plays an important role in both normal physiology and many disease processes (1–5). One of the earliest events in apoptosis is the externalization of phosphatidylserine (PS), a membrane phospholipid normally restricted to the inner leaflet of the lipid bilayer (6). Annexin V, a human protein with a high affinity for membrane-bound PS (6–11), has been labeled with fluorescent markers for the in vitro detection of apoptotic cells (10,11) and with radioactive agents, such as 99mTc, for in vivo apoptosis detection (12–16).
In tumor tissue, successful chemotherapy or radiotherapy induces apoptosis of neoplastic cells as a response to the therapy (13,17–19). Cyclophosphamide, a kind of alkylating agent, is a broad-spectrum cytotoxic agent that induces an apoptotic reaction to proliferating cells, including hepatoma (12,20). Previous studies demonstrated that radiolabeled annexin imaging can detect apoptosis in vivo in experimental models (4,12–14,21–26) of many kinds of disease and therapy. We previously reported that 99mTc-annexin V uptake in tumors significantly increased after a single dose of cyclophosphamide, and the increase was concordant with the number of terminal deoxynucleotidyl transferase-mediated deoxyuridine triphosphate nick-end labeling (TUNEL)-positive cells in tumors (20)—for instance, head and neck cancers, lung cancers, and malignant lymphomas (27–29). The current series of experiments were performed to determine the relationship of PS expression to the time after initial treatment to define the best timing for imaging with 99mTc-annexin V after the initiation of chemotherapy (27). Accordingly, we examined the changes in 99mTc-annexin V accumulation over time in comparison with those of caspase-3 and TUNEL expression level after cyclophosphamide treatment in an experimental model.
MATERIALS AND METHODS
Preparation of Animal Models
All procedures involving animals were performed in accordance with institutional guidelines (Guide for the Care and Use of Laboratory Animals of Hokkaido University). Male Wistar King Aptekman/Hok (WKA/H) rats (supplied by the Experimental Animal Institute, Graduate School of Medicine, Hokkaido University, Sapporo) were inoculated with a suspension of KDH-8 rat hepatoma cells (1 × 10⁶ cells per rat) into the left calf muscle (20,30). Eleven days after the intramuscular injection of KDH-8 cells, rats weighting 209–287 g were randomly divided into the groups receiving a single dose of cyclophosphamide (150 mg/kg, intraperitoneally) (treated group, n = 15) and the control group (n = 5). At the time of study, the tumors were approximately 14 mm in average diameter.
99mTc-Annexin V Uptake in Tumor and Biodistribution
Human annexin V was produced by expression in Escherichia coli as previously described (9,10,13,16,31–33). Annexin V was labeled with 99mTc after derivatization with hydrazinonicotinamide (HYNIC) (99mTc-annexin V; specific activity, 3.0 MBq/μg protein). HYNIC, a nicotinic acid analog, can make bridging between a target protein and 99mTc (13,16). 99mTc-Annexin V (3.8 μg protein per rat) was injected intravenously 4, 12, and 20 h after treatment (n = 5 at each time point). The group division was performed on the basis of our previous result and the pharmacokinetic character of cyclophosphamide (34). The animals were under light ether anesthesia at the time of injection. Six hours after 99mTc-annexin V injection, the animals were sacrificed and the tumor, blood, and other tissues were excised. The tissue samples were weighed and the radioactivity was determined with a well-type scintillation counter (1480 WizardTM3″; Wallac Co.). Tumor samples were divided into 3 parts. Then, using aliquots of the tumor tissues, formalin-fixed paraffin-embedded specimens were prepared for subsequent histologic studies. The accumulation of 99mTc-annexin V in the tissues was expressed as the percentage injected dose per gram of tissue after normalization to the animal’s weight ([%ID/g] × kg). The tumor-to-muscle ratio (T/M ratio) and the tumor-to-blood ratio (T/B ratio) were calculated from the (%ID/g) × kg value in each tissue (20,30).
Detection of Apoptosis
Apoptotic cells were determined by hematoxylin–eosin staining, by direct immunoperoxidase detection of digoxigenin-labeled 3′ DNA strand breaks by use of TUNEL, and by immunostaining of caspase-3. The formalin-fixed paraffin-embedded tissues were sectioned at 3-μm thickness. TUNEL was performed according to a standard procedure using a commercially available kit (Apoptosis In Situ Detection Kit; Wako Pure Chemical Industries, Ltd.). Caspase-3 immunostaining was performed using antihuman/mouse caspase-3 active antibody (Genzyme/Techne). TUNEL-positively stained cells were counted in 10 randomly selected high-power (×200) fields with the observer unaware of the treatment, to avoid experimental bias (20,30). The rate of positively stained cells was determined by calculating the average percentage.
Statistical Analysis
All values are expressed as mean ± SD. Statistical analyses were performed using the Kruskal–Wallis test to detect the significance of difference among groups by time and the unpaired Student t test to evaluate the significance of differences in values between the control and treated animals (20).
RESULTS
The tissue distribution of radioactivity after chemotherapy is summarized in Table 1. The accumulations of 99mTc-annexin V in tumor tissue 4, 12, and 20 h after cyclophosphamide treatment were 0.048 ± 0.008, 0.052 ± 0.014, and 0.077 ± 0.007 (%ID/g) × kg, respectively. The accumulation of 99mTc-annexin V in tumor in the treated group 20 h after treatment was significantly higher than that in the control group (0.050 ± 0.010 [%ID/g] × kg, P < 0.05). The T/B ratios of 99mTc-annexin V were 1.197 ± 0.288, 1.281 ± 0.312, and 2.052 ± 0.164 at 4, 12, and 20 h after treatment compared with the control value of 1.306 ± 0.217. The T/M ratios were 5.908 ± 0.839, 5.873 ± 2.692, 5.733 ± 1.690, and 7.528 ± 0.586 in the control group at 4, 12, and 20 h respectively, after chemotherapy. The T/B and T/M ratios in the treated group 20 h after chemotherapy were significantly higher than those in the control group (P < 0.05). The changes over time were statistically significant for all ratios. The kidneys showed the highest radioactivity at all time points, followed (in decreasing order) by the spleen, bone marrow, liver, thymus, blood, and muscle. Radioactivity in the spleen, bone marrow, and thymus was significantly higher in the treated group than that in the control group, but radioactivity in the liver, blood, and muscle showed no definite change after chemotherapy. The weight of tumor was not affected statistically by cyclophosphamide treatment, but that of the spleen and thymus significantly decreased with time after chemotherapy (Table 2).
Biodistribution of 99mTc-Annexin V
Weight of Organs
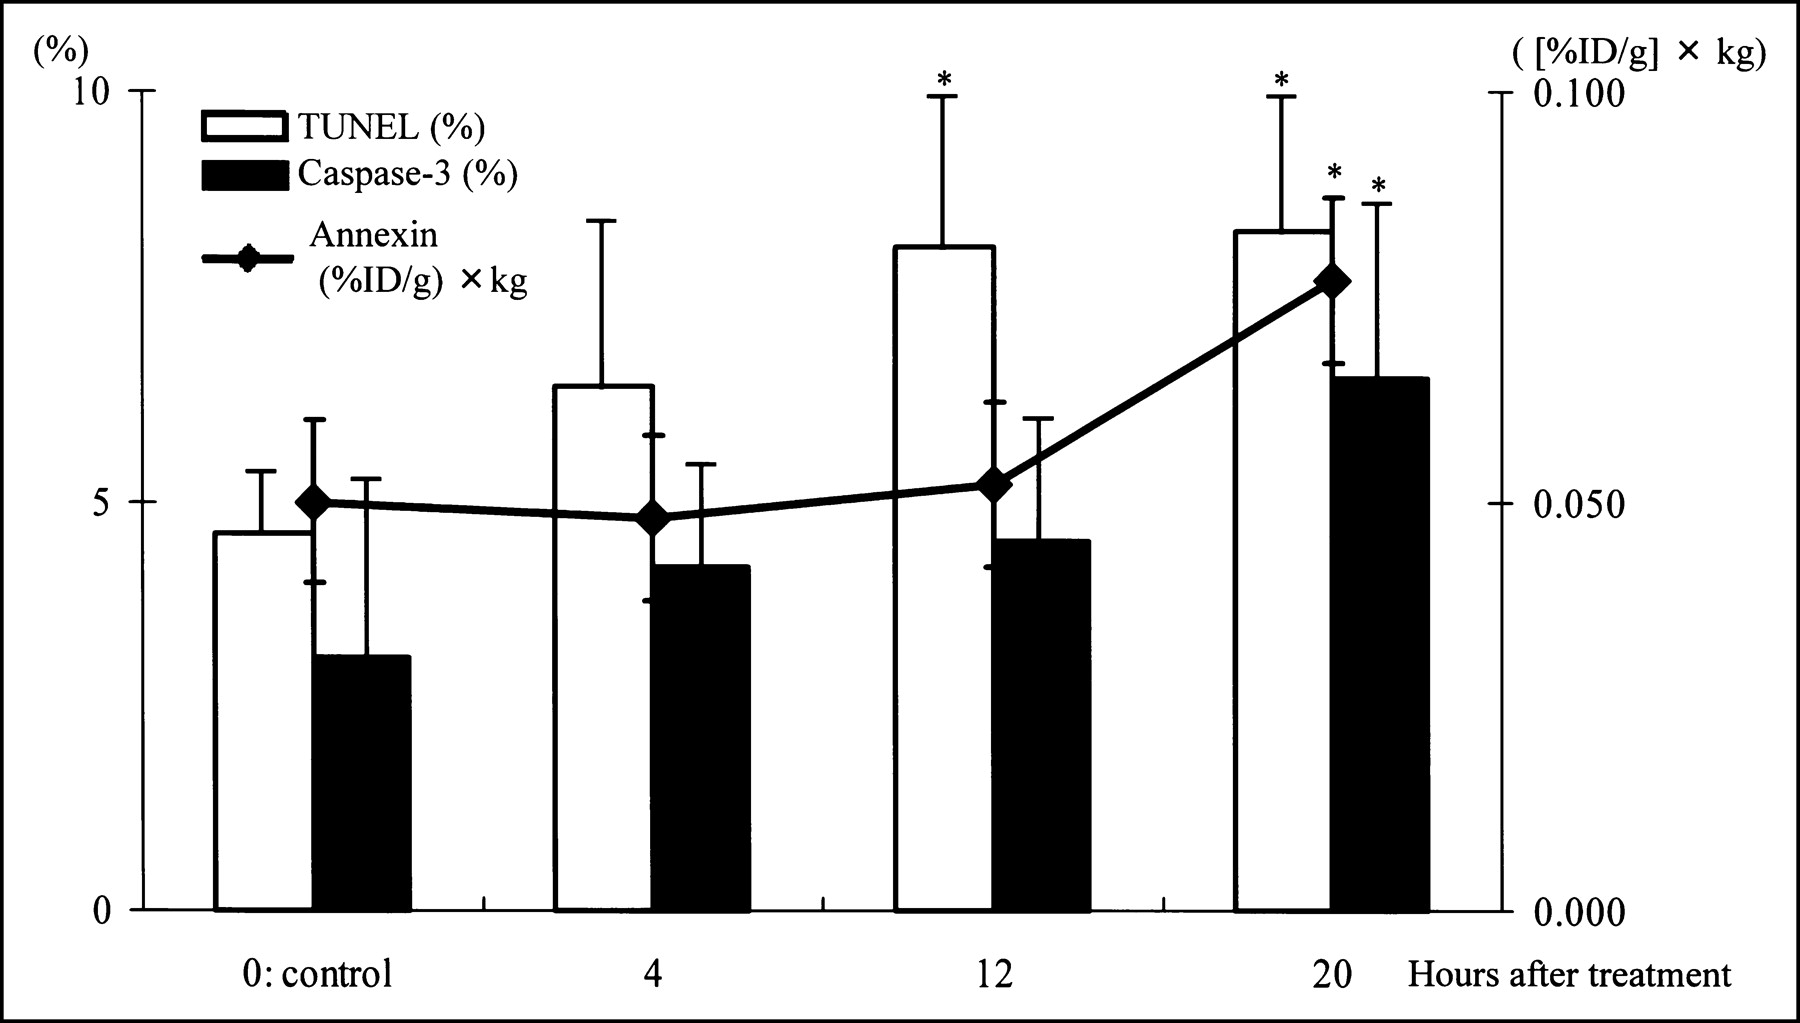
The rates of TUNEL-positively stained cells increased during the interval of observation. In control, 4, 12, and 20 h after chemotherapy, TUNEL-positive cells were 4.6% ± 0.7%, 6.4% ± 2.2%, 8.1% ± 1.8%, and 8.3% ± 1.6%, respectively (Fig. 1).

Radioactivity and rates of positively stained cells. *P < 0.05 compared with control group.
The rates of caspase-3-positively stained cells in the control, 4, 12, and 20 h after chemotherapy were 3.1% ± 2.1%, 4.2% ± 1.3%, 4.5% ± 1.4%, and 6.5% ± 2.3%, respectively. The rate at 20 h was significantly higher than that in the control group (Fig. 1).
DISCUSSION
The accumulation of 99mTc-annexin V in KDH-8 tumor tissue significantly increased at 20 h but not at 4 or 12 h after a single dose of cyclophosphamide. The T/B and T/M ratios also showed the same trend. The increase in the rate of tracer uptake was consistent with the rate of apoptotic cells determined by TUNEL and caspase-3 immunostaining before tumor regression occurred. It is also important to note that the increase in both the rate of uptake and the ratio of 99mTc-annexin V occurred well before tumor regression. Thus, the detection of apoptotic tumor response required 20 h after a single dose of cyclophosphamide in this experimental model. The near doubling of 99mTc-annexin V uptake in the tumor, T/B, and T/M ratios parallels the near doubling of the numbers of both TUNEL- and caspase-3-positively stained cells. This suggests that the in vivo imaging technique can provide a good reflection of the onset of apoptosis.
One of the earliest events in apoptosis is the externalization of PS, a membrane phospholipid normally restricted to the inner leaflet of the lipid bilayer (6,27). 99mTc-Annexin V can bind to PS with a high affinity depending on the Ca2+ concentration (35). According to previous reports, there are at least 2 peaks of PS expression (27,36). The early one appears within 1 h of chemotherapy initiation, and the second appears approximately 24–72 h after the completion of treatment (27,36,37). Blankenberg observed an increase in 99mTc-annexin V level 1 h after cyclophosphamide treatment of murine lymphoma but, paradoxically, there was no loss of lymphoma cells (27). Our current results showed no significant change in both the rate of 99mTc-annexin V uptake and the numbers of TUNEL- and caspase-3-positively stained cells 4 h after a single dose of cyclophosphamide. Furthermore, there were no definite morphologic changes 4 h after chemotherapy. Our recent study was designed to detect chemotherapy-induced apoptosis at the second peak of PS expression in a clinical setting. We consider that it may be too late to detect apoptosis 4 h after the chemotherapy even when we take 4-hydroxycyclophosphamide into consideration. However, the second peak of PS expression did not appear 4 and 12 h after the chemotherapy. These results imply that detection protocols should focus on the second peak of PS exposure, since the first peak of PS expression does not always reflect tumor apoptosis.
Blankenberg et al. reported that the second peak of 99mTc-annexin V uptake is also expected to occur hours later, immediately before the loss of the bulk of tumor cells due to apoptosis. They also reported an increase in 99mTc-annexin V uptake rate in the spleen and bone marrow as early as 8 h after cyclophosphamide treatment. This increased uptake rate lasted approximately 2 d (12). Our results confirmed that the rate of 99mTc-annexin V uptake also significantly increased in the tumor tissue, bone marrow, spleen, and other chemosensitive organs such as the thymus. Although the weights of the organs such as bone marrow, thymus, and spleen significantly decreased, the weight of tumor itself did not change. This phenomenon indicated that KDH-8 tumor was less chemosensitive than the hematopoietic organs.
Cyclophosphamide is an alkylating agent, which exerts its cytotoxic effect by alkylating 7 nitrogens of guanine in tumor DNA predominantly. Methylated DNAs prevent cell proliferation. The metabolic activation to 4-hydroxycyclophosphamide is required for its cytotoxic efficacy. This metabolite prevents cells, including hepatoma, from proliferating by arresting the cell cycle at the G2 phase. Higher doses of cyclophosphamide also prevent cell proliferation at the S phase and interrupt DNA synthesis (34). However, the efficacy of cyclophosphamide against KDH-8 tumor is not necessarily clear, and further studies are required to clarify this point. In contrast, clinical and experimental trials show that the degree of cancer apoptosis initiated by chemotherapy using cyclophosphamide correlates with tumor regression and prognosis. Mochizuki et al. reported the high correlation between the rate of TUNEL-positively stained and the uptake of 99mTc-annexin V (20). Therefore, we considered 99mTc-annexin V as a noninvasively monitoring tool to predict the therapeutic outcome. Antineoplastic agents induce apoptosis because the DNA damage leads to inhibition of the antiapoptotic molecules such as Bcl-2 and to product cytokines such as interleukin 2 and tumor necrosis factor α (TNF-α) (38). These molecules activate caspase-3 and, consequently, apoptosis occurs. We observed a significant increase of the rate of caspase-3-positive cells after cyclophosphamide treatment. Additionally, apoptosis of KDH-8 cells has been reported to depend on an increase in TNF-α (39). The apoptotic mechanism in KDH-8 cells induced by cyclophosphamide seems to be similar to that of other cancer cells, although the particular molecular mechanism is unclear.
This study showed that the caspase-3 expression level is concordant with the accumulation of 99mTc-annexin V. In contrast, the increase in the rate of TUNEL-positively stained cells tended to precede the increase in annexin binding. Unfortunately, the precise mechanism underlying this phenomenon is unclear. We speculate that this may be attributed primarily to DNA scission by cyclophosphamide, an alkylating agent. The cytotoxic effect occurs mainly by alkylating DNA as described, but the drug can also cut DNA strands directly (34). This DNA damage may influence the rates of TUNEL-positively stained cells, because the fragments of DNA cut by cyclophosphamide reacted during TUNEL, preceding apoptosis. Therefore, it is important to evaluate and correlate this with the extent of necrosis histologically. In the present study, the cells were considered “positive” when the nuclei were intensely stained by TUNEL for DNA fragmentation. Necrotic cells can be excluded on the basis of cytoplasmic staining and morphologic changes (e.g., pyknosis, nuclear fragmentation, cytoplasmic swelling, and presence of apoptotic bodies). In our experimental model, the weight of tumor did not decrease and the amount of the necrotic changes was small. Consequently, we considered the influence of necrosis to be limited or negligible in our experimental model. If the DNA ladder directly fragmented by cyclophosphamide is present in the nuclei, it is difficult to exclude necrosis strictly by TUNEL evaluation. On the other hand, caspase-3 staining cannot be easily affected by necrotic tissue (40).
In the present study, the T/M ratios are rather high even in the control rats, which can be ascribed to apoptosis in the control tumor. Tumor suppressor genes (e.g., p53) induce the apoptosis of cancer cells without chemotherapy (38). Further study, including scintigraphic imaging, is warranted to clarify the time course of apoptosis induced by repetitive chemotherapy. These data suggest that in a clinical setting, it is appropriate to wait for 1 or 2 d after a single dose of chemotherapy when evaluating and imaging the apoptotic reaction using 99mTc-annexin V.
Acknowledgments
The authors are grateful to Professors Shinzo Nishi, Kazuo Miyasaka, and Toshiyuki Ohnishi of the Central Institute of Isotope Science, Hokkaido University, for supporting this work. The authors also thank Koutaro Suzuki, Hidenori Katsuura, Hidehiko Omote, and Hiroshi Arai of the Facility of Radiology, Hokkaido University Medical Hospital, for assistance.
Footnotes
Received Jan. 28, 2004; revision accepted Jul. 22, 2004.
For correspondence or reprints contact: Nagara Tamaki, MD, Department of Nuclear Medicine, Graduate School of Medicine, Hokkaido University, Kita 15 Nishi 7, Kita-ku, Sapporo 060-8638, Japan.
E-mail: natamaki{at}med.hokudai.ac.jp
REFERENCES
In this issue


Jump to section
Related Articles
Cited By...
- Looking Through the Vascular Normalization Window: Timing Antiangiogenic Treatment and Chemotherapy with 99mTc-Annexin A5
- Time Course of Paclitaxel-Induced Apoptosis in an Experimental Model of Virus-Induced Breast Cancer
- Sequential 99mTc-Hydrazinonicotinamide-Annexin V Imaging for Predicting Response to Chemotherapy
- A soluble tissue factor-annexin V chimeric protein has both procoagulant and anticoagulant properties
- Enhanced Apoptotic Reaction Correlates with Suppressed Tumor Glucose Utilization After Cytotoxic Chemotherapy: Use of 99mTc-Annexin V, 18F-FDG, and Histologic Evaluation