


Abstract
This study was undertaken to evaluate changes in relative 99mTc-hydrazinonicotinamide (HYNIC)-annexin V tumor uptake over time in patients undergoing chemotherapeutic treatment at baseline and at 5–7 h and 40–44 h after treatment initiation. Imaging results are related to clinical outcomes, as assessed with response evaluation criteria in solid tumors (RECIST). Methods: We prospectively included 20 patients (11 men and 9 women; mean age, 59.8 y; range, 22–75 y) scheduled for chemotherapy (n = 19) or bisphosphonate treatment (n = 1). Curable disease was present in 5 patients. The other patients had metastatic disease and were treated in a palliative setting. Three of the 20 enrolled patients were excluded from analysis: 1 patient ultimately refused the proposed chemotherapy treatment; because of difficulties with the labeling procedure, 1 patient did not receive a pretreatment scan; and 1 patient presented with an allergic reaction (rash and nausea) to the 99mTc-HYNIC-annexin V formulation. The remaining 17 patients underwent 3 scintigraphic scans with 99mTc-HYNIC-annexin V: before treatment and 5–7 h and 40–44 h after treatment initiation. The tumor response was evaluated with RECIST and related to observed changes in the ratios of tumor activity to background activity for the largest known lesion; values exceeding 25% the baseline value on either the 5- to 7-h scan or the 40- to 44-h scan were considered significant. Results: With the proposed sequential imaging protocol and a 25% change threshold, responders to treatment could be separated from nonresponders with a 94% accuracy (16/17 patients). Conclusion: Sequential 99mTc-HYNIC-annexin V imaging may allow for assessment of the response to chemotherapy within 3 d after treatment initiation.
Until recently, information on chemotherapy-induced cell death was obtained by repeated biopsies, which are invasive, liable to sampling errors, and dependent on the accessibility of tumor tissue. Because of these shortcomings, a dedicated in vivo cell death tracer allowing assessment of the entire tumor and whole body in a noninvasive manner is of major interest. One of the earliest events in apoptosis and other forms of cell death is the externalization of phosphatidylserine (PS), a membrane phospholipid normally restricted to the inner leaflet of the lipid bilayer, rendering PS an attractive target for overall cell death imaging (1).
99mTc-Hydrazinonicotinamide (HYNIC)-annexin V can bind to PS with a high affinity, depending on the Ca2+ concentration. Both in vitro studies and in vivo studies with animals and humans support the notions that 99mTc-HYNIC-annexin V tumor uptake values are directly related to the level of ongoing cell death (2–4) and that the uptake of 99mTc-labeled annexin V in tumors is biphasic, with an initial sharp increase occurring early—within hours—after administration and a second, longer, sustained increase in uptake probably occurring between 20 and 48 h after treatment initiation (5–9).
This article reports on changes in relative 99mTc-HYNIC-annexin V tumor uptake over time in patients undergoing chemotherapeutic treatment at baseline and at 5–7 h and 40–44 h after treatment initiation. Imaging results are related to clinical outcomes, as assessed with response evaluation criteria in solid tumors (RECIST) (10).
MATERIALS AND METHODS
Patients
We prospectively included 20 patients (11 men and 9 women; mean age, 59.8 y; range, 22–75 y) scheduled for chemotherapy (n = 19) or bisphosphonate treatment (n = 1) in the study after written informed consent was obtained. All patients had a histologically proven solid malignancy: breast cancer (n = 7), malignant melanoma (n = 3), head and neck cancer (n = 2), bladder cancer (n = 1), liver metastases with unknown primary cancer (n = 1), esophageal cancer (n = 1), hypernephroma (n = 1), small cell lung cancer (n = 1), colon cancer (n = 1), teratocarcinoma (n = 1), and yolk sac tumor (n = 1). Curable disease was present in 5 patients (2 breast cancer patients [neoadjuvant chemotherapy], 1 small cell lung cancer, 1 teratocarcinoma, and 1 yolk sac tumor). The other patients had metastatic disease and were treated in a palliative setting. Patient characteristics and treatment modalities are summarized in Table 1. Three of the 20 enrolled patients were excluded from analysis for the following reasons: 1 patient ultimately refused the proposed chemotherapy treatment (breast cancer) after the pretreatment scan was performed; because of difficulties with the labeling procedure, 1 patient did not receive a pretreatment scan (colon cancer); and 1 patient developed an allergic reaction (rash and nausea) after the first injection of the 99mTc-HYNIC-annexin V formulation. The remaining 17 patients underwent 3 scintigraphic scans with 99mTc-HYNIC-annexin V: the first scintigraphic scan was performed within 1 wk before the start of treatment (scan 1), the second scan was performed on day 1 of treatment (5–7 h after the start of chemotherapy; scan 2), and the third scan was performed 40–44 h after treatment initiation (scan 3). The tumor response was evaluated with RECIST. Physical examination and CT were performed before treatment, 3 mo after the start of treatment, and 6 mo (if patients were still alive) after the start of treatment to classify the clinical response as complete response, partial response, stable disease, or progressive disease.
Patient Characteristics, Treatment Modalities, and Clinical Outcomes
99mTc-HYNIC-Annexin V Planar and Tomographic Imaging
99mTc-HYNIC-annexin V in kit formulation was prepared according to the guidelines provided by the manufacturer (Theseus Imaging Corp.). Each patient received a volume of approximately 1.6 mL of reconstituted product containing approximately 550 MBq (SD, 110 MBq) of 99mTc-HYNIC-annexin V. Planar whole-body images (sweep rate, 15 cm/min) and SPECT images of the tumor or metastatic region (“step-and-shoot” mode: 1 step/3°, 30-s frame time, 128 × 128 matrix) were acquired 4–6 h after injection in all patients with a dual- or triple-head γ-camera (Marconi) equipped with low-energy, high-resolution collimators. The energy peak was centered at 140 keV with a 20% window. Acquired images were transferred to a Hermes system (Nuclear Diagnostics Ltd.; Solaris operating system) for processing.
Image Processing and Data Analysis
Raw tomographic data were reconstructed with a commercially available ordered-subset expectation maximization algorithm (OSEM; 4 iterations, 6 subsets) and postfiltered with a Butterworth filter (cutoff frequency, 0.8; order, 7). Transaxial, coronal, and sagittal slices were visually assessed for the presence of tracer accumulation at known tumor sites by 2 experienced nuclear medicine physicians. Ratios of tumor activity to background activity were derived from the slice containing the maximal diameter of the largest known lesion by dividing the counts within a region of interest (ROI) drawn manually around the tumor by the counts in an identical ROI mirrored in contralateral normal tissue. Tomography image sets obtained for each patient were realigned with each other automatically by use of commercially available software (the principal-axis algorithm followed by the iterative Powell minimization algorithm) and ROIs copied from the pretreatment scan to allow assessment of changes in the ratios of tumor activity to background activity over time. Changes on scan 2 or scan 3 exceeding 25% the baseline value derived from scan 1 were considered significant (11).
RESULTS
Patient data and results are shown in Table 1.
Of 17 patients, 7 responded (3 complete responders and 4 partial responders) to treatment, as assessed with RECIST (Figs. 1 and 2). The baseline ratios of tumor activity to background activity exceeded 1 in 5 responders and were equal to 1 in the other 2 responders. In 6 of the 7 responders, significant changes in the ratios of tumor activity to background activity from the baseline value were evident: a significant increase at 5–7 h and a subsequent decrease at 40–44 h in 4 patients (significantly lower than the baseline value in patient 8), an isolated significant increase at 40–44 h in 1 patient, and a continuing significant increase over time in 1 patient. In patient 6, no changes were seen over time. The lesion under study in this patient had a 1-cm diameter.

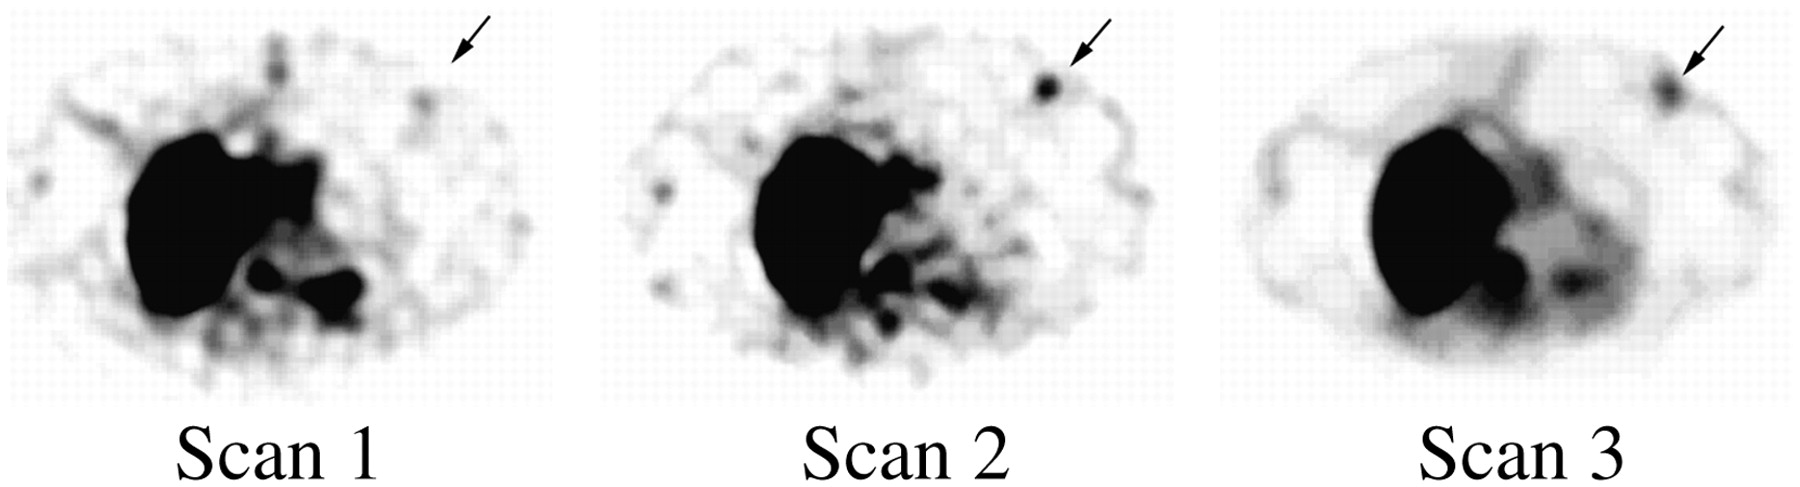
Significant increase in uptake of 99mTc-HYNIC-annexin V over time in primary breast tumor (arrows) in patient 9.
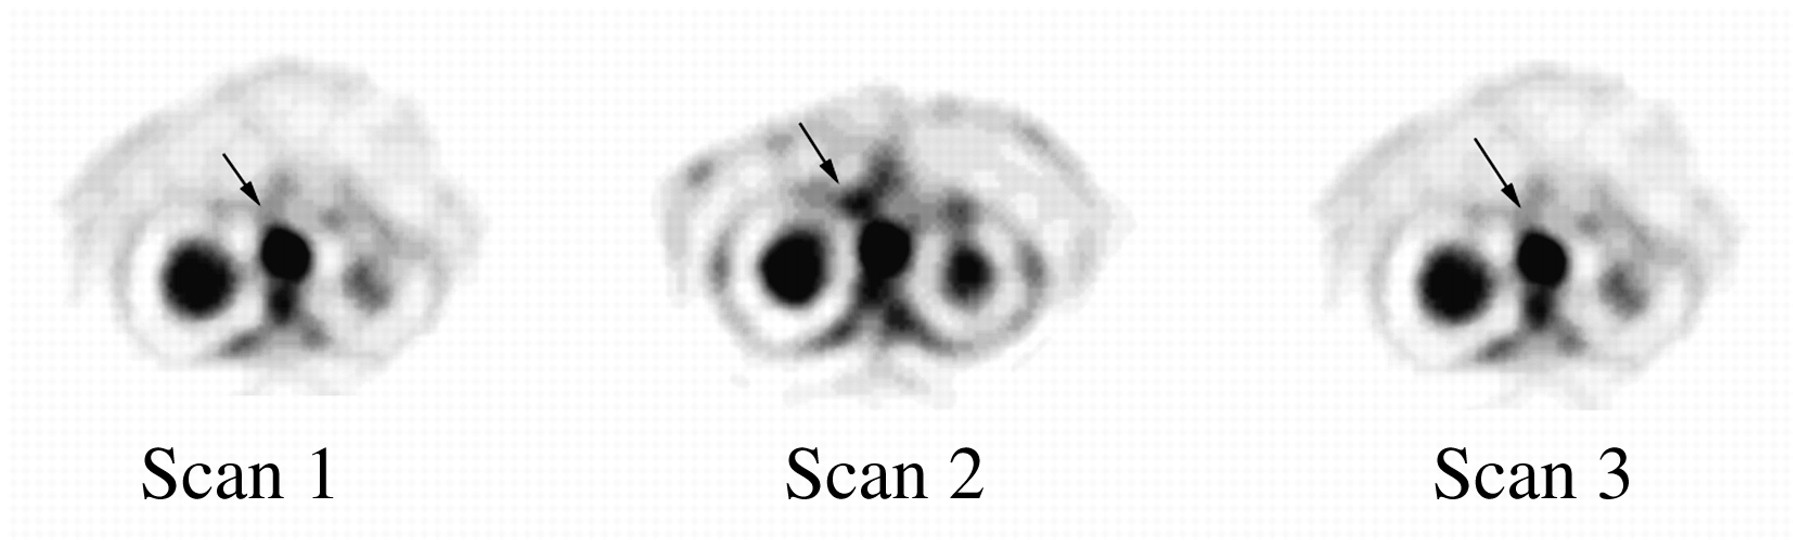
Significant increase on scan 2 with subsequent decrease on scan 3 in uptake of 99mTc-HYNIC-annexin V over time in aortocaval lymph node (arrows) in patient 17 (see ratios of tumor activity to background activity for this patient).
Among the 10 nonresponders, the baseline ratios of tumor activity to background activity were equal to 1 in 8 patients, less than 1 in another patient, and greater than 1 in yet another patient (Fig. 3). In none of the 10 nonresponders did the baseline ratios of tumor activity to background activity change significantly over time.

Absence of changes in uptake of 99mTc-HYNIC-annexin V over time in sternoclavicular bone metastasis relative to baseline bone scan (leftmost image) in patient 11.
With only the baseline ratios of tumor activity to background activity (scan 1) and a cutoff value of 1 (>1 for responders and ≤1 for nonresponders), the obtained accuracy for the purpose of separating responders from nonresponders was 82% (14/17 patients). With the proposed sequential imaging protocol (scans 1, 2, and 3) and a 25% change threshold, responders could be separated from nonresponders with a 94% accuracy (16/17 patients). The sensitivity was 86%, the specificity was 100%, the positive predictive value was 100%, and the negative predictive value was 91%.
Of interest was that when the baseline scan (scan 1) was used in combination with either the 5- to 7-h images (scan 2) or the 40- to 44-h images (scan 3) to predict response to therapy, the accuracy was 88% (15/17 patients). With the baseline scan (scan 1) and the 40- to 44-h images (scan 3), however, a significant decrease rather than an increase in the ratio of tumor activity to background activity was evident for patient 1.
DISCUSSION
It is well known from in vitro and preclinical studies that the level of spontaneous cell death in tumors reflects chromosomal instability and that higher chromosomal instability results in higher sensitivity to chemotherapy, which is directly related to chemotherapy-induced cell death (12,13). In agreement with these findings, 8 of the 10 nonresponders in the present study had ratios of tumor activity to background activity at baseline comparable to the background activity, and in none of the patients did ratios of tumor activity to background activity change significantly over time. In contrast, 5 of the 7 responders had ratios of tumor activity to background activity at baseline higher than the background activity, and in 6 responders, a significant increase in the ratios of tumor activity to background activity over time after treatment initiation was evident. The higher-than-background activity at baseline in responders in the present study versus the absence of tumor uptake in responders in the study of Belhocine et al. (9) likely relates to the difference in the kinetics of 99mTc-BTAP-annexin V (BTAP is [4,5-bis(thioacetamido)pentanoyl]) and 99mTC-HYNIC-annexin V. Because of the slow blood clearance of 99mTc-BTAP-annexin V in the study of Belhocine et al., meaningful planar images of low quality could be obtained only at 24 h (4 half-lives) after radiopharmaceutical injection. Unlike 99mTc-BTAP-annexin V, 99mTc-HYNIC-annexin V has more favorable clearance characteristics, allowing imaging at 4–6 h after radiopharmaceutical injection (14). By that time, nearly all activity is cleared from the blood and, as shown in a previous report by our group, is unlikely to interfere significantly with measurements of the uptake of 99mTc-HYNIC-annexin V by tumors (3).
In the 1 responder showing a baseline value of 1 that did not change over time, the lesion was located in the liver and was approximately 1 cm in diameter. In this patient, the results might have been flawed because of a partial-volume effect and spillover from surrounding liver tissue. In 4 responders, the ratios of tumor activity to background activity increased significantly at 5–7 h after treatment initiation and subsequently decreased at 40–44 h. In 1 other responder, the ratio of tumor activity to background activity increased significantly only at 40–44 h after treatment initiation, whereas in yet another responder, this ratio increased significantly at 5–7 h and increased further at 40–44 h. Given the absence of the complete kinetic profile of apoptosis induction in the patients under study, it is impossible to determine whether the increases found were actually peaks of activity or points on a descending or ascending portion of a curve. Also, we cannot exclude the possibility that a wave of apoptosis was missed entirely by the time schedule defined for imaging before the present study was performed. However, on the basis of available preclinical and clinical data outlined here, it is likely that the increase in activity at 5–7 h, evident in 5 of 6 responders, was part of an early peak of cell death or PS expression. The significance of this early peak in 99mTc-HYNIC-annexin V uptake is currently unclear but may relate to the death of tumor cells at a particularly sensitive phase of the cell cycle, to preapoptotic “stressing” of tumor cells, or to the short-term effects of cytotoxic chemotherapy on vascular endothelial cells.
Evidence that a chemotherapeutic agent directly causes cytotoxicity to the vasculature of a tumor was first reported by Baguley et al. in 1991 (15). In that report, Baguley et al. demonstrated that vinblastine led to greater than 90% cell death of drug-resistant solid tumors within hours but had no effect when the same cells were grown on ascites. Since then, antiendothelial cell effects have been demonstrated in vitro for cyclophosphamide, 5-fluorouracil, and mitomycin C, and short-term antiangiogenic effects have been demonstrated in vitro for vincristine, vinblastine, doxorubicin, mitoxantrone, etoposide, paclitaxel, 6-methylmercaptopurine, tegafur, camptothecin, topotecan, irinotecan, and combretastatin (16,17). The delayed increase in activity evident in 1 patient and the continuing increase in activity compared with the activity on the 5- to 7-h images in yet another patient could represent a second peak of activity assumed to relate to the loss of the bulk of tumor cells through cell death in a fashion similar to that observed in preclinical trials.
It has been suggested that the need for multiple separate injections of 99mTc-labeled annexin V, as performed in the present study, may be considered a relative drawback and that the use of annexin V derivatives with longer half-lives and adjusted molecular weights may make it possible to capture therapy-induced apoptotic cells over a prolonged period. Along these lines, Wen et al. developed 111In-labeled pegylated annexin V (18). In contrast to 111In-diethylenetriaminepentaacetic acid (DTPA)-annexin V, 111In-DTPA-pegylated annexin V performed much better in terms of visualizing tumor apoptosis. Direct comparative studies of 99mTc-HYNIC-annexin V and 111In-DTPA-annexin V, however, were not performed. As with 99mTc-BTAP-annexin V, it is possible that the presence of the DTPA linker significantly influences the biodistribution of annexin V, reducing uptake by the tumor relative to that obtained with the HYNIC formulation. In addition, although the increased half-life of 111In-labeled pegylated annexin V is likely to increase exposure time and penetration into solid tumors, nonspecific uptake is also likely to increase over time given the lower likelihood of washout. In this regard, the increase in the uptake of 111In-DTPA-pegylated ovalbumin, a nonspecific control, by MDA-MB-468 tumors grown in mice at 4 d after paclitaxel treatment was 55.6%; that of 111In-DTPA-pegylated annexin V was 96.7% (19). Also, blood-pool activity is likely to remain high, compromising tumor imaging. Further, the use of an isotope with a long half-life means a reduction of the dose injected and accordingly low count statistics. Finally, although it has been suggested that annexin V with long-term circulation may make it possible to capture therapy-induced apoptotic cells over a prolonged period, the occurrence of apoptosis and the subsequent removal of apoptotic bodies by macrophages take only a couple of hours, and it is only an assumption that radiolabeled annexin V stays within macrophages after internalization. Direct comparative studies of 99mTc-HYNIC-annexin V and 111In-DTPA-pegylated annexin V are needed.
CONCLUSION
In the present study, responders to treatment could be separated from nonresponders with a 94% accuracy (16/17 patients) by use of the proposed sequential imaging protocol and a 25% change threshold. However, the number of patients studied was small, and the histologic nature of the tumors explored and the drugs administered were heterogeneous. Prospective studies with the same imaging protocol and more homogeneous groups of patients in terms of tumor histology and drugs administered are needed to confirm these promising results.
Acknowledgments
This study was funded by the National Fund for Scientific Research.
Footnotes
-
COPYRIGHT © 2006 by the Society of Nuclear Medicine, Inc.
References
- Received for publication June 27, 2006.
- Accepted for publication August 21, 2006.


