


Abstract
Early assessment of the efficacy of treatment is important in patients with breast cancer, whose routine adjuvant regimen frequently includes chemotherapy. Irrespective of the exact mechanisms involved in induction, the common early phenotypic marker of apoptosis is the expression on the outer cell membrane surface of phosphatidylserine, which avidly binds annexin V. 99mTc-labeled annexin V has been proposed for in vivo scintigraphic detection of apoptosis, albeit with contradicting results. This study was performed to define the time course of apoptosis induced by the chemotherapeutic agent paclitaxel in a model of virus-induced murine breast cancer. Methods: The RIII virus induces an estrogen-dependent, slow-growing breast cancer; BALB-c/cRIII female mice with breast tumors averaging 10 mm were studied, both in baseline conditions and at various times after the intravenous administration of paclitaxel (equivalent to a human dose of 20 mg/70 kg of body weight). The biodistribution of 99mTc-annexin V was evaluated at baseline and then at 1, 3, 6, and 24 h after paclitaxel administration. Apoptotic and antiapoptotic markers were also evaluated in tumor samples obtained at the same time points: DNA breaks (terminal deoxynucleotidyl transferase biotin-dUTP nick-end labeling [TUNEL]), active caspase-3, apoptosis-inducing factor, and Bcl-2 protein. Results: Baseline uptake of 99mTc-annexin V in breast tumors was about 2-fold higher than the uptake in normal breast tissue (demonstrating some ongoing apoptosis); tracer uptake increased at 1 and 3 h after paclitaxel administration (to almost double the baseline value) and then declined to levels even lower than baseline. Although no activation of the apoptosis-inducing factor mechanism was detected, a peak in TUNEL-positive tumor cells was reached 3 h after paclitaxel administration (to more than 6-fold the baseline level). The antiapoptotic marker Bcl-2 exhibited a biphasic pattern, with a maximum drop at 3 h, followed by return toward baseline levels at 6 h. Conclusion: These results define the time course of various biologic events taking place in this model of murine breast cancer after a proapoptotic insult (single-dose paclitaxel). Although confirming that in vivo uptake of 99mTc-annexin V reflects the degree of apoptosis, the study also suggests that the apoptotic response to antitumor therapy may differ from tumor type to tumor type. Therefore, contradicting results previously reported may depend on an inadequate time window chosen for imaging with 99mTc-annexin V.
- apoptosis
- annexin V
- murine breast cancer
- paclitaxel-induced apoptosis
- effectiveness of anti-tumor therapy
Early breast cancer is routinely treated with surgery, followed by adjuvant hormonal, chemo-, or radiotherapy, depending on tumor stage and hormonal status. Early assessment of the effectiveness of adjuvant therapy would help to minimize unnecessary treatment when the therapy is ineffective. This experimental study aimed at defining the optimal time window to assess the effectiveness of chemotherapy by evaluating the degree of apoptosis induced in the tumor.
Although most apoptotic events occur via activation of the caspase cascade (1), in caspase-independent apoptosis DNA fragmentation occurs via translocation of the mitochondrial intermembrane flavoprotein (the so-called apoptosis-inducing factor [AIF]) (2). Irrespective of the mechanisms of programmed cell death, an early phenotypic marker of cells undergoing apoptosis is the expression of phosphatidylserine on the outer leaflet of the cell membrane (3).
An endogenous protein originally identified in the human placenta, annexin V binds avidly to phosphatidylserine exposed on the outer membrane surface of cells undergoing apoptosis (4,5). Annexin V can be radiolabeled with 99mTc, and this agent has been proposed for in vivo scintigraphic imaging of apoptosis (6–9).
This report describes the time course of 99mTc-annexin V localization in mice with spontaneous breast cancer after a single administration of paclitaxel (Taxol; Bristol-Myers Squibb). Paclitaxel is a common component of therapy (10) in human tumors and is also effective in mouse models of breast cancer (11–13). Paclitaxel enhances tubulin polymerization, thus inducing mitotic arrest in the G2/M phase with subsequent activation of caspase-10 and of the signaling pathway downstream of this caspase (including caspase-6 and caspase-3), leading to apoptosis. 99mTc-annexin V uptake in the tumor in vivo was correlated with the following in vitro assessments: immunostaining for DNA strand break detection (terminal deoxynucleotidyl transferase biotin-dUTP nick-end labeling [TUNEL]), immunostaining for activated caspase-3, immunostaining for expression of the AIF, and Western-blot for expression of the Bcl-2 protein. Although the TUNEL and caspase-3 determinations assess the degree of caspase-dependent and caspase-independent paclitaxel-induced apoptosis, respectively, expression of the Bcl-2 protein is an important landmark of the antiapoptotic mechanisms activated by cells in response to a proapoptotic insult or stimulus (14).
MATERIALS AND METHODS
Animal Model
Estrogen-dependent breast cancer was induced in BALB/c-RIII female mice by the RIII virus (murine mammary tumor virus) (15). This tumor is characterized by a slower rate of growth than other types of virus-induced breast cancer in mice, because the breast tumor develops at an average age of 230 d and average clinical duration of the disease until death is 104 d. The animals die because of diffuse local and metastatic disease (especially in the lung and liver). Five groups of 10 RIII mice each were used for 99mTc-annexin V biodistribution when their dominant breast tumor was about 1 cm in diameter (average age of the animals, ∼10 mo). Groups of animals were studied at baseline and at 1, 3, 6, and 24 h after the intravenous administration of 0.02 μg of paclitaxel per gram (∼0.6 μg/mouse, equivalent to a standard human dose of 20 mg/70 kg). Five groups of 10 non–tumor-bearing BALB/c mice served as controls; 99mTc-annexin V biodistribution at the same time points after paclitaxel administration as in the tumor-bearing mice was evaluated.
Labeling and Purification
Recombinant human annexin V derivatized with hydrazinonicotinamide, an imaging agent approved for human use, was kindly provided by Theseus Imaging Corp. (16). Freshly reconstituted tin/tricine reagent and 740–1,110 MBq of freshly eluted 99mTc were added, and the mixture was incubated for 15 min at room temperature (resulting in a specific activity of ∼10–15 MBq/μg of protein), as previously described (16). The radiolabeling efficiency, evaluated by Sephadex G25 column (Roche Applied Science) chromatography, ranged between 85% and 90%, and specific activity calculated after chromatographic purification ranged between 10 and 15 MBq/μg of protein. The tracer was injected intravenously through the tail in the amount of 37–55 MBq of 99mTc-annexin V (in a 150-μL volume), corresponding to about 3.5 μg of protein per mouse.
Biodistribution and Histologic Analysis
Animals were sacrificed at 1 h after 99mTc-annexin V injection, and the tumor and other organs or tissues were dissected, blotted dry, weighed, and counted in a well-type γ-counter (1282 CompuGamma CS Universal Gamma Counter; LKB-Wallac) for 3 min each, along with an aliquot of the injectate and the tail (to correct data for partial extravasation of the injectate). Accumulation of radioactivity in organs or tissues was expressed as percentage of injected dose per gram of tissue (%ID/g). The tumor–to–contralateral breast, tumor-to-muscle, and tumor-to-blood ratios were derived from the %ID/g values in each tissue.
Before weighing for γ-counting, 2 aliquots of tumor were obtained for histology: one was frozen at −20°C in dry ice, and the other was placed in 4% formalin.
Three-micrometer slices of formalin-fixed paraffin-embedded tissue samples were used for evaluating histology (hematoxylin and eosin staining) and visualizing biologic markers of apoptosis as follows. Cell membranes were permeabilized with proteinase K (1:100 in 10 mM Tris buffer, pH 8), and apoptotic cells in each specimen were visualized by direct fluorescence fragment end labeling of DNA breaks (TUNEL) using a commercially available kit (Fluorescein FragEL; Calbiochem). Caspase-3 was also immunostained using an antihuman–mouse–rat active caspase-3 antibody (Rabbit Anti-Active Caspase 3 Polyclonal Antibody; Chemicon International) after incubation with a fluorescein-labeled secondary antibody (Alexa Flour 488 goat antirabbit IGg; Molecular Probes). The antihuman–mouse–rat anti-AIF antibody (Rabbit Anti-AIF Polyclonal Antibody; Chemicon International) was used for evaluating the AIF after incubation with a fluorescein-labeled secondary antibody (Alexa Flour 488 goat antirabbit IGg; Molecular Probes). TUNEL-stained, caspase-3–stained, and AIF-stained cells were counted in 10 randomly selected high-power tumor fields (magnification, ×200) and related to the number of total cells as evaluated by SYTOX Orange (Molecular Probes) staining for double-stranded DNA. Observers counted the cells stained with SYTOX Orange for different biologic markers in a masked fashion, unaware of the treatment schedule that each animal had undergone.
Western-blot analysis of Bcl-2 expression was performed on fresh frozen samples using a rabbit polyclonal antibody (N19; Santa Cruz Biotechnology) and quantitatively evaluated using Quantity One Analysis Software (BioRad).
Statistical Analysis
All values are expressed as median ± SD, as customary for nonparametric data. Statistical analyses were performed using 3 different nonparametric tests: the Mann–Whitney U test to evaluate the significance of differences in values between the control and the treated animals, Kruskal–Wallis test, and Dunn Procedure (including Bonferroni adjustment) for all-pairwise comparison, to assess the significance of differences among groups at different time points.
RESULTS
The biodistribution data of 99mTc-annexin V for organs or tissues other than tumors observed at baseline and at various times after chemotherapy in the tumor-bearing BALB/c-RIII mice are detailed in Table 1 (results obtained in the control BALB/c mice were virtually superimposable to those observed in the tumor-bearing animals). 99mTc activity in the thyroid (∼0.2 %ID/g) and in the stomach (≤0.4 %ID/g) were consistently low, thus confirming the absence of free pertechnetate in the injectate and the substantial stability of 99mTc-annexin V in vivo. High concentrations of 99mTc were consistently seen in the kidney (7–16 %ID/g) and in the liver and spleen. Uptake in normal organs or tissues (including normal breast contralateral to the breast cancer) did not exhibit any distinct pattern of change after paclitaxel administration, except for the liver (uptake peaking at 3 h after paclitaxel administration to ∼2.24-fold the baseline value, P = 0.001) and small bowel (uptake peaking at 6 h after paclitaxel administration to ∼2.65-fold the baseline value, significantly greater than at any other time point, P = 0.0095).
Biodistribution of 99mTc-Annexin V (Fraction of %ID/g) in Nontumor Organ or Tissues of BALB/c-RIII Mice at Baseline and at Sequential Times After Intravenous Administration of Paclitaxel (0.02 μg/g of Body Weight)
Annexin uptake in the breast tumor was almost 2-fold the uptake in normal, contralateral breast parenchyma, thus suggesting ongoing baseline apoptosis in this virally induced tumor (17). 99mTc-annexin V uptake in the tumors started to increase at 1 h, peaked at 3 h (Fig. 1), and subsequently declined to levels even lower than baseline uptake (Table 2; Fig. 2). Dunn–Bonferroni analysis (α-test for group comparisons) showed that both the 1- and the 3-h uptake of 99mTc-annexin V were significantly higher than either the 6- or the 24-h values. The resulting target-to-nontarget ratios at various times after paclitaxel administration are reported in Table 2 as tumor–to–normal breast and tumor-to-muscle values.

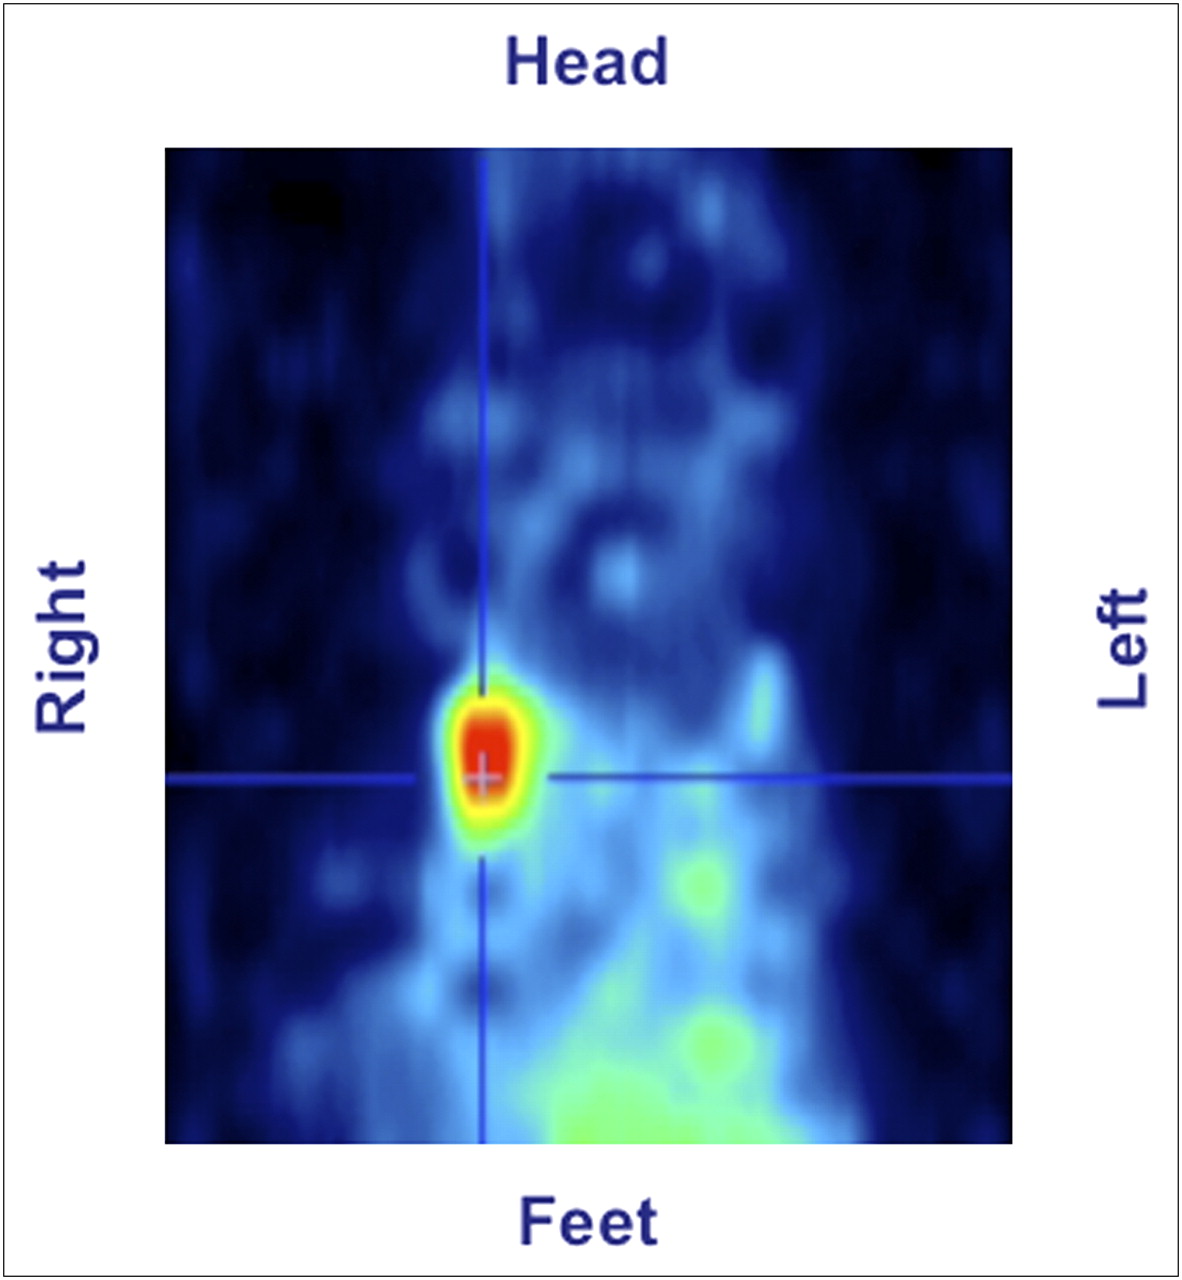
Scintigraphic visualization of 99mTc-annexin V uptake in mouse with breast cancer imaged with small-animal PET/SPECT camera at 1 h after administration of 15 MBq of 99mTc-annexin. Animal had received 0.6 μg of paclitaxel intravenously 3 h before administration of radiopharmaceutical. Representative coronal tomographic slice clearly shows accumulation of 99mTc-annexin V in upper right breast cancer (40).

Annexin uptake (%ID/g) in normal breast (gray bars) and tumor breast (red bars) at baseline and then at 1, 3, 6, and 24 h after paclitaxel administration.
Uptake of 99mTc-Annexin V in Breast Cancer (%ID/g, Median ± SD) Measured in Baseline Conditions and at Sequential Times After Paclitaxel Administration and Corresponding Average Tumor–to–Contralateral Breast and Tumor-to-Muscle Uptake Ratios
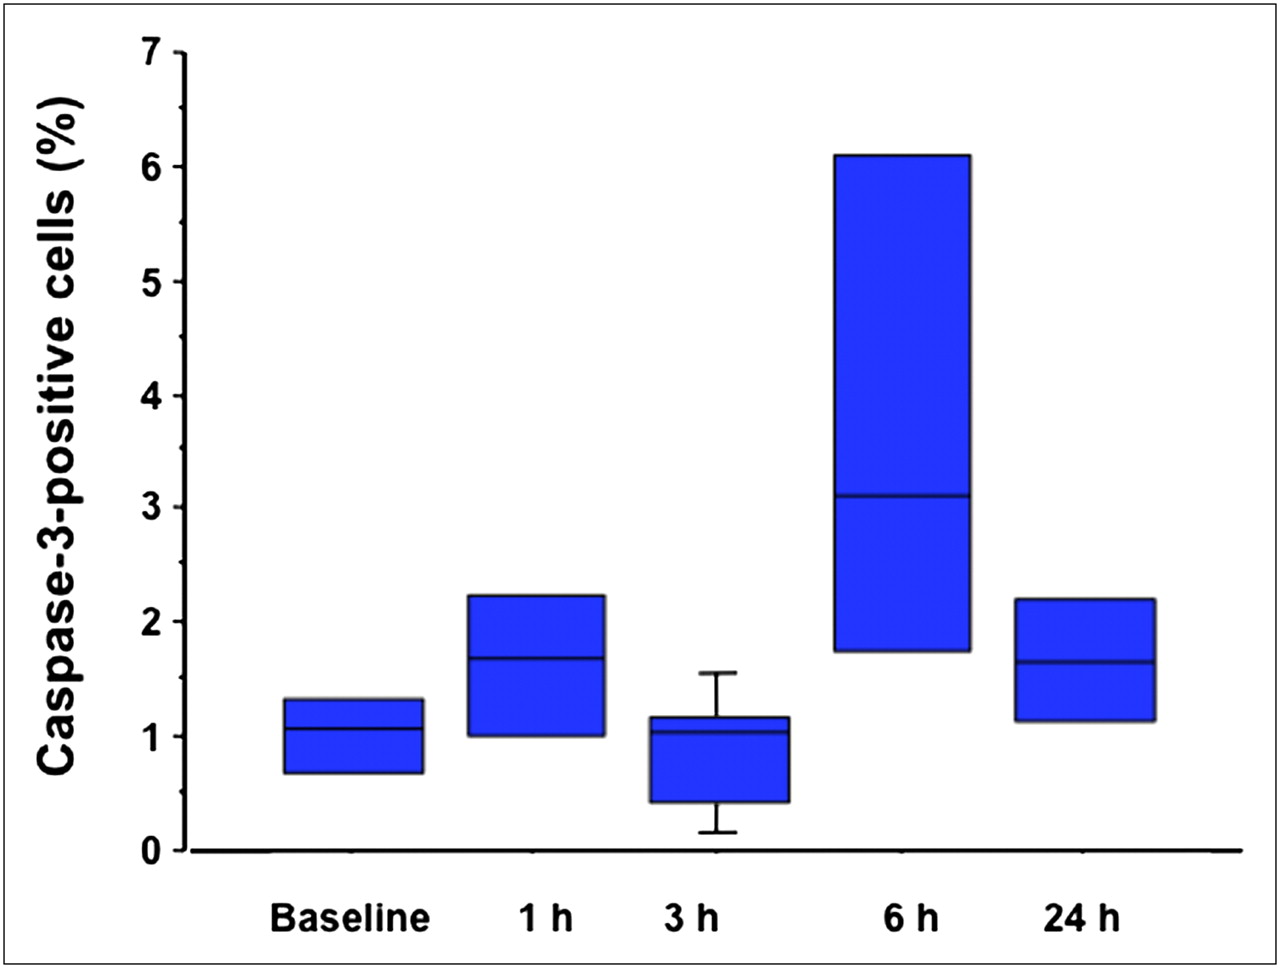
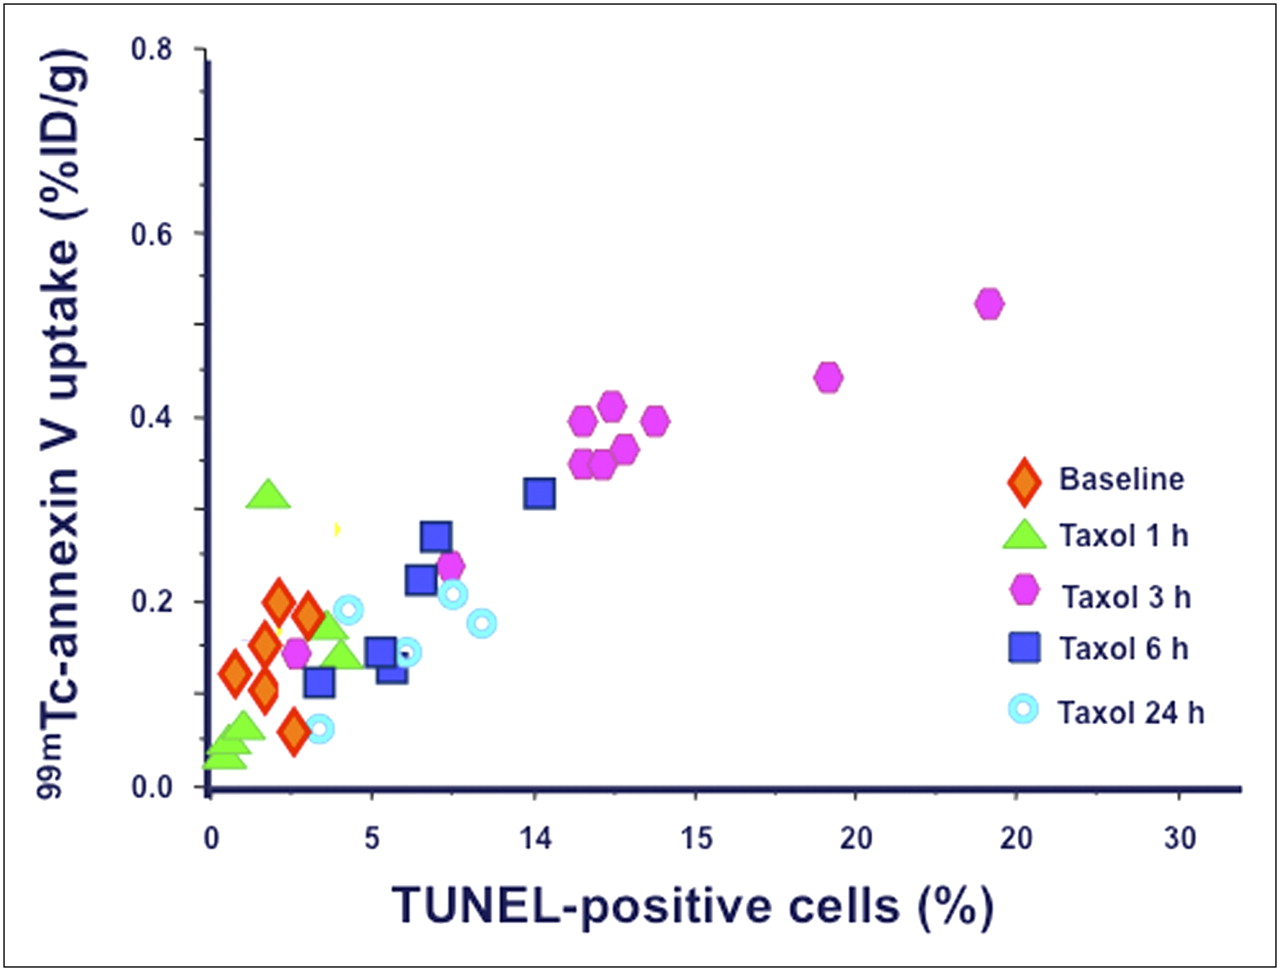
Figure 3 depicts TUNEL and caspase-3 immunostaining (green fluorescence) in sections of breast cancer at various times after paclitaxel administration, correlated with the total number of cells in each section (red staining). The only distinct peak in the fraction of TUNEL-positive cells is reached at 3 h after treatment (Fig. 4), whereas active caspase-3 has a small peak at 1 h and a much higher peak at 6 h after paclitaxel administration (Fig. 5). The fraction of the TUNEL-positive cells was about 4-fold greater than the corresponding value of the caspase-3–positive cells. The time pattern of increase in 99mTc-annexin V uptake after paclitaxel administration was concordant with the corresponding pattern observed in the TUNEL-positive tumor cells (P < 0.0001, R = 0.81; Fig. 6). The time pattern of caspase-3 staining did not show any definite correlation with the corresponding pattern in the degree of 99mTc-annexin V uptake by the breast tumors. Finally, AIF staining did not show any significant positivity (data not shown). Expression of the Bcl-2 protein was clearly reduced as early as 1 h after paclitaxel administration (85% of baseline), the value being lowest at 3 h (32%) and then returning toward baseline levels at 6 h (80%).

Fluorescence images of fluorescein fragment end labeling for DNA breaks (TUNEL) and immunostaining of cleaved caspase-3 in RIII mouse breast cancers at baseline and at various times after paclitaxel administration. Positively stained cells (green) are related to total cell number on each slide, as shown by SYTOX Orange stain with double-stranded DNA (red).

Whisker-and-box plot showing fraction of TUNEL-positive cells in breast cancers at baseline condition and then at 1, 3, 6, and 24 h after paclitaxel administration.

Whisker-and-box plot showing fraction of active caspase-3–positive cells in breast cancers at baseline condition and then at 1, 3, 6, and 24 h after paclitaxel administration.

Correlation between 99mTc-annexin V uptake (%ID/g) and fraction of TUNEL-positive cells in breast tumors at different time points after administration of paclitaxel (R = 0.81, P < 0.0001).
DISCUSSION
Early treatment of breast cancer has a definite clinical impact on patients' prognosis (18). Monitoring the efficacy of treatment is crucial to ascertain that the patient is actually receiving an effective regimen. Current guidelines for assessing tumor response to therapy (Response Evaluation Criteria in Solid Tumors) (19) still rely heavily on the reduction of tumor volume. Nevertheless, this anatomy-based parameter is a late indicator of the efficacy of therapy. In fact, changes in gross tumor morphology are heralded by several changes in tumor pathophysiology that can better be evaluated by assessing metabolic parameters of cancer cells, such as glucose consumption, proliferative activity, and apoptosis (20).
Effective antitumor therapy induces apoptosis early in treatment. Any procedure estimating the degree of apoptosis would provide an early indication of tumor cell sensitivity to therapy and therefore an early index of response to treatment. In this work, we evaluated the potential of 99mTc-annexin V uptake as an early indicator of apoptosis induced by a single administration of paclitaxel in a mouse model of spontaneous breast cancer, and we found that 99mTc-annexin V uptake in breast cancers peaked between 1 and 3 h after paclitaxel administration. Because phosphatidylserine expression occurs before caspase-induced DNA fragmentation, this finding is consistent with the distinct 3-h peak observed in the fraction of TUNEL-positive tumor cells, as also with the peak expression of caspase-3 reached 6 h after paclitaxel administration. These observations confirm that pathways of apoptosis vary among different tumor cell lines and, in particular, that predominant paclitaxel-induced apoptosis can be caspase-3–independent (21,22). Nevertheless, because treated tumors did not stain positively for AIF (an indicator of caspase-independent apoptosis), the occurrence of caspase-mediated apoptosis can reasonably be assumed in this setting (23,24), most likely involving other members of the caspase family (such as caspase-6, caspase-8, and caspase-10). However, it should be emphasized that the possibility of apoptosis both AIF- and caspase-independent has occasionally been reported (25). Expression of Bcl-2, an indicator of a potent antiapoptotic mechanism, is low at the peak of apoptosis (as defined by 99mTc-annexin V uptake), consistent with its crucial protective role in the cell death pathway. Thus, paclitaxel-induced apoptosis is facilitated by a concomitant activation of the caspase family cascade and a reduction of the Bcl-2 defense pathway.
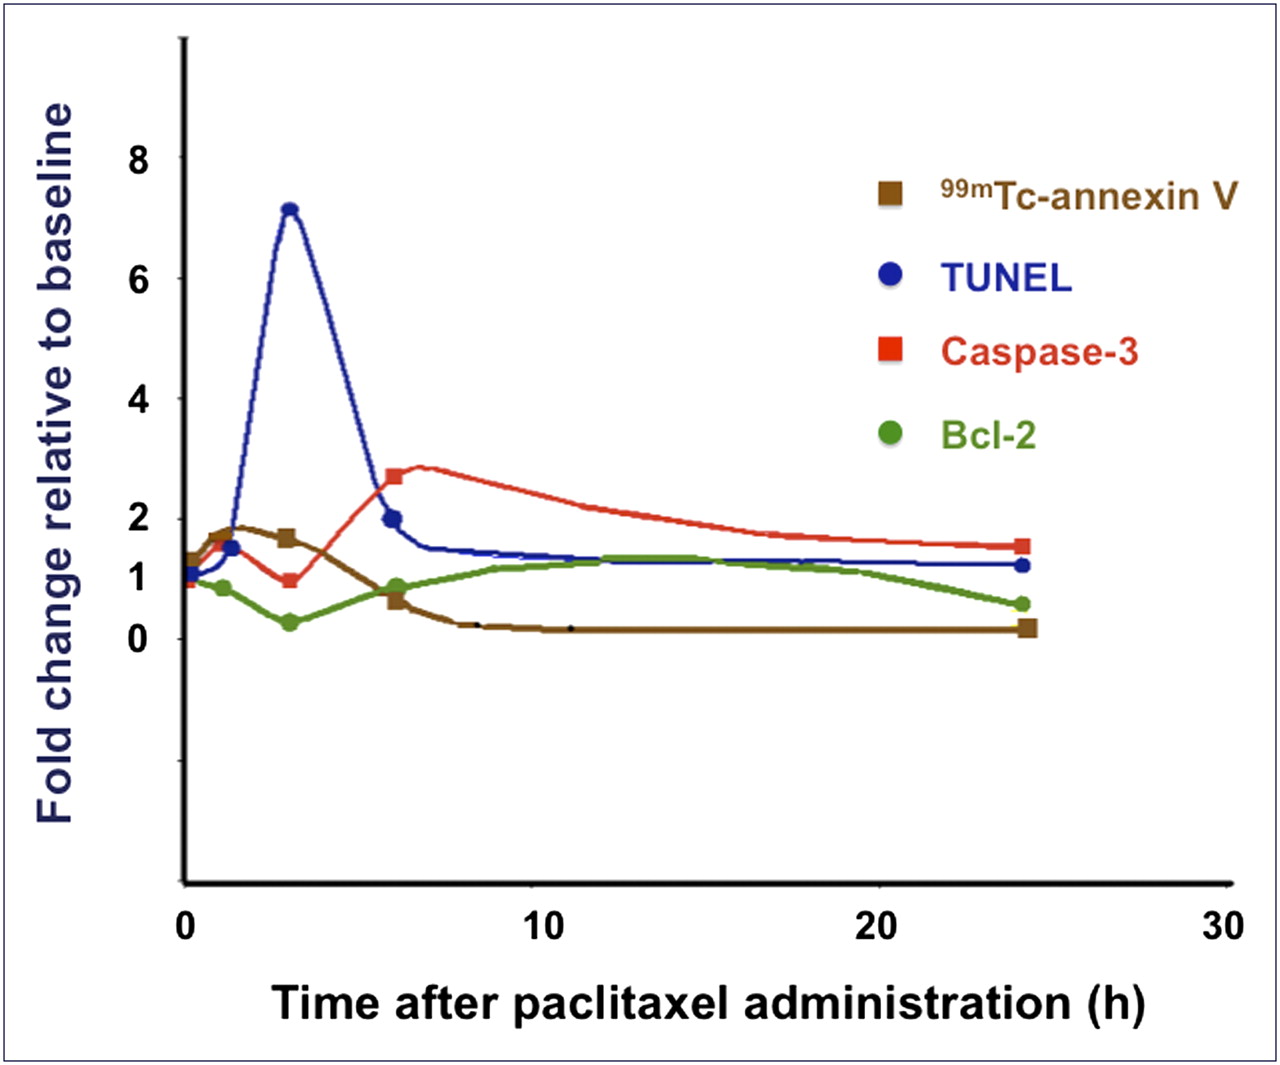
Figure 7 combines in a single plot the time course of each of these described molecular markers, each normalized as a fold-change with respect to baseline levels. 99mTc-annexin V is the earliest positive molecular probe, detecting apoptosis as early as 1 h after paclitaxel administration. A concordant sharp but slightly delayed TUNEL positivity (peaking at 3 h) then follows, whereas positivity for caspase-3 is further delayed (peaking at 6 h) and less sharp than TUNEL positivity. On the other hand, expression of the Bcl-2 protein shows an inverse pattern relative to the 3 markers of apoptosis, being lowest at the time of maximum cell death. We are currently investigating the relationships between key molecules of apoptosis and therapy-induced changes in mitochondrial membrane permeability in the same animal model of breast cancer used for the present study.

Interpolated curves showing course of 99mTc-annexin V uptake and positivity of TUNEL, caspase-3, and Bcl-2 expression in breast cancers as function of time after treatment with paclitaxel. Because starting point of each curve is normalized to numeric value of 1 (baseline/baseline for each set of data), any increment above baseline corresponds to values greater than 1, whereas any reduction corresponds to values less than 1.
Endogenous breast cancer in animal models follows a course similar to that in humans and is sensitive to paclitaxel (13,26,27). The results obtained in this study are consistent with in vitro data showing that exposure of tumor cells to paclitaxel for as briefly as 3–4 h is sufficient to induce apoptosis (27–29). In our in vivo model, the decline in 99mTc-annexin V uptake after the 3-h peak may be due to the ongoing process of cell debris or remnant clearance, which does not occur when performing an experiment with cancer cells in culture. On the other hand, in a different animal model of drug-induced apoptosis (rats bearing an allogenic hepatoma implant) the maximum of 99mTc-annexin V uptake was reached 20 h after a single dose of cyclophosphamide (the authors do not report measurement of uptake at later times) (30).
The potential of 99mTc-annexin V for in vivo detection of apoptosis has been described in different animal models of disease, as also in pilot studies performed in patients with, for example, acute cardiac transplant rejection, Crohn disease, non–small cell lung cancer, and head and neck cancer (31–33). However, discordant results have been reported with 99mTc-annexin V for scintigraphic evaluation of apoptosis induced by therapy in cancer patients (in whom the studies were conducted with the purpose of identifying a novel prognostic marker of response to antitumor therapy); tracer uptake has alternatively been found to be increased or decreased after treatment (34–37). In most of these studies, imaging with 99mTc-annexin V was performed 24–48 h after antitumor therapy.
The results obtained in our experimental study suggest that failures to demonstrate consistently an increased 99mTc-annexin V uptake after treatment may be due to selection of an inappropriate interval between the administration of chemotherapy and the imaging with radiolabeled annexin. In fact, the ability to detect an increase in annexin V uptake is heavily dependent on the time pattern of apoptosis being induced by a given chemotherapy agent on a given tumor type; in this regard, defining the optimal time for scintigraphic imaging with radiolabeled annexin V is a highly debated issue (38). The time pattern of annexin V uptake (therefore of phosphatidylserine expression) induced by antitumor treatments in different animal tumor models varies from 1 to more than 20 h after a single proapoptotic insult, sometimes even with a biphasic pattern (i.e., an early peak at 1 h followed by a later peak between 24 and 72 h) (6–8,13,31–37). The biphasic pattern might be related to the time required for some drugs (such as cyclophosphamide) to be metabolically converted into more active drugs for exerting their maximum cytotoxic effect, a feature that is not shared by all chemotherapy agents.
Some pharmacokinetic properties of 99mTc-annexin V can amplify the effect of selecting an inadequate time window on the capability of this radiopharmaceutical to detect the proapoptotic effect of antitumor therapies. In particular, the short biologic half-life of 99mTc-annexin V (with rapid blood clearance and lack of significant redistribution already evident 30 min after intravenous administration) might limit its penetration into solid tumor areas where perfusion is maintained, thus reducing its sensitivity in detecting phosphatidylserine expression on the outer membrane of apoptotic cells. The relatively high uptake of 99mTc-annexin V in normal organs (predominantly the liver, besides a physiologic excretory site such as the kidneys) most likely reflects ongoing physiologic apoptosis of normal organs and some nonspecific mechanism such as apoptotic cell binding or cell debris engulfment by phagocytic cells in the liver, spleen, and lung. On the other hand, binding of annexin V to nonphosphatidylserine substances has also been reported, for example, anionic polysaccharides such as heparan sulfate (39). In this regard, the use of a radiopharmaceutical with a longer biologic half-life and longer physical half-life (such as polyethylene-glycol–linked annexin labeled with 111In) (13) is interesting and might actually disclose new opportunities for investigation, also considering its low accumulation in the kidneys. Nevertheless, this new agent was not available to us, and we used recombinant human hydrazinonicotinamide–annexin V because, to our knowledge, this is the only agent approved by the Food and Drug Administration for human use.
CONCLUSION
The results obtained in this study support the working hypothesis that in vivo uptake of 99mTc-annexin V reflects the degree of apoptosis and that its evaluation therefore can allow monitoring of early tumor response to treatment. The prospect thus remains within reach of developing a new noninvasive imaging procedure that can contribute to personalized antitumor treatments. Nevertheless, it should be emphasized that evaluating the time course of 99mTc-annexin V uptake is critical for any given clinical setting, because the apoptotic response to antitumor therapy may differ from tumor type to tumor type and possibly also from one chemotherapy agent to another agent.
Acknowledgments
We thank Dr. Jean-Luc Vanderheyden (now with the Molecular Imaging Section of GE Healthcare) for his precious help in the supply of recombinant human annexin V derivatized with hydrazinonicotinamide, kindly provided by Theseus Imaging Corporation (Boston, Massachusetts) and for helpful discussions while performing the study.
Footnotes
-
COPYRIGHT © 2010 by the Society of Nuclear Medicine, Inc.
References
- Received for publication October 19, 2009.
- Accepted for publication February 11, 2010.


