


Abstract
Multidrug resistance (MDR) associated with increased expression and function of the P-glycoprotein (Pgp) efflux pump often causes chemotherapeutic failure in cancer. To provide insight into both the dynamics of the pump and the effects of MDR, we radiolabeled paclitaxel, a substrate for the Pgp pump, with 18F to study MDR in vivo with PET. We obtained biodistribution and radiation dose estimates for 18F-paclitaxel (FPAC) in monkeys and studied the effects of a Pgp blocker (XR9576, tariquidar) on FPAC kinetics. Methods: Paired baseline and Pgp modulation (2 mg/kg XR9576) 4-h whole-body dynamic PET scans were obtained in 3 rhesus monkeys after injection of FPAC. Measured residence times were extrapolated to humans and radiation dose estimates were obtained using MIRDOSE3.1. The postmodulator area under the time–activity curves (AUCs) and Logan plot slopes, a measure of tracer distribution volume (equilibrium tissue-to-plasma ratio) that is inversely proportional to tracer efflux, were compared with baseline values to determine changes in FPAC distribution. Results: Cumulative activities of the organs sampled accounted for 80% of the injected dose. The critical organ is gallbladder wall (0.19 mGy/MBq [0.69 rad/mCi]), followed by liver (0.14 mGy/MBq [0.52 rad/mCi]); the effective dose is 0.022 mSv/MBq (0.083 rem/mCi). XR9576 preinfusion changed the Logan plot slope for liver by +104% (P = 0.02), lung by +87% (P = 0.11), and kidney by −14% (P = 0.08). Changes in the mean AUC (normalized to the plasma AUC) were +54% (P = 0.08), +97% (P = 0.04), and −12% (P = 0.02), respectively, for liver, lung, and kidney. No significant difference was found in the metabolite-corrected plasma AUC (normalized to the injected dose) between the baseline and XR9576 modulator studies (P = 0.69). Conclusion: Under Radioactive Drug Research Committee guidelines, 266 MBq (7.2 mCi) FPAC can be administered to humans up to 3 times a year. The increase in FPAC accumulation in liver and lung after XR9576 is consistent with Pgp inhibition and demonstrates the potential of FPAC to evaluate MDR.
Chemotherapeutic failure due to multidrug resistance (MDR) is a common problem in cancer treatment. In general, MDR refers to a phenotype, in which a tumor is resistant to a large number of natural chemotherapeutic drugs (e.g., anthracyclines, vinca alkaloids, epipodophyllotoxins, and taxanes) (1). Whereas some cancer types express the MDR phenotype innately, many other tumor types acquire resistance after initial chemotherapy administration. One mechanism for this resistance is that these drugs are actively pumped out of the tumor cells by a membrane pump, reducing the intracellular concentration of the drug, and thereby reducing its clinical effectiveness (2).
Overexpression of the membrane pump, P-glycoprotein (Pgp), a 170-kDa membrane protein encoded by the MDR1 gene in humans (chromosome 7), results in MDR in many tumor types (1). Pgp is normally found in human liver, kidney, intestine, blood–brain barrier, blood–testicular barrier, bronchial cells, and hematopoetic stem cells. It appears either to prevent toxins from accumulating in cells (returning them to bloodstream) or to remove toxins from the body (extracting them from bloodstream) (3). In vitro studies have shown that it is possible to completely reverse the MDR phenotype in tumor cell lines by inhibiting the Pgp pump with a variety of chemical modulators (4–6). Early modulators caused dose-limiting clinical toxicity (verapamil, cyclosporin A) (1) or were not specific for Pgp, resulting in changes in the pharmacokinetics of the administered chemotherapeutic (7). More specific modulators are currently under investigation (1).
In vitro studies can be used to determine relative amounts and distribution of Pgp in tumors cells by reverse transcriptase polymerase chain reaction testing for messenger RNA or by monoclonal antibody testing for the Pgp protein itself. The relative levels of Pgp expression have been correlated with MDR in cell killing and cytotoxin uptake studies, but the presence of the pump protein does not always imply function or the level of function (8). The function of the Pgp pump depends on its affinity for the substrate being pumped, current occupancy by endogenous substrates, and the specific Pgp mutation present (9).
Functional imaging studies aimed at predicting which tumors will exhibit MDR have been performed using Pgp substrates such as sestamibi, tetrofosmin, and furifosmin labeled with 99mTc. In small groups of patients, uptake of these tracers has been shown to correlate with tumor response to chemotherapy (10–12) and radiotherapy (13); therefore, imaging should predict the presence of the MDR phenotype. SPECT of MDR modulator function in mice (14) and in patients with renal cell carcinoma (15) showed increased tracer retention (decreased net efflux) in tumors after modulator (PSC833) administration, suggesting MDR pump inhibition.
SPECT’s main disadvantage is its limited ability to provide quantitative data. PET provides a quantitative method of evaluating in vivo pump function. By radiolabeling a commonly used chemotherapy agent known to be removed from tumors by Pgp with a positron emitter, a more accurate assessment of tumor drug resistance can be obtained. Paclitaxel, a natural chemotherapeutic agent (a taxane) derived from the yew tree, Taxus brevifolia (16), is a substrate for the Pgp pump. It is not considered to be a substrate of an alternative MDR-related pump, the multidrug-resistant protein (MRP) (17). We have developed an efficient fluorination method to synthesize 18F-paclitaxel (FPAC) (18) and studied its biodistribution in wild-type and mdr1a(−)/1b(−) knockout mice (with no Pgp) (19).
To evaluate FPAC as a marker for MDR, we performed PET studies in 3 nontumor–bearing monkeys at baseline and after administration of an MDR modulator. To modulate Pgp function in normal tissues, we used XR9576 dimesylate (tariquidar; QLT Inc.), a third-generation MDR modulator that is specific for Pgp. XR9576 is an anthranilic acid derivative that has been shown to reverse MDR in Pgp-expressing cell lines (20,21). It is a noncompetitive modulator that binds to Pgp at a site separate from the binding site for paclitaxel transport and its in vitro duration of action is >24 h. Its uptake appears to be by passive diffusion and is independent of Pgp expression (21). We performed control and modulator (XR9576) FPAC studies to assess the potential use of FPAC as an in vivo marker for MDR caused by increased Pgp function. We measured the change in the FPAC concentration in organs normally expressing Pgp. Baseline biodistribution data were also used to obtain radiation dose estimates for FPAC in humans.
MATERIALS AND METHODS
FPAC Synthesis
The radiochemical synthesis was accomplished via a multistep radiosynthetic pathway as described (18,22). Briefly, 18F-fluoride was incorporated into 18F-fluorobenzoate ester via displacement of a trimethylammonium moiety. The ester group was removed and the resulting 18F-fluorobenzoic acid was coupled to 3′debenzoylpaclitaxel with diethyl cyanophosphonate and a trialkylamine. The final product was purified by high-performance liquid chromatography (HPLC). The radiochemical yield for the syntheses conducted for these studies was 15% ± 5% (range, 9%–19%), not corrected for decay. A sample of the final product was analyzed for mass by HPLC/ultraviolet absorbance (230 nm) to provide an assay of the specific activity. The specific activity at the end of bombardment was 228,105 ± 12,954 MBq/μmol (6,165 ± 3,501 mCi/μmol; range, 1,809–14,015 mCi/μmol) for 13 syntheses. The synthesis takes ∼80 min (18).
Imaging
We studied FPAC biodistribution in rhesus monkeys with and without (baseline) the preadministration of modulator. Two baseline and 2 modulator dynamic PET studies were performed in each of 3 rhesus monkeys (2 males, 8.7 and 9.6 kg; 1 female, 6.8 kg), for a total of 12 studies. Initial animal preparation, performed under intramuscular ketamine anesthesia, consisted of insertion of intravenous catheters in each leg distally for injection of radiopharmaceutical and modulator, endotracheal intubation for administration of anesthesia, and insertion of a clamped indwelling bladder catheter to prevent spontaneous voiding during the study. Monkeys were positioned prone on the scanner couch, with the head in a stereotactic head holder, and placed under isoflurane anesthesia (1%–2%). The electrocardiogram, respiratory rate, rectal temperature, end tidal partial pressure of CO2, and partial pressure of O2 were monitored continuously. This study was approved by the National Institutes of Health Clinical Center Animal Care and Use Committee.
Dynamic 2-dimensional PET scans were performed on a General Electric Advance whole-body scanner (35 simultaneous slices; axial field of view, 15 cm). Reconstructed images had a transverse resolution of 6–7 mm and an axial slice width of 4–5 mm. During the study, the animal was successively moved axially in 15-cm increments to image the head, chest, abdomen, and pelvis and then moved back to the head to repeat the cycle. The monkey was imaged from the base of the snout to the midthigh. Transmission scans (for attenuation correction) were performed for all levels (head, chest, abdomen, pelvis), followed by 15O-water (370–740 MBq [10–20 mCi]) static emission scans for all levels (to provide perfusion images useful for anatomic localization). Dynamic emission scans of all levels were acquired for ∼4 h after the administration of FPAC (222–444 MBq [6–12 mCi]). The following frame durations were acquired for each level: 2 × 15 s, 4 × 30 s, 8 × 1 min, 8 × 4 min. Arterial blood sampling was performed via an indwelling arterial port with a 15-s sampling interval for the first 90 s, followed by a sequential decrease in sampling frequency over the 4-h scan period. For the modulator studies, 2 mg/kg of XR9576 (manufacturer-recommended dose for humans) was administered as an intravenous bolus ∼1 h before the FPAC injection.
To identify and quantify plasma FPAC metabolites, HPLC was performed on samples obtained at 0, 5, 20, 40, 80, 120, and 180 min after tracer infusion. Plasma samples were stored in ice for no more than 6 h before analysis. Plasma samples were treated with acetonitrile and a small amount of unlabeled paclitaxel standard and were centrifuged to precipitate proteins. The supernatant was analyzed for radioactive components using a gradient HPLC method. The column was a YMC Pro-Pack C-18 (Waters; 4.6 × 150 mm, 3 μm) with a SecurityGuard Cartridge (Phenomenex). The mobile phases were acetonitrile and 50 mmol/L NH4OAc. A linear gradient elution profile was used beginning from 100% NH4OAc to 35% NH4OAc over 10 min and then holding at 35% NH4OAc for an additional 12 min. The flow rate was 0.5 mL/min. The injected sample size was 100 μL. The eluate was monitored by ultraviolet absorbance at 230 nm and fractions of 1-min duration were collected for radioactivity counting in a calibrated γ-counter.
Radioactivity counting rates were decay corrected to the time of tracer injection for quantitation purposes. Chromatograms were created from the 22 collected samples at each time point and the percentage of parent radioactivity was determined by the peak area normalized to the total concentration in the chromatogram. The concentration of the various components was corrected for the time-varying efficiency of the acetonitrile recovery of plasma radioactivity. On the basis of the HPLC data, all plasma time–activity curves were corrected for metabolites by fitting the parent fraction over time to a continuous function.
Data Analysis
Frames from the sequence of FPAC dynamic scans for each scan level were decay corrected to the time of injection and summed to obtain composite images, providing images of early (0–12 min), intermediate (14–47 and 50–115 min), and late (120–240 min) biodistribution of tracer. Organ identification and region of interest (ROI) placement were facilitated by the use of a rotating 3-dimensional maximum intensity projection of the transverse slices of all levels for each summed composite FPAC image and from the 15O-water images. The ROIs were drawn on multiple transaxial images using the composite image on which each organ was best visualized. For solid organs, representative regions in homogeneous areas were drawn to minimize partial-volume effects from surrounding organs and obtain an adequate mean tracer concentration. ROIs for the hollow organs (gallbladder wall, urinary bladder wall, small intestine) were drawn to encompass all activity within the organ. The ROIs were then applied to the sequence of dynamic images to obtain time–activity curves.
Baseline and modulator biodistribution differences were determined by comparing the decay-corrected time–activity curves for the kidney, liver, vertebrae, muscle, lung, brain, and metabolite-corrected plasma at baseline with those after modulation. Pgp modulation should affect the efflux portion of the time–activity curve. On the basis of the initial data analysis, we used Logan graphical analysis, using metabolite-corrected plasma values. A plot of the integral of the organ radiotracer concentration to time t divided by the organ ROI concentration at time t versus the integral of the plasma concentration to time t divided by the organ ROI concentration at time t yields a curve that becomes linear for a reversible tracer. The slope of the linear portion of the curve represents the distribution volume (Vd) for the organ (23). Vd should be inversely proportional to the efflux of the tracer. We expected modulation to result in a decrease in FPAC efflux from an organ, which would be reflected as an increase in Vd.
We calculated the Logan plot slope of each organ in each study. All Logan plots were approaching linearity by 50 min, so slope estimates were made using data from 50 to 210 min. Because each monkey had 2 baseline and 2 modulator studies, the data were averaged to yield mean baseline and mean modulator organ slope values for each monkey. These mean slope values were averaged across all 3 monkeys to yield overall mean organ Logan plot slope values for baseline and modulator studies. The percentage change from baseline for these mean values was calculated (100 × [(modulator − baseline)/baseline]).
We also used 2 simplified methods of analysis. We calculated the area under the curve (AUC) from 2 to 210 min for each organ, normalized either to the injected dose per animal weight (ID normalized) or to the metabolite-corrected plasma AUC (plasma normalized). If MDR modulation decreased FPAC efflux, increased AUC values would be expected, although changes in whole-body clearance could affect these measurements as well. The first 2 min of dynamic imaging were discarded because not all organs had enough time points for a representative time–activity curve before 2 min, due to the cyclic dynamic scanning acquisition. Because the exact time of the final time point also varied, a 210-min cutoff was used to ensure equal temporal representation in the AUCs. Mean values and percentage changes were calculated as for the Logan plot slopes.
Paired baseline studies were performed to estimate variation of the baseline FPAC organ distribution; percentage differences in mean organ values were calculated ([second baseline value minus first baseline value]/[average of the baseline studies] × 100). This was done for both the Logan plot slopes and the normalized AUC values.
Radiation Dosimetry
Residence times were calculated for the brain, lungs, myocardium, heart chamber, liver, kidneys, muscle, vertebrae (red marrow), and spleen. The testes showed negligible uptake. The nondecay–corrected time–activity curves (kBq/cm3 [μCi/cm3]) were extrapolated to infinity by fitting the tail of each curve to a monoexponential and integrated, resulting in a concentration integral (CI; units of kBq-min/cm3 [μCi-min/cm3]) for each organ. The cumulated activity (Ã; units of kBq-min [μCi-min]) was calculated for each organ by multiplying the CI by the monkey organ weight divided by the organ density (International Commission on Radiological Protection [ICRP] Publication 23) (24). The residence time (τ) was calculated by dividing by the ID. The monkey τ values were then scaled to Reference Man (25,26).
The 4-h cumulative activity for the small intestine was divided by the ID and by the 4-h τ for 18F (123.7 min) to calculate the fraction of the ID entering the small intestine. Occasionally there was some regurgitation of tracer from the small intestine into the stomach. In these cases, the activity of the stomach was added to that in the small intestine. The ICRP Publication 30 (27) gastrointestinal tract model in MIRDOSE3.1 uses this fraction to calculate τ values for the small intestine, upper large intestine, and the lower large intestine.
For the gallbladder, ROIs were drawn to encompass the entire organ activity; therefore, partial-volume averaging from adjacent liver was unavoidable. To correct for this, a fraction of the liver CI was subtracted from the gallbladder contents CI. This fraction was the mean activity concentration in the gallbladder ROI in the early images (before biliary excretion; hence, all apparent activity must be from the liver) divided by the mean liver concentration during these early frames. At ∼4 h, the gallbladder had not significantly emptied, there was no further filling, and the liver activity had significantly cleared. The urinary bladder activity was negligible.
The τ for the remainder was obtained by multiplying the sum of the τ values of the organs analyzed from the maximum τ for an 18F-labeled tracer, 2.64 h (i.e., 1.44 × half-life). Radiation-absorbed doses were calculated with MIRDOSE3.1, from the τ values, extrapolated to humans, assuming gallbladder emptying into the small intestine at 4 h with no subsequent filling. Because each monkey had 2 baseline studies, the mean τ values (total of 6 studies) were used.
Statistical Analysis
A 2-tailed, paired Student t test was applied to mean Logan plot slope values and the mean AUC values (ID normalized or plasma normalized) for the 3 monkeys with and without modulator administration.
RESULTS
FPAC Metabolism
The mean parent fraction in the plasma, based on HPLC analysis both at baseline and after modulation, is shown in Figure 1. For 2 studies, on 2 different animals, the HPLC data were discarded because of technical difficulties. Both were baseline studies and the parent fraction curve from each animal’s other baseline study was applied to correct the plasma curves for metabolism. The parent compound represented >50% of the plasma radioactivity for the first 2 h. We found 2 metabolites, of approximately equal fractions, in the plasma of all 3 monkeys, with a small amount of a third metabolite present only in the studies of the 1 female monkey. A small increase in the parent fraction after MDR modulation is seen (P < 0.001; paired Student t test for HPLC values at sample times). There was no apparent change in the ratio of the 2 primary metabolites.
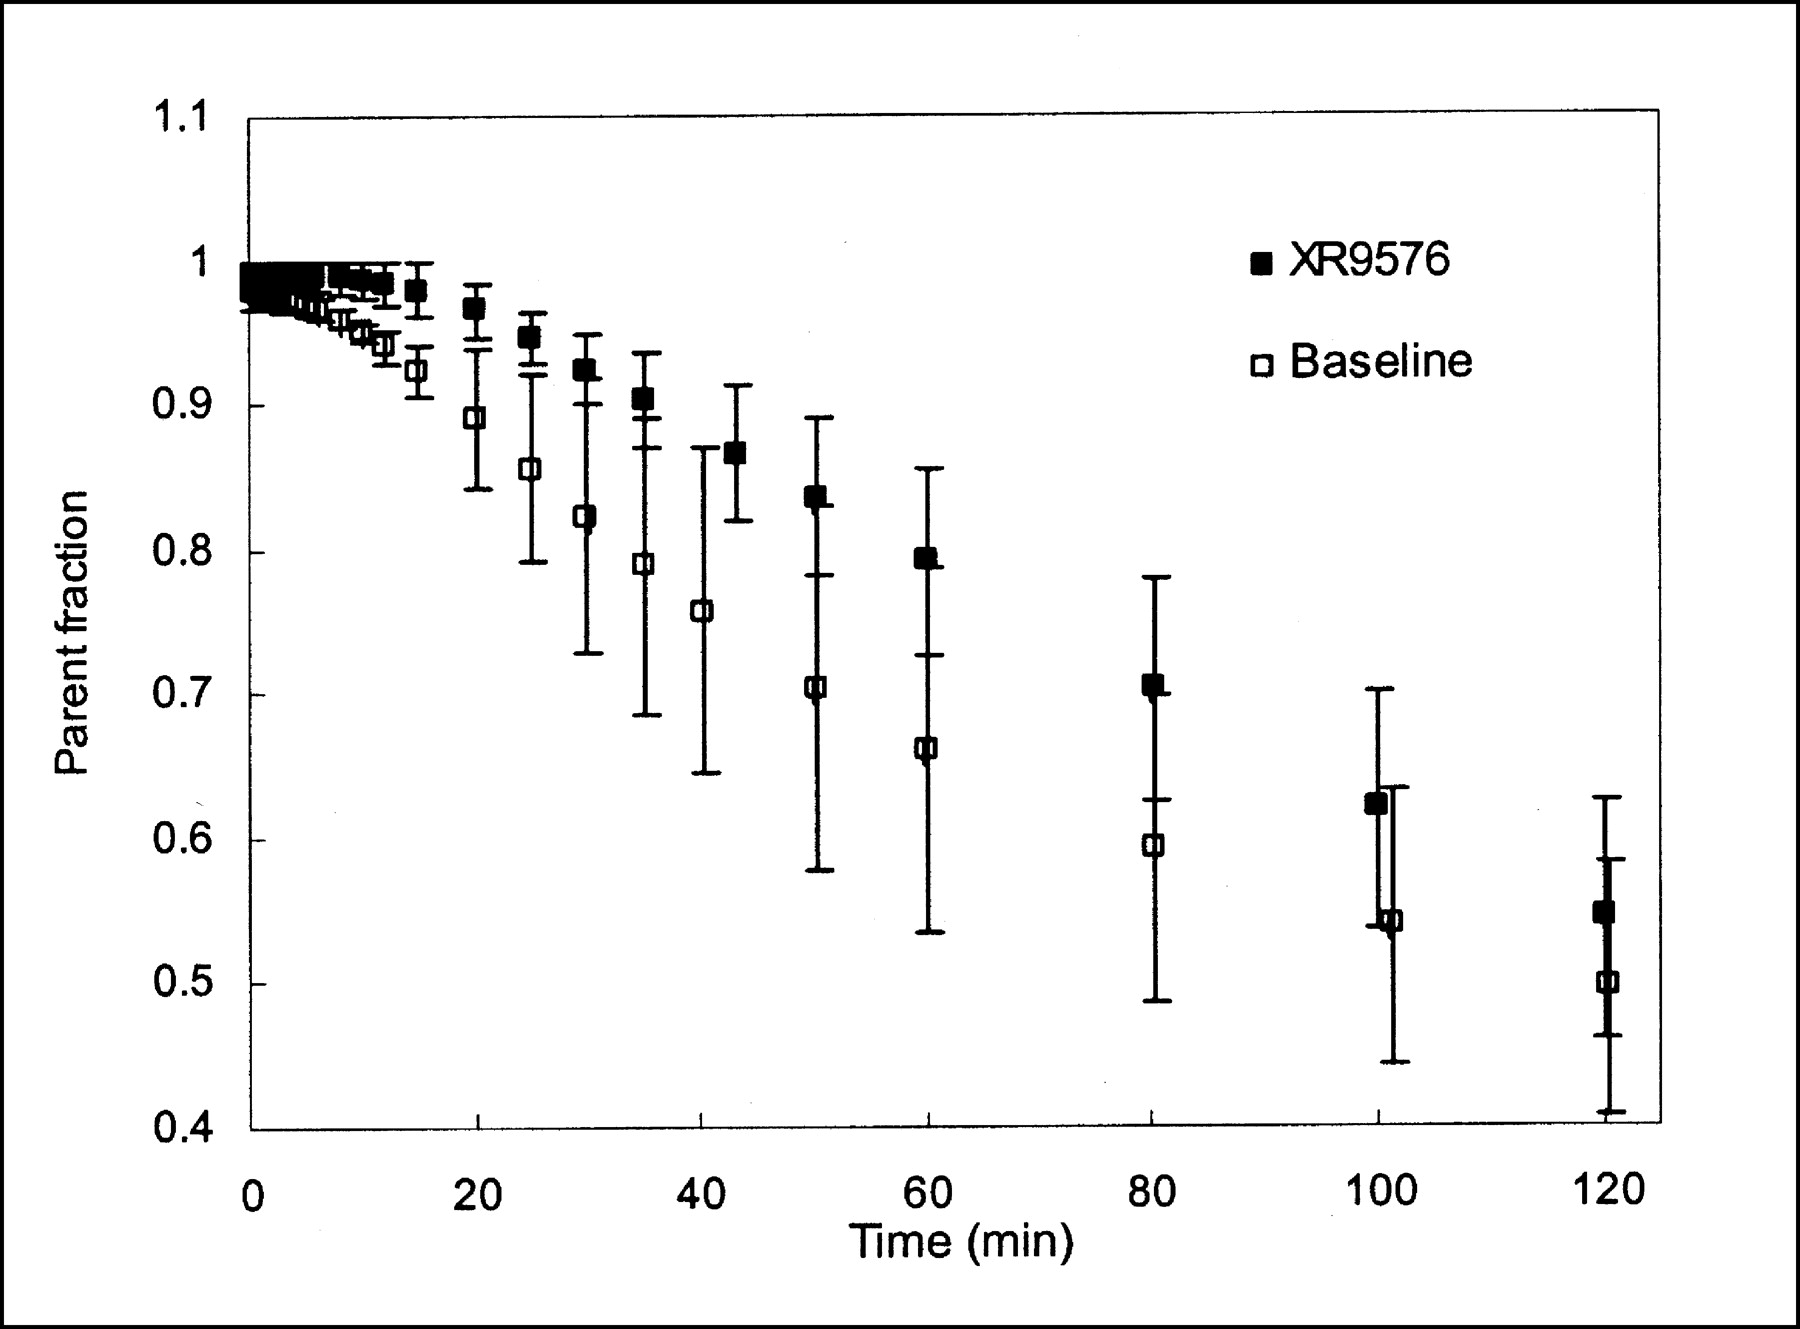
Mean parent (FPAC) fraction of total activity in plasma, based on HPLC analysis. Two metabolites of approximately equal fractions were found. Decrease in metabolite fraction (i.e., increase in parent fraction) is noted after MDR modulator administration. Error bars represent 1 SD (n = 3).
Baseline Biodistribution and Reproducibility
Baseline biodistribution maximum intensity projection images of FPAC and a corresponding 15O-water whole-body image for anatomic reference are shown in Figure 2. There is mainly hepatobiliary excretion, with 75% of the ID distributing to the gallbladder contents, liver, and gastrointestinal tract. There was no visual difference in biodistribution in the summed XR9576 modulator images (not shown) compared with baseline studies.

Maximum intensity projections of early (0–12 min) FPAC distribution show prominent hepatobiliary accumulation of tracer (A) and of late (120–240 min) FPAC distribution show intense accumulation in gallbladder with excretion into bowel, the primary route of elimination (B). (C) 15O-Water distribution for anatomic correlation.
The percentage differences between the paired baseline measures for each organ, for the Logan plot slope, and for the AUCs (ID normalized and plasma normalized) are listed in Table 1. They provide an estimate of the baseline intraanimal variability for these analysis methods.
Percentage Change Between Paired Baseline Studies
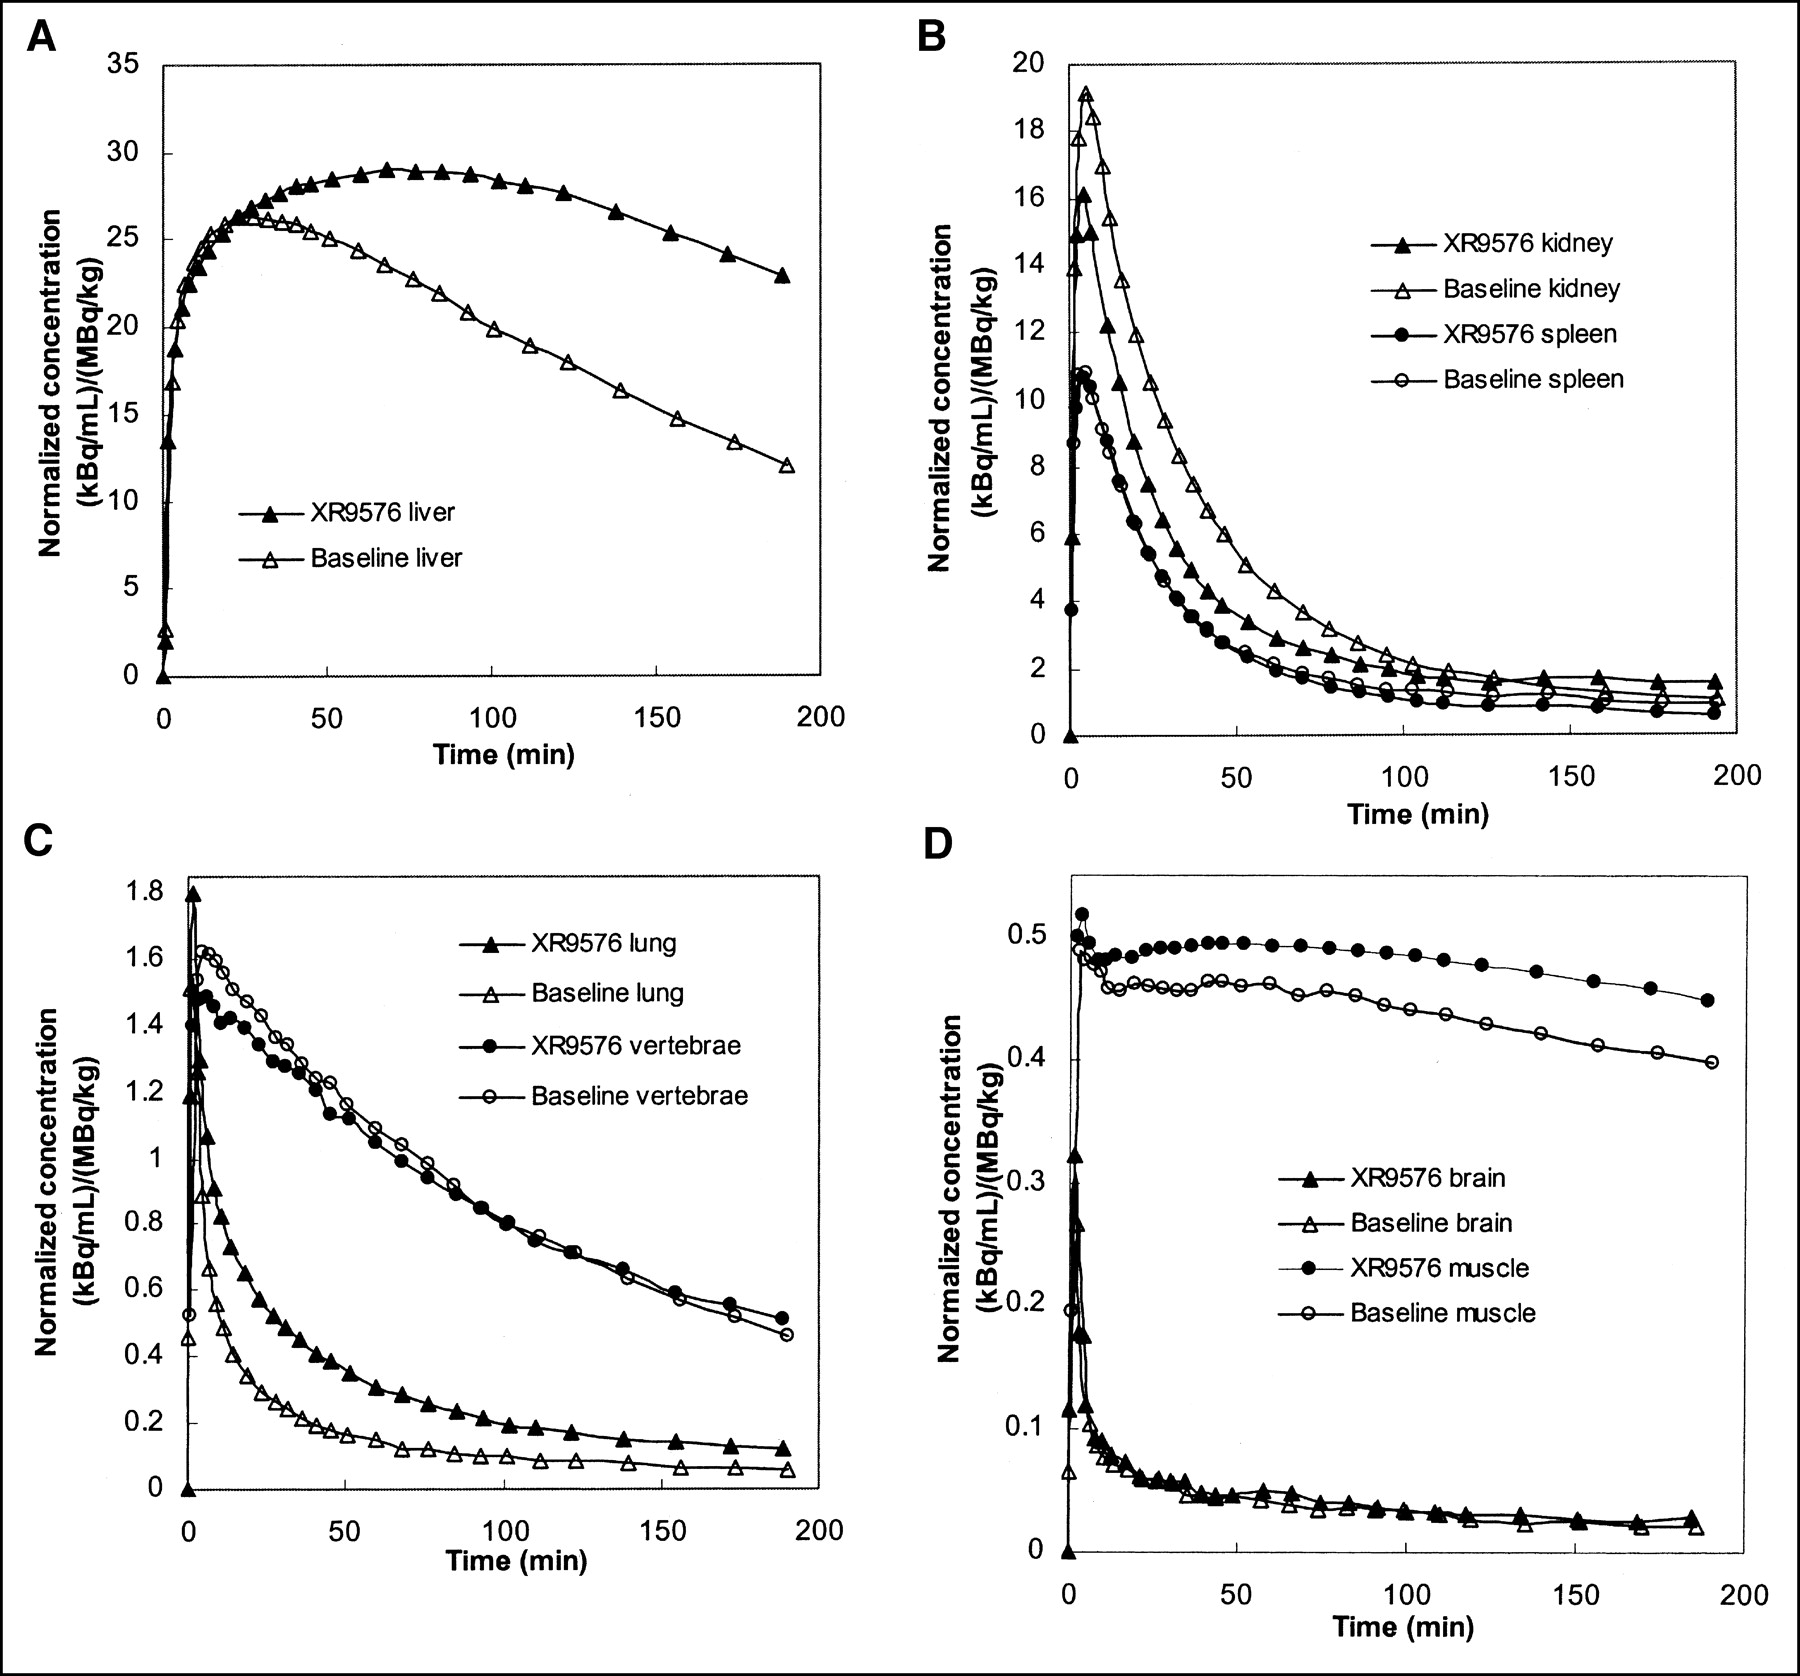
Mean organ time–activity curves are presented in Figure 3A–D. There was a prolonged retention of FPAC in the liver (Fig. 3A) after XR9576 infusion. Some increased retention is seen in the lung time–activity curve (Fig. 3C) as well. Although the post-XR9576 time–activity curves for the vertebral bodies and muscle are slightly higher than the baseline time–activity curves, the shapes of the efflux portions are similar. The efflux portion of the postmodulator kidney time–activity curve is slightly lower than the baseline time–activity curve. Uptake in the brain was very low and appeared unchanged after XR9576. Measured brain uptake was not corrected for blood radioactivity.

Mean organ FPAC time–activity curves (before and after modulation with XR9576) averaged over all monkeys normalized to ID per weight. (A) Liver: Note large difference between curves before and after modulation. (B) Kidney and spleen. (C) Lung and vertebrae. (D) Brain and muscle.
Logan plots before and after modulation are presented in Figure 4. The kidney and spleen plots were linear from the first point (2 min), the lung became linear by 5–10 min, the vertebrae by ∼15 min, and the muscle by ∼20–30 min. The liver plots tended to become linear later, at ∼50 min. The slope values and the percentage differences between values before and after modulation are listed in Table 2. Results for the brain are not presented because of substantial noise in the data due to low tracer uptake. The mean Logan plot slope for the liver increased by 104% (P = 0.02; percentage difference between repeated baseline studies, −5%) and for the lung by 87% (P = 0.11; percentage difference between repeated baseline studies, −15%). The mean for the kidneys decreased by 14% (P = 0.08; percentage difference between repeated baseline studies, 6%).

Logan plots for FPAC kinetics from representative monkey’s baseline and post-XR9576 modulator studies. Data points are integral of organ concentration to time t divided by organ ROI concentration at time t plotted vs. integral of plasma concentration to time t divided by organ ROI concentration at time t. Slope of Logan plot estimates Vd of FPAC. Solid lines are linear fit from 50 to 210 min. (A) Liver: Note scale difference for liver plot. (B) Kidney and spleen. (C) Lung and vertebrae. (D) Muscle.
Percentage Difference in Logan Plot Slope Values Between Baseline and Modulator (XR9576) Studies
The percentage differences using the simplified data analysis methods, organ AUC normalized to ID per weight or plasma AUC, are presented in Table 3. A similar pattern of results was seen compared with the Logan plot slopes. There was an increase in AUC for the liver by both methods, with the ID-normalized data reaching statistical significance (47% increase, P = 0.037; percentage difference between repeated baseline studies, 20%). A significant increase in the lung AUC was found for both the ID and the plasma normalizations. The small decrease in kidney AUC reached significance for the plasma-normalized values (−12%, P = 0.023; percentage difference between repeated baseline studies, −5%). No significant difference was found in the ID-normalized plasma AUC between the baseline and XR9576 modulator studies (P = 0.69).
Percentage Differences in Organ AUC Between Baseline and Modulator (XR9576) Studies
Radiation Dosimetry
The sum of the cumulative organ activities (used for the dosimetry calculation) accounted for 80% of the ID. Activity measured from ROIs encompassing the whole body accounted for 95% of the ID (distal lower limbs were not imaged).
The radiation dosimetry values are listed in Table 4. Assuming gallbladder emptying at 4 h, the gallbladder wall received the highest dose (0.19 mGy/MBq [0.69 rad/mCi]), and the liver and upper large intestine wall received 0.14 mGy/MBq (0.52 rad/mCi) and 0.094 mGy/MBq (0.35 rad/mCi), respectively. The effective dose (ED) was manually calculated according to ICRP Publication 80 (28) because the gallbladder wall has no assigned weighting factor. The ED is 0.022 mSv/MBq (0.083 rem/mCi).
MIRDOSE 3.1 Organ Doses Based on Mean τ from 3 Monkeys Assuming Complete Gallbladder Emptying at 4 Hours
DISCUSSION
The baseline biodistribution showed high accumulation in the hepatobilliary system and bowel, the primary excretion route, which may confound imaging tumors within the liver and proximal bowel. Radiation dosimetry calculations show that 266 MBq (7.2 mCi) FPAC can be administered to humans up to 3 times per year under current Radioactive Drug Research Committee guidelines.
Analysis of the replicate baseline values for each organ (Table 1) showed that, for several measures, the percentage changes between repeated studies were not small. There is less overall variability in the Logan parameters than in the AUC parameters. The changes brought about after modulator administration in the liver and lungs were substantially larger, however, than the changes seen for the paired baseline studies (Tables 2 and 3).
In the absence of a Pgp modulator, rapid efflux of tracer is expected in tissues containing the Pgp membrane pump. With the addition of a modulator, this efflux is expected to decrease. We analyzed changes of Pgp function in normal tissues after administration of XR9576, using the Logan graphical method. The Logan method assumes no predefined model and was developed for analysis of reversible radiotracers (29). For FPAC, the reversible component is attributed to the function of the Pgp pump. The slope of the Logan plot estimates the tissue Vd of FPAC and an increase in this slope represents a decrease in FPAC efflux.
There was a significant increase in the Logan plot slope in the liver after modulation. The rhesus monkey liver is known to contain Pgp (30), and a decrease in FPAC efflux was expected. We also found a large increase in the Logan plot slope for the lung, but it did not reach statistical significance. Although the bronchial cells of the human lung express Pgp (31), the level is less than that found in the liver (32,33), and, because the lungs are filled with air, the density of Pgp would be expected to be less in the lung.
A small nonsignificant decrease in Logan plot slope was found in the kidney. Although Pgp is expressed in the monkey kidney (34), the relative amount and overall biodistribution in these animals is not known. Assuming the Pgp biodistribution in monkeys to be similar to that of humans, this finding of a decreased renal slope is not expected. The distribution of Pgp in the human kidney is in the proximal tubules, where it is believed to transport toxins from the blood into the urine. We expected the Pgp pump to be blocked, as in the liver, resulting in increased FPAC retention. Although a decrease in efflux should cause an increase in the tissue Vd, it is also sensitive to tracer delivery, so reductions in kidney efflux could be masked by decreased delivery. We found no significant change in the metabolite-corrected plasma AUC of FPAC (Table 3) to suggest decreased amounts of FPAC being presented to the kidney after XR9576. The amount of tracer found in the urine was minimal in all studies. It is likely that other mechanisms also affect the efflux of FPAC from the kidney. The fact that changes in the Logan plot slopes of the kidney as well as the lung did not reach statistical significance may be due to the small number of animals in this study.
We also analyzed the organ time–activity curves by simpler methods. We calculated the AUC for each organ and normalized it to the metabolite-corrected plasma AUC. Although this method does not account for the dynamics of the tissue uptake and input function curves, it does account for differences in the total amount of FPAC seen by tissues during the entire study. Using this method, large increases in AUC with modulation were found in the liver and lung, but only the lung values reached statistical significance. The kidney showed a small but significant decrease in plasma-normalized AUC.
We then performed a further simplification by normalizing the organ AUCs to the ID divided by the monkey weight. This method does not take the plasma input function into consideration. Any changes in the amount of FPAC available to the tissues—for example, due to changes in protein binding, organ redistribution of FPAC due to Pgp pump function, or dose infiltration—are not considered. In our studies, FPAC remained >99% protein bound (data not shown), and there were no incidents of significant dose infiltration; although changes in organ distribution occurred, there were no significant changes in the plasma AUC between the baseline and modulator studies. Using this method, we found large significant increases in the AUC for both the lung and the liver as well as a small significant decrease in kidney AUC, after Pgp modulation.
Although not all methods showed statistically significant changes in the liver, lung, and kidney after modulation, there was overall consistency of the findings—increased retention of FPAC in the liver and lung and a small increase in the efflux rate of FPAC in the kidney. Good agreement between these measures is not surprising. The Logan plot slope estimates the total distribution volume, which is equal to the ratio of the integrals to infinity of tissue to that in plasma. Thus, there will be good agreement with the plasma-normalized AUC, which is an integral to 210 min. The largest discrepancy was in the liver, where the tissue time–activity curve (Fig. 3A) has not yet reached low concentrations by 210 min, so that the integral to 210 min was a poor estimate of the integral to infinity. For the tissue AUC normalized to the ID per animal weight, the ID serves as an approximation of the plasma integral to infinity. Because these measures have slightly different sources of error, it is not surprising that statistical significance was achieved in some methods and not others, given the small number of animals in our study.
Although further study of FPAC is needed, we have shown in this small study that it can detect changes in organ distribution after MDR modulation. Other PET tracers for MDR are under investigation. 11C-Verapamil, a radiolabeled first-generation MDR modulator and a Pgp substrate, has been used as a PET MDR imaging agent in mdr1a(−/−) knockout mice. After treatment with cyclosporin A, another first-generation modulator, there was complete blocking of Pgp pump function in the blood–testicular and blood–brain barriers (35). In rats bearing small cell lung tumors, 11C-verapamil PET demonstrated successful modulation by cyclosporin A (36). 11C-Colchicine, similar to FPAC in that it is a radiolabeled neutral tubulin-binding agent, has also been used to image MDR. Uptake of 11C-colchicine was shown to correlate with paclitaxel sensitivity in both in vitro studies and in vivo rat studies (37).
More recently, 11C-paclitaxel has been synthesized (38). The 20.4-min physical half-life of 11C may limit the usefulness of 11C-labeled MDR tracers, particularly as our study shows the difference between liver time–activity curves before and after modulation to be greater with time (at 20 min, the postmodulator liver activity was increased 22% over baseline, whereas at 200 min, it was increased 145% over baseline). Although 11C-verapamil has been shown to have a 23.4-min biologic half-life in tumors in 1 small group of patients (39), changes after MDR modulation may not be evident until much later. The longer physical half-life of 18F will permit imaging of more slowly changing physiologic phenomena.
One possible drawback in using FPAC is the formation of radiolabeled metabolites. Paclitaxel is metabolized by the p450 system in humans and eliminated primarily through the bile (40). The major metabolite in humans is 6α-hydroxytaxol (CYP2A6 enzyme) with 3′-(4-hydroxyphenyl)taxol (CYP3A) as a minor metabolite. Significant interindividual variability has been reported in the levels of these metabolites (41). Neither of these compounds is reported to be a Pgp substrate. We identified 2 major metabolites in all monkeys. With the preadministration of XR9576, we found a small decrease in the total plasma metabolite fraction (Fig. 1) with no change in the ratio of the 2 metabolites. Co-administration of other drugs has been shown to alter the metabolism of paclitaxel in humans. The modulator R-verapamil has been shown to inhibit the formation of both metabolites in humans and the cytotoxin doxorubicin has been shown to inhibit formation of 3′-(4-hydroxyphenyl)paclitaxel (41). We found a small decrease in metabolite formation after XR9576 administration in vivo in nonhuman primates, which may be due to a similar form of inhibition; however, it is not likely to be clinically significant. The parent fraction in plasma decreased with time for both baseline and modulator studies (at ∼150 min it is ∼45% for both). It is not known if either metabolite is accumulated in different organs. Uptake of FPAC metabolites could confound the organ time–activity curves, particularly if the uptake of the parent (FPAC) is low. In our analysis, we assumed that the activity measured in the ROIs represented FPAC accumulation alone. Our assumption is that the changes in FPAC distribution after modulation are due to changes in Pgp pump function. It is possible that in the liver, binding to p450 is also a factor; however, because the amount of metabolites decreased with modulation, correcting for metabolites would increase the percentage changes found after modulation (more p450 binding or metabolism would be expected at baseline). However, the trends in our results persisted for all analysis methods used, despite the fact that the ID-normalized time–activity curves made no correction for metabolites. Thus, the potential uptake of any radiolabeled metabolites did not interfere with the ability of FPAC to detect modulator action.
CONCLUSION
We have developed FPAC, a PET agent for evaluating MDR in vivo. We were able to detect changes in the organ distribution of FPAC in rhesus monkeys after the administration of the specific Pgp inhibitor XR9576. This indicates that FPAC uptake is sensitive to the Pgp function of the tissue. We believe that FPAC will be useful to assess Pgp function in vivo and to study of the effect of modulators of MDR function on tumor uptake of paclitaxel and possibly other Pgp substrates.
Acknowledgments
We gratefully acknowledge the excellent work of the National Institutes of Health PET Department technical staff and John Bacher, DVM. We also thank Susan Bates, MD, of the National Cancer Institute and Xenova Ltd. for providing the modulator XR9576.
Footnotes
Received Dec. 23, 2002; revision accepted Apr. 21, 2003.
For correspondence contact: Karen A. Kurdziel, MD, Department of Radiology, Virginia Commonwealth University, P.O. Box 980001, Richmond, VA 23298.
E-mail: kurdziel{at}hsc.vcu.edu
REFERENCES
In this issue


Jump to section
Related Articles
Cited By...
- Impact of P-Glycoprotein-Mediated Active Efflux on Drug Distribution into Lumbar Cerebrospinal Fluid in Nonhuman Primates
- In Vivo Imaging as a Pharmacodynamic Marker
- Behavioral Effects and Central Nervous System Levels of the Broadly Available {kappa}-Agonist Hallucinogen Salvinorin A Are Affected by P-Glycoprotein Modulation In Vivo
- Human Dosimetry and Preliminary Tumor Distribution of 18F-Fluoropaclitaxel in Healthy Volunteers and Newly Diagnosed Breast Cancer Patients Using PET/CT
- P-Glycoprotein Function at the Blood-Brain Barrier in Humans Can Be Quantified with the Substrate Radiotracer 11C-N-Desmethyl-Loperamide
- Human Brain Imaging and Radiation Dosimetry of 11C-N-Desmethyl-Loperamide, a PET Radiotracer to Measure the Function of P-Glycoprotein
- 11C-Loperamide and Its N-Desmethyl Radiometabolite Are Avid Substrates for Brain Permeability-Glycoprotein Efflux
- Application of PET/CT in the Development of Novel Anticancer Drugs
- Tumor-Specific Positron Emission Tomography Imaging in Patients: [18F] Fluorodeoxyglucose and Beyond
- Predicting Chemotherapy Response to Paclitaxel with 18F-Fluoropaclitaxel and PET
- PET Imaging of Response and Resistance to Cancer Treatment
- Estimation of Paclitaxel Biodistribution and Uptake in Human-Derived Xenografts In Vivo with 18F-Fluoropaclitaxel
- Characterization of a 67Ga/68Ga Radiopharmaceutical for SPECT and PET of MDR1 P-Glycoprotein Transport Activity In Vivo: Validation in Multidrug-Resistant Tumors and at the Blood-Brain Barrier