


Abstract
Nonuniform attenuation, scatter, and distance-dependent resolution are confounding factors inherent in SPECT imaging. Iterative reconstruction algorithms permit modeling and compensation of these degradations. We investigated through human-observer receiver-operating-characteristic (ROC) studies which (if any) combination of such compensation strategies best improves the accuracy of detection of coronary artery disease (CAD) when expert readers have only stress images for diagnosis. Methods: A 3-headed SPECT system fitted with a 153Gd line source was used to acquire simultaneously 99mTc-methoxyisobutylisonitrile (MIBI) images and transmission data. With these acquisitions, the accuracy of detecting CAD was evaluated for the following reconstruction strategies: filtered backprojection (FBP); ordered-subset expectation maximization (OSEM) with attenuation correction (AC); OSEM with AC and scatter correction (SC) (AC + SC); and OSEM with AC, SC, and resolution compensation (RC) (AC + SC + RC). Reconstruction parameters for OSEM were optimized by use of human-observer ROC studies with hybrid images, whereas standard clinical parameters were used for FBP. A total of 100 patients, including 55 patients referred for angiography and 45 patients with <5% likelihood for CAD, were included in the ROC studies. Images reconstructed with the 4 methods were rated independently with regard to the presence of CAD by 7 observers using a continuous scale for certainty. Results: With area under the ROC curve (Az) as the criterion, the iterative reconstructions with compensation strategies (AC, AC + SC, and AC + SC + RC) demonstrated better detection accuracy than did FBP reconstructions for the overall detection of CAD as well as for the localization of perfusion defects in the 3 vascular territories. In general, the trend was for an increase in the Az for the progression from FBP to OSEM with AC, to OSEM with AC + SC, and to OSEM with AC + SC + RC. Statistically, the combination strategy with AC + SC + RC provided significantly higher Az values than did FBP images for the overall detection of CAD and the localization of perfusion defects in the left anterior descending coronary artery and left circumflex coronary artery territories, whereas AC + SC provided significantly better performance in the right coronary artery territory. Conclusion: The results indicate that OSEM with AC + SC + RC outperforms FBP reconstructions, indicating that the modeling of physical degradations can improve the accuracy of detection of CAD with cardiac perfusion SPECT reconstructions.
- cardiac SPECT
- attenuation compensation
- scatter compensation
- ordered-subset expectation maximization
- transmission imaging
Nonuniform attenuation, scatter, and distance-dependent resolution (DDR) represent a few of the confounding factors inherent in SPECT imaging. It has been hypothesized that these image degradations increase false-positive rates in the detection of perfusion defects in myocardial SPECT imaging (1,2). Iterative reconstruction algorithms permit modeling and compensation of these degradations. On the basis of the physics of imaging (3), it was our hypothesis that combining compensation strategies for attenuation, scatter, and spatial resolution would provide a larger improvement in diagnostic accuracy for coronary artery disease (CAD) than would correcting solely for attenuation. In this study, we investigated which (if any) combination of compensation strategies results in the best accuracy of detection of CAD on clinical images.
Several investigators have implemented some of these correction strategies in myocardial SPECT, with mixed success (4–8). Using a 3-headed camera system fitted with a 241Am line source, Ficaro et al. (4) showed a significant improvement in diagnostic accuracy with 99mTc images by implementing nonuniform attenuation correction (AC). In a recent multicenter trial conducted by Links et al. (5), it was shown that with AC, resolution compensation (RC), and motion correction, significant improvements in specificity for the overall detection of CAD as well as for the localization of defects in the 3 arterial territories were obtained. Another multicenter trial, conducted by Hendel et al. (6), indicated no significant improvement in detection accuracy with AC and scatter correction (SC) over that obtained with uncorrected images. However, significant improvements in normalcy rates and specificity measures were noted. Kluge et al. (7) showed that 99mTc-tetrofosmin images demonstrated increased relative count densities in the inferoposterior and septal segments after AC, resulting in detection accuracy for the territory supplied by the right coronary artery (RCA) that was significantly higher than that obtained with uncorrected images. Implementing AC with 201Tl images, Vidal et al. (8) showed that, whereas there was an improvement in detection performance for the RCA, there was a significant decrease in detection performance for the left anterior descending coronary artery (LAD) territory.
The different findings regarding the impact of image correction on CAD detection accuracy in these studies likely reflect differences in hardware, image acquisition, reconstruction methods, quality control protocols, and patient populations, among others (1). A recent joint position statement by the Society of Nuclear Medicine and the American Society of Nuclear Cardiology (2) recommended the use of nonuniform AC performed with clinically validated hardware and software and with appropriate quality control tools. In this study, we acquired 99mTc-sestamibi cardiac SPECT images with simultaneous transmission data on a 3-headed camera to investigate through human-observer receiver-operating-characteristic (ROC) studies which (if any) combination of attenuation, scatter, and DDR compensation strategies best improves the accuracy of detection of CAD when expert readers have only stress images on which to base a diagnosis.
MATERIALS AND METHODS
Patients
Image sets from 100 patients who underwent 99mTc-sestamibi stress studies were used in this ROC investigation. Fifty-five of these patients (11 women and 44 men) underwent cardiac catheterization. A patient was classified as not healthy when at least 1 of the 3 major coronary artery territories had a 50% or greater narrowing in luminal diameter, as determined by angiography. Of the 55 patients who underwent catheterization, 8 were classified as healthy, 15 had single-vessel disease, 19 had double-vessel disease, and 13 had triple-vessel disease. The distribution of the abnormal territories was as follows: 29 abnormal LAD, 28 abnormal left circumflex coronary (LCx), and 35 abnormal RCA territories. The remaining 45 patients (21 women and 24 men) with <5% likelihood for CAD (9) were classified as healthy. All patients underwent either physical stress testing according to the Bruce protocol or pharmacologic stress (dipyridamole) testing. Informed consent was obtained from all patients for use of their data.
Data Acquisition
Clinical stress studies acquired on our PRISM 3000XP 3-headed SPECT system (Philips Medical Systems) were used in these ROC investigations. For the simultaneous acquisition protocol used, 2 low-energy, high-resolution parallel-hole collimators acquired 99mTc emission projections, and head 3, fitted with a 65-cm focal-length fanbeam collimator opposed to a 153Gd line source, acquired transmission data. The activity of the 153Gd line source varied between 8,880 MBq (240 mCi) and 3,108 MBq (84 mCi) during the year of use. Three interchangeable tungsten filters varying in thickness from 0.10 to 0.025 cm were used to compensate approximately for the radioactive decay of the line source, thereby decreasing the variation in source intensity during the year of use.
Three energy windows were used to acquire emission data on heads 1 and 2, which had the parallel-hole collimators. These windows were a 99mTc photopeak window centered at 140 keV with a 15% width, a large 99mTc Compton scatter window centered at 106 keV with a 25% width for determining the body outline for use in constraining the fanbeam transmission reconstructions (10,11), and a window centered at 123 keV with a 4% width for performing triple-energy-window (TEW) SC (12) of the 99mTc photopeak data. Head 3, which had the fanbeam collimator, acquired 4 energy windows, 3 for transmission imaging and 1 for emission imaging. The transmission windows consisted of a 153Gd photopeak window centered at 100.8 keV with a 15% width and 2 scatter windows centered at 123 keV with a 4% width and 84 keV with a 6% width for performing TEW correction (13) of the 153Gd transmission photopeak data. The emission window was a 99mTc photopeak window centered at 140 keV with a 15% width. Data from this window were not used for the research reported in the article. All projections were acquired on a 64 × 64 matrix with a pixel size of 0.634 cm resulting from the use of a magnification of 1.123. Acquisition was done for 60 angles covering a circular 360° acquisition orbit in a step-and-shoot mode with an acquisition time of 16 s per frame.
Image Reconstruction
The transmission projections were corrected for resolving-time errors. Resolving-time correction was done with a paralyzable model and a resolving time measured by use of the paired-source method of Adams et al. (14). The total number of counts per second for the acquired frame was input into the model as the observed-frame counting rate, and the true-frame counting rate was solved for by use of the Newton-Raphson method (15). Each pixel count in the frame was corrected for count loss by multiplication by the ratio of the estimated true frame-counting rate to the observed frame-counting rate. The 99mTc cross talk in the 153Gd transmission projection data was estimated by use of the TEW method of Ogawa et al. (12). The attenuation maps were reconstructed by use of 30 iterations of the maximum-likelihood transmission gradient algorithm with a gamma prior. The filtered TEW down-scatter estimate (Butterworth filter of order 4 and a cutoff frequency of 0.15 cycle per second) was explicitly modeled in the reconstruction algorithm (13), avoiding a preliminary scatter subtraction step. To reduce the effects of truncation, the patient body outline (estimated from Compton-scattered 99mTc projection data) was used as prior support, reconstructing only pixels confined within the outline (10,11). Finally, the reconstructed 153Gd attenuation maps were scaled from 153Gd to 99mTc before emission reconstruction.
Four different reconstruction strategies were considered for evaluation: filtered backprojection (FBP), ordered-subset expectation maximization (OSEM) (16) with AC alone, OSEM with AC and SC (AC + SC), and OSEM with AC, SC, and RC (AC + SC + RC). FBP reconstructions of the 99mTc emission images were implemented with a ramp filter after the projections were prefiltered with a 2-dimensional (2D) Butterworth filter of order 5 and a cutoff frequency of 0.25 cycle per pixel, as used clinically (17). Reconstruction was done over 180° from right anterior oblique to left posterior oblique.
For OSEM reconstructions, we used 15 subsets (4 angles per subset) and corrected the 99mTc projections for resolving-time errors and radioisotope decay before the 360° reconstruction was done. The number of iterations of OSEM and the SD for the postreconstruction 3-dimensional (3D) gaussian filter applied to the slices were selected as those that resulted in the largest area under the ROC curve (Az) in human-observer ROC studies conducted with hybrid images (18,19). Reconstructions with AC were implemented by use of 1 iteration of OSEM followed by application of a postreconstruction 3D gaussian filter with an SD of 0.75 pixel. The scatter component was estimated by use of the TEW method (12) and prefiltered with a Butterworth filter of order 4 and a cutoff frequency of 0.2 cycle per pixel (20). Reconstructions with AC + SC were implemented by use of 1 iteration of OSEM followed by application of a postreconstruction 3D gaussian filter with an SD of 0.75 pixel. As noted earlier for the transmission reconstructions, the scatter component was again included in the projection-backprojection step of iterative reconstructions (20,21).
Finally, the emission images were reconstructed with all 3 corrections (i.e., AC, SC, and RC) by use of 5 iterations of OSEM followed by application of a postreconstruction 3D gaussian filter with an SD of 0.75 pixel. The importance of accurate 3D combined correction for these degradations on the basis of image-quality metrics was demonstrated previously (22–24). In this study, DDR was modeled in the projection-backprojection step with gaussian diffusion (25,26). This strategy provides an efficient method for incorporating a model of the system spatial resolution as a distance-dependent 2D gaussian function. In this study, the full width at half maximum in the axial and transaxial directions for the PRISM 3000XP with low-energy, high-resolution collimators was measured as a function of distance from the acquisitions of point sources. These measured values were fitted by linear regression and used to model the change in full width at half maximum as a function of distance from the collimator face. Such modeling has been shown to improve 3D spatial resolution (27) and to provide improved quality of simulated cardiac images, as judged by image-based metrics (28,29). It has been shown that this form of RC does degrade cardiac wall count uniformity compared with the results obtained when AC alone is used, unless heavy postreconstruction 3D gaussian filtering is applied, thus raising a question as to its clinical utility for cardiac imaging (29). Gifford et al. previously showed that RC with gaussian diffusion results in an improvement in lesion detection accuracy in human-observer localization-ROC studies with simulated 67Ga images (30); however, the ability of this technique to improve the detection of perfusion defects in cardiac imaging has not been investigated. Thus, in this study we compared OSEM with AC + SC to OSEM with AC + SC + RC to determine whether this form of 3D compensation for DDR increases CAD detection accuracy on clinical images.
ROC Comparison
We used a total of 7 observers in this ROC investigation. Three were attending nuclear cardiologists, and the remaining 4 were cardiology fellows. This grouping of observers enabled the evaluation of any differences in observer performance that might arise because of differences in the extent of observer experience.
Because inadequate training can have a significant impact on observer performance (1), this investigation was designed to provide the observers with training in each of the reconstruction strategies before the actual ROC investigation. It is important to note that the patient images used in all of the training sessions were distinct from the 100 images used in the actual evaluation. The additional patient studies were selected from our database of clinical studies, from which those used for the ROC investigation were drawn. However, in the training studies, neither catheterization nor fulfillment of the criteria necessary for the studies to have a low likelihood for CAD was available, because all such studies were saved for the ROC investigation. Thus, the “truth” with regard to the presence or absence of CAD for the training studies was taken to be the recorded clinical interpretation based on criteria such as the evaluation of rest and stress FBP perfusion images, raw projection data, polar maps, wall motion assessment, and clinical presentation at the time of imaging. Only studies that were clearly abnormal or normal were used for training, and the observer scores were used only by the observers themselves in developing their criteria for judging confidence regarding the presence of CAD.
Training was conducted in 3 phases. In the first phase, the investigators provided the observers with the review article of Corbett and Ficaro (1) and discussed the relevant issues raised in this article regarding variations in the appearance of normal studies with compensation. Next, they reviewed with the observers the average polar maps from normal studies processed by the various strategies (31) and pointed out variations that might be expected from FBP reconstructions. Next, the observers were brought to the ROC reading area and instructed in the operation of the graphical user interface (GUI) to be used (Fig. 1).
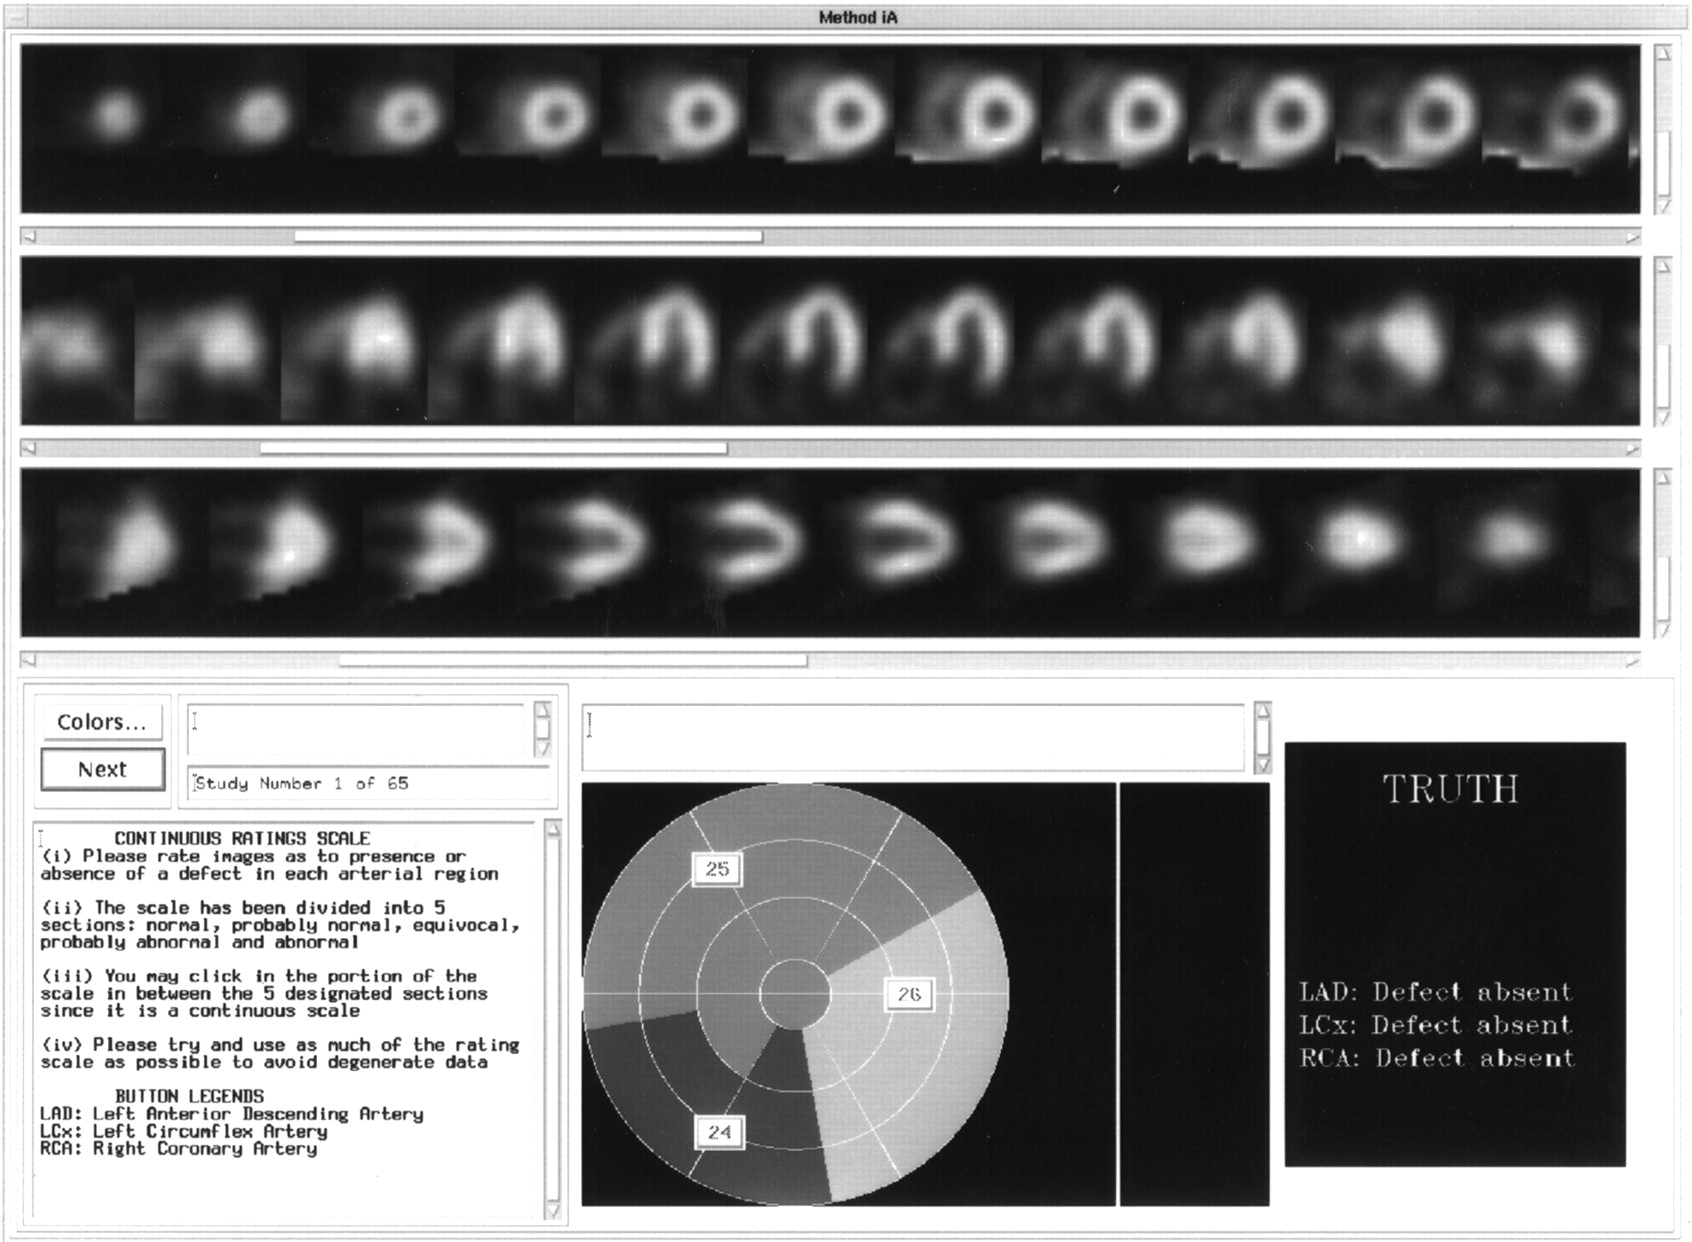
GUI used in ROC studies. Top 3 panels display SA, HLA, and VLA slices, from top to bottom, for interpretation by observer. Three pull-down buttons shown on polar map marking 3 arterial territories (middle panel at bottom) allowed user to assign score to each vascular territory (LAD, LCx, and RCA). During training, feedback regarding presence or absence of defect would appear in right panel at bottom of interface after observer completed assigning scores as described in text. Instructions for observer were given in left panel at bottom.
The second phase of training was conducted to enable the observers to make a direct comparison between FBP and the different iterative methods with compensation strategies. Here, the aim was for the observers to observe differences in the quality of corrected images, such as a lower apparent localization in the apex and a higher apparent subdiaphragmatic concentration, that were suggested to them in a preliminary discussion of possible variations. In each reading session, the observers viewed slices of both FBP reconstructions and one of the iterative OSEM reconstructions with some form of compensation, that is, AC alone, AC + SC, or AC + SC + RC. The observers were unaware of which OSEM reconstruction strategy they were viewing (a masking strategy) but were provided with knowledge of which slices were reconstructed by FBP. The observers viewed a total of 15 images (10 normal and 5 abnormal) for each iterative method (along with the FBP images) in 3 separate reading sessions. Also, feedback was provided with regard to the presence or absence of a perfusion defect in each of the 3 territories, that is, LAD, LCx, and RCA, for each training image set.
In the third phase, the observers viewed images for the 4 reconstruction methods separately in masked sessions. In each session, they viewed a total of 30 images (20 normal and 10 abnormal). Again, feedback was provided with regard to the presence or absence of a perfusion defect in each of the 3 territories. The reconstruction strategies were identified to the observers with a randomly selected Roman numeral between I and IV. The observers were informed that the purposes of this phase of training were to familiarize them with the GUI and to allow them to develop their own criteria for interpreting the strategies, because the same numeral would be used in the forthcoming ROC investigation.
Upon completion of the 3 phases of training, the observers started the reading sessions for the ROC investigation. The 100 patient images in this investigation were split into 2 groups. Because 4 reconstruction strategies were being evaluated in this work, the observers performed a total of 8 reading sessions. In each of these reading sessions, the observers viewed images for a single reconstruction strategy. Each observer evaluated the images independently in masked reading sessions. These reading sessions were performed in a quiet area, away from the clinic. The lighting in the area could be adjusted independently by the observers according to their preferences. The reconstructed transverse slices were magnified and resliced into short-axis (SA), horizontal long-axis (HLA), and vertical long-axis (VLA) views and presented for visual interpretation by use of the GUI illustrated in Figure 1. The top 3 panels displayed the SA, HLA, and VLA views, from top to bottom, for interpretation by the observer. Although the images were presented by use of the default color scale used in the clinic, the observers had the option of changing to other color scales if they so desired. A 100-point continuous scale, as has been recommended for ROC studies (32,33), was used, and the 3 pull-down buttons shown in the middle panel at the bottom of Figure 1 allowed the user to assign a score for the presence or absence of a perfusion defect in each of the 3 vascular territories (LAD, LCx, and RCA).
At the beginning of each reading session, the observers were retrained with a set of 15 images (5 abnormal and 10 normal) from the set used in training. During retraining, feedback regarding the presence or absence of perfusion defects in each of the 3 territories was provided to the observer, as shown in Figure 1. This step was followed immediately by viewing of a set of 50 images that served as the actual study images. No feedback was provided to the observers when they were scoring these images. An observer’s overall score for the investigation, representing observer performance for the detection of CAD, was taken to be the maximum of the scores in all 3 territories. In order to reduce reading-order effects between observers, the order of reading of the studies was designed on the basis of the guidelines proposed by Metz (34). Also, the images to be scored in each reading session were randomized by the GUI to minimize reading-order effects within each group of images.
ROC curves were generated with the ROCKIT program to estimate the binormal parameters (35) that best fitted the collected ratings data. The estimated Az values for each observer and each test condition were averaged over the two 50-image viewing sets. The fitted ROC curves were averaged over all observers as well as over the 2 reading sessions to obtain a composite ROC curve for each test condition. This step was accomplished by averaging the true-positive fractions at given false-positive fractions. A 2-way ANOVA was used to test for statistically significant differences between the reconstruction strategies and between observers. When there was a significant difference, the Scheffé multiple-comparisons test (36) was used to determine which pairs of observers or test conditions differed significantly from one another.
RESULTS
Figure 2 compares the SA slices for a patient with a low likelihood of CAD for all 4 reconstruction strategies. The FBP images display the characteristic inferior wall cooling artifact associated with subdiaphragmatic attenuation, whereas the images processed with the 3 iterative methods with compensation strategies (AC, AC + SC, and AC + SC + RC) appear to be free of this artifact. For OSEM reconstructions with AC alone, we noted slightly increased levels of extracardiac activity, compared with what was seen when AC + SC and AC + SC + RC were used. Compensating for scatter in addition to nonuniform attenuation appears to provide a slight improvement in contrast. Finally, with all 3 types of compensation (AC + SC + RC), we obtained good uniformity in addition to better definition of the left ventricular wall.
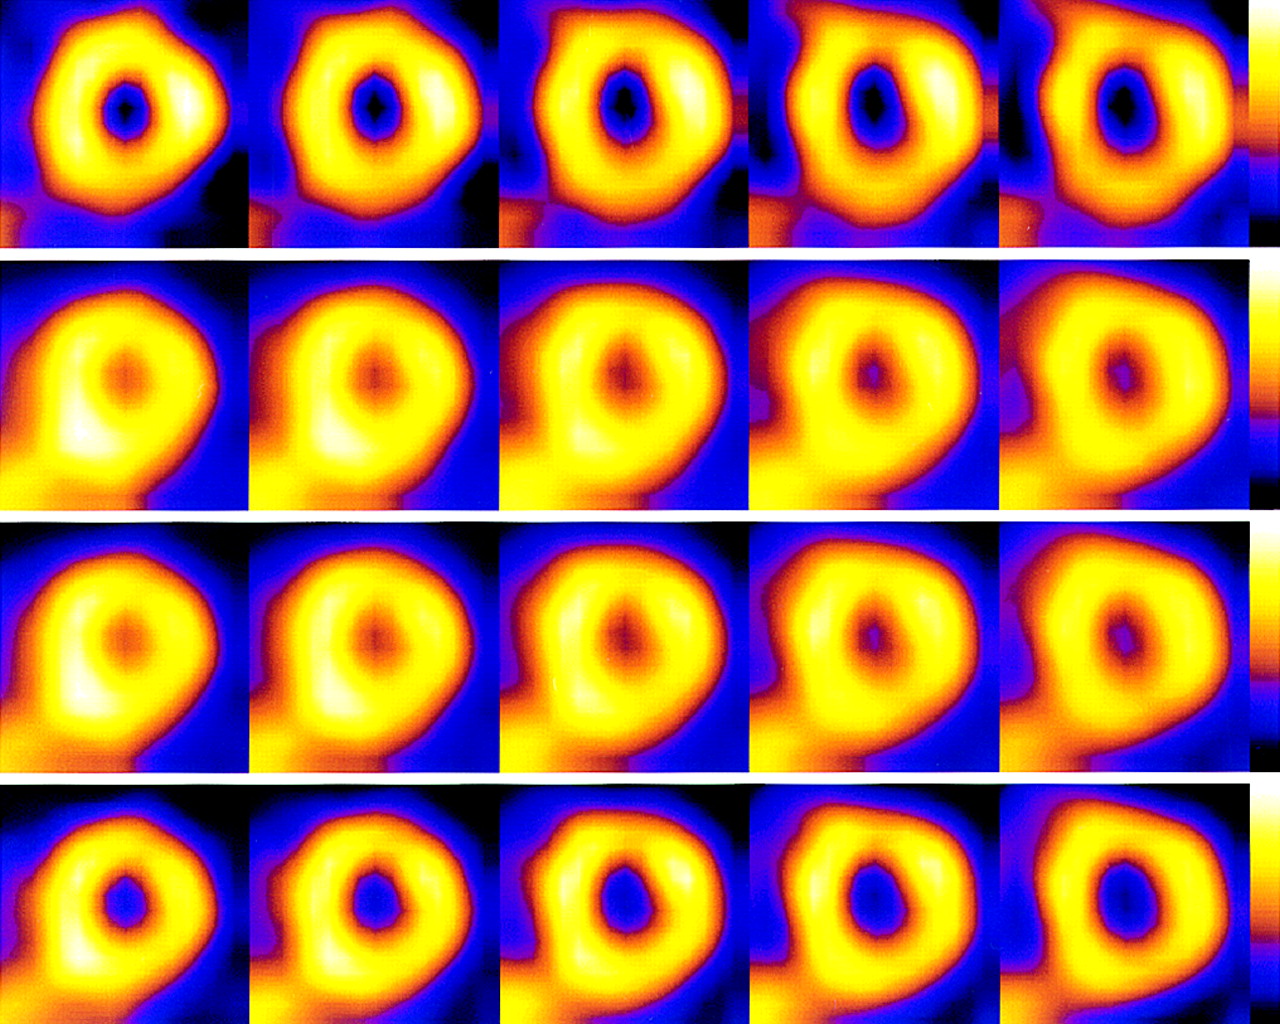
Comparison of SA slices of FBP (first row), OSEM with AC (second row), OSEM with AC + SC (third row), and OSEM with AC + SC + RC (fourth row) reconstructions for patient with low likelihood of CAD. Note that inferior wall cooling artifact associated with subdiaphragmatic attenuation and presence of extracardiac activity, although present in FBP images, is absent in corrected images. Enhanced levels of extracardiac activity were seen in OSEM images with AC alone, in contrast to OSEM images with both AC + SC and AC + SC + RC.
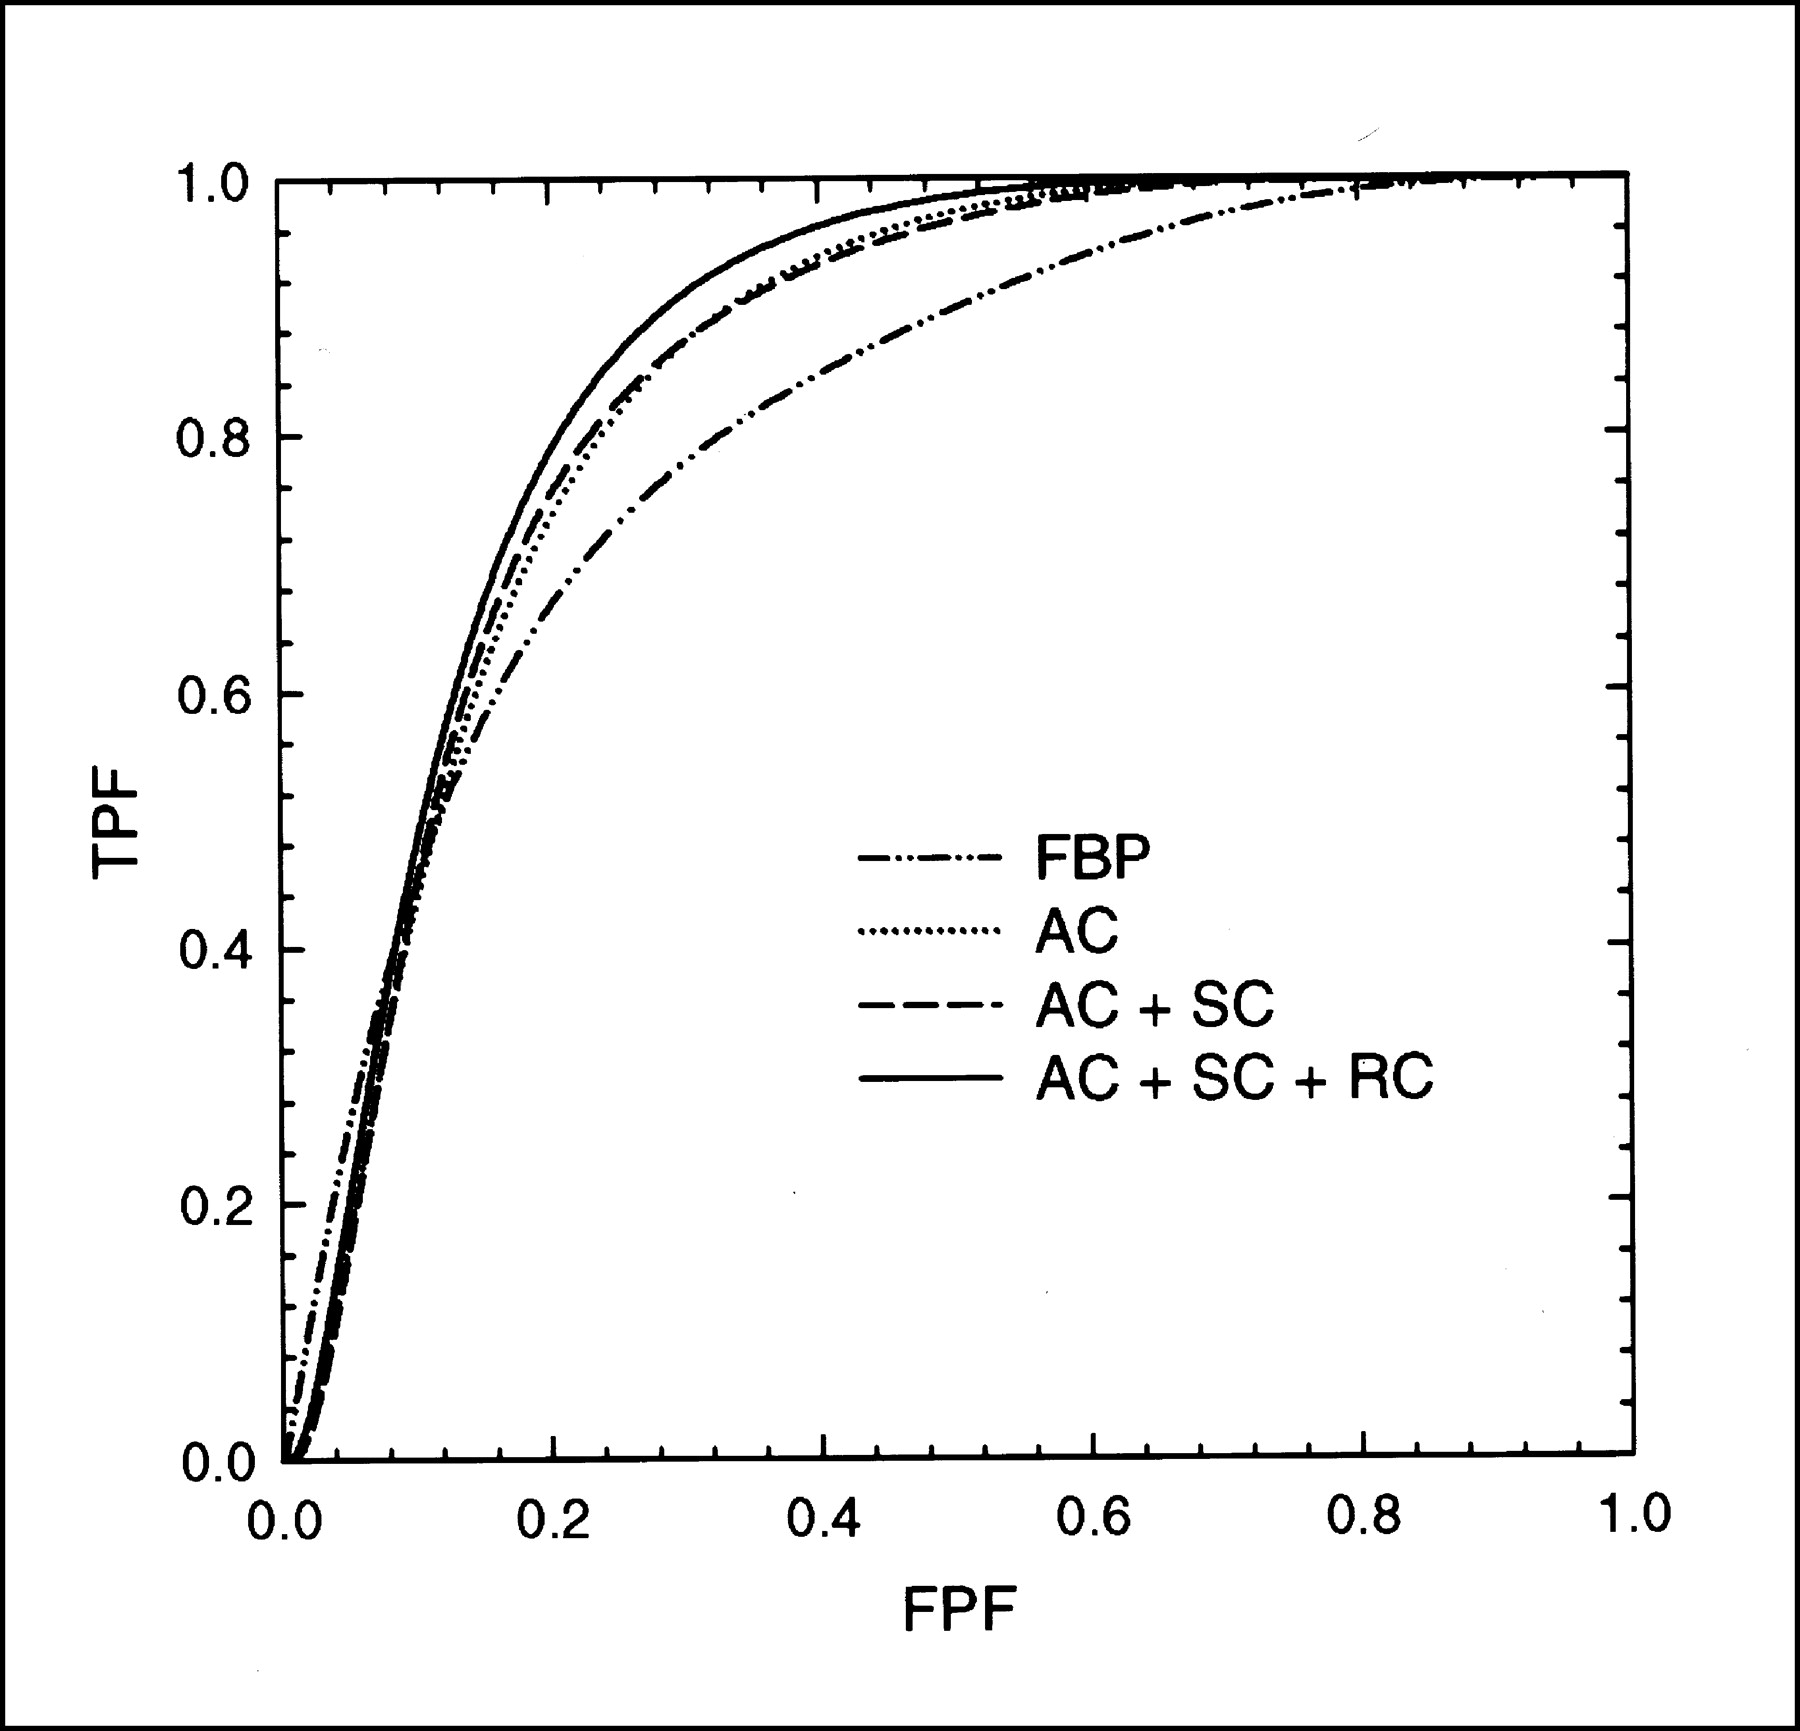
Figure 3 compares the ROC curves (averaged over 7 observers) for the overall detection of CAD for each reconstruction strategy. The corresponding aggregate Az values for the detection of CAD are shown in Table 1. The results indicate that OSEM reconstructions with AC + SC + RC provided the highest detection accuracy, followed by OSEM reconstructions with AC + SC, OSEM reconstructions with AC alone, and finally FBP reconstructions. The 2-way ANOVA for statistical significance, followed by the Scheffé multiple-comparisons test, revealed that the detection accuracy of FBP reconstructions was significantly lower (Table 1) than those of the 3 iterative methods with compensation strategies. In addition, the detection accuracy of OSEM reconstructions with AC alone was statistically significantly lower than that of OSEM reconstructions with AC + SC + RC. These results indicate that the progressive inclusion of each compensation strategy additionally improves detection accuracy over that of FBP reconstructions.

Comparison of ROC curves for overall detection of CAD (averaged over 7 observers) for FBP, OSEM with AC, OSEM with AC + SC, and OSEM with AC + SC + RC. TPF = true-positive fraction; FPF = false-positive fraction.
Aggregate Az Values for Detecting CAD and Arterial Defects and Significance of Differences Between Reconstruction Methods
Note that the images were scored with a continuous scale instead of a discrete scale to minimize the effects of degenerate ratings data and their impact on binormal ROC curve fits (32,33). Also, consensus reading sessions were not used in this ROC evaluation to generalize results over a cross section of observers. Because different observers used their own internal thresholds to rank order images, measures suchas sensitivity and specificity were not calculated from the ratings data. However, the fitted ROC curves allowed a more flexible interpretation of sensitivity and specificity measures for a wide range of operating thresholds, allowing comparisons to be made across observers. The overall sensitivities for detecting CAD at a fixed specificity of 80% are shown in Table 2 for the 4 reconstruction strategies considered in this work. The results indicate significantly higher sensitivities of all 3 iterative methods with compensation strategies than of FBP. A comparison of specificities at a fixed sensitivity of 80% (Table 3) also indicates significantly higher specificities of all 3 iterative methods than of FBP. In addition, the specificity of OSEM images with AC alone was found to be significantly different from that of OSEM images with AC + SC + RC, as predicted by Az values.
Aggregate Sensitivity for Detecting CAD and Arterial Defects at 80% Specificity and Significance of Differences Between Reconstruction Methods
Aggregate Specificity for Detecting CAD and Arterial Defects at 80% Sensitivity and Significance of Differences Between Reconstruction Methods
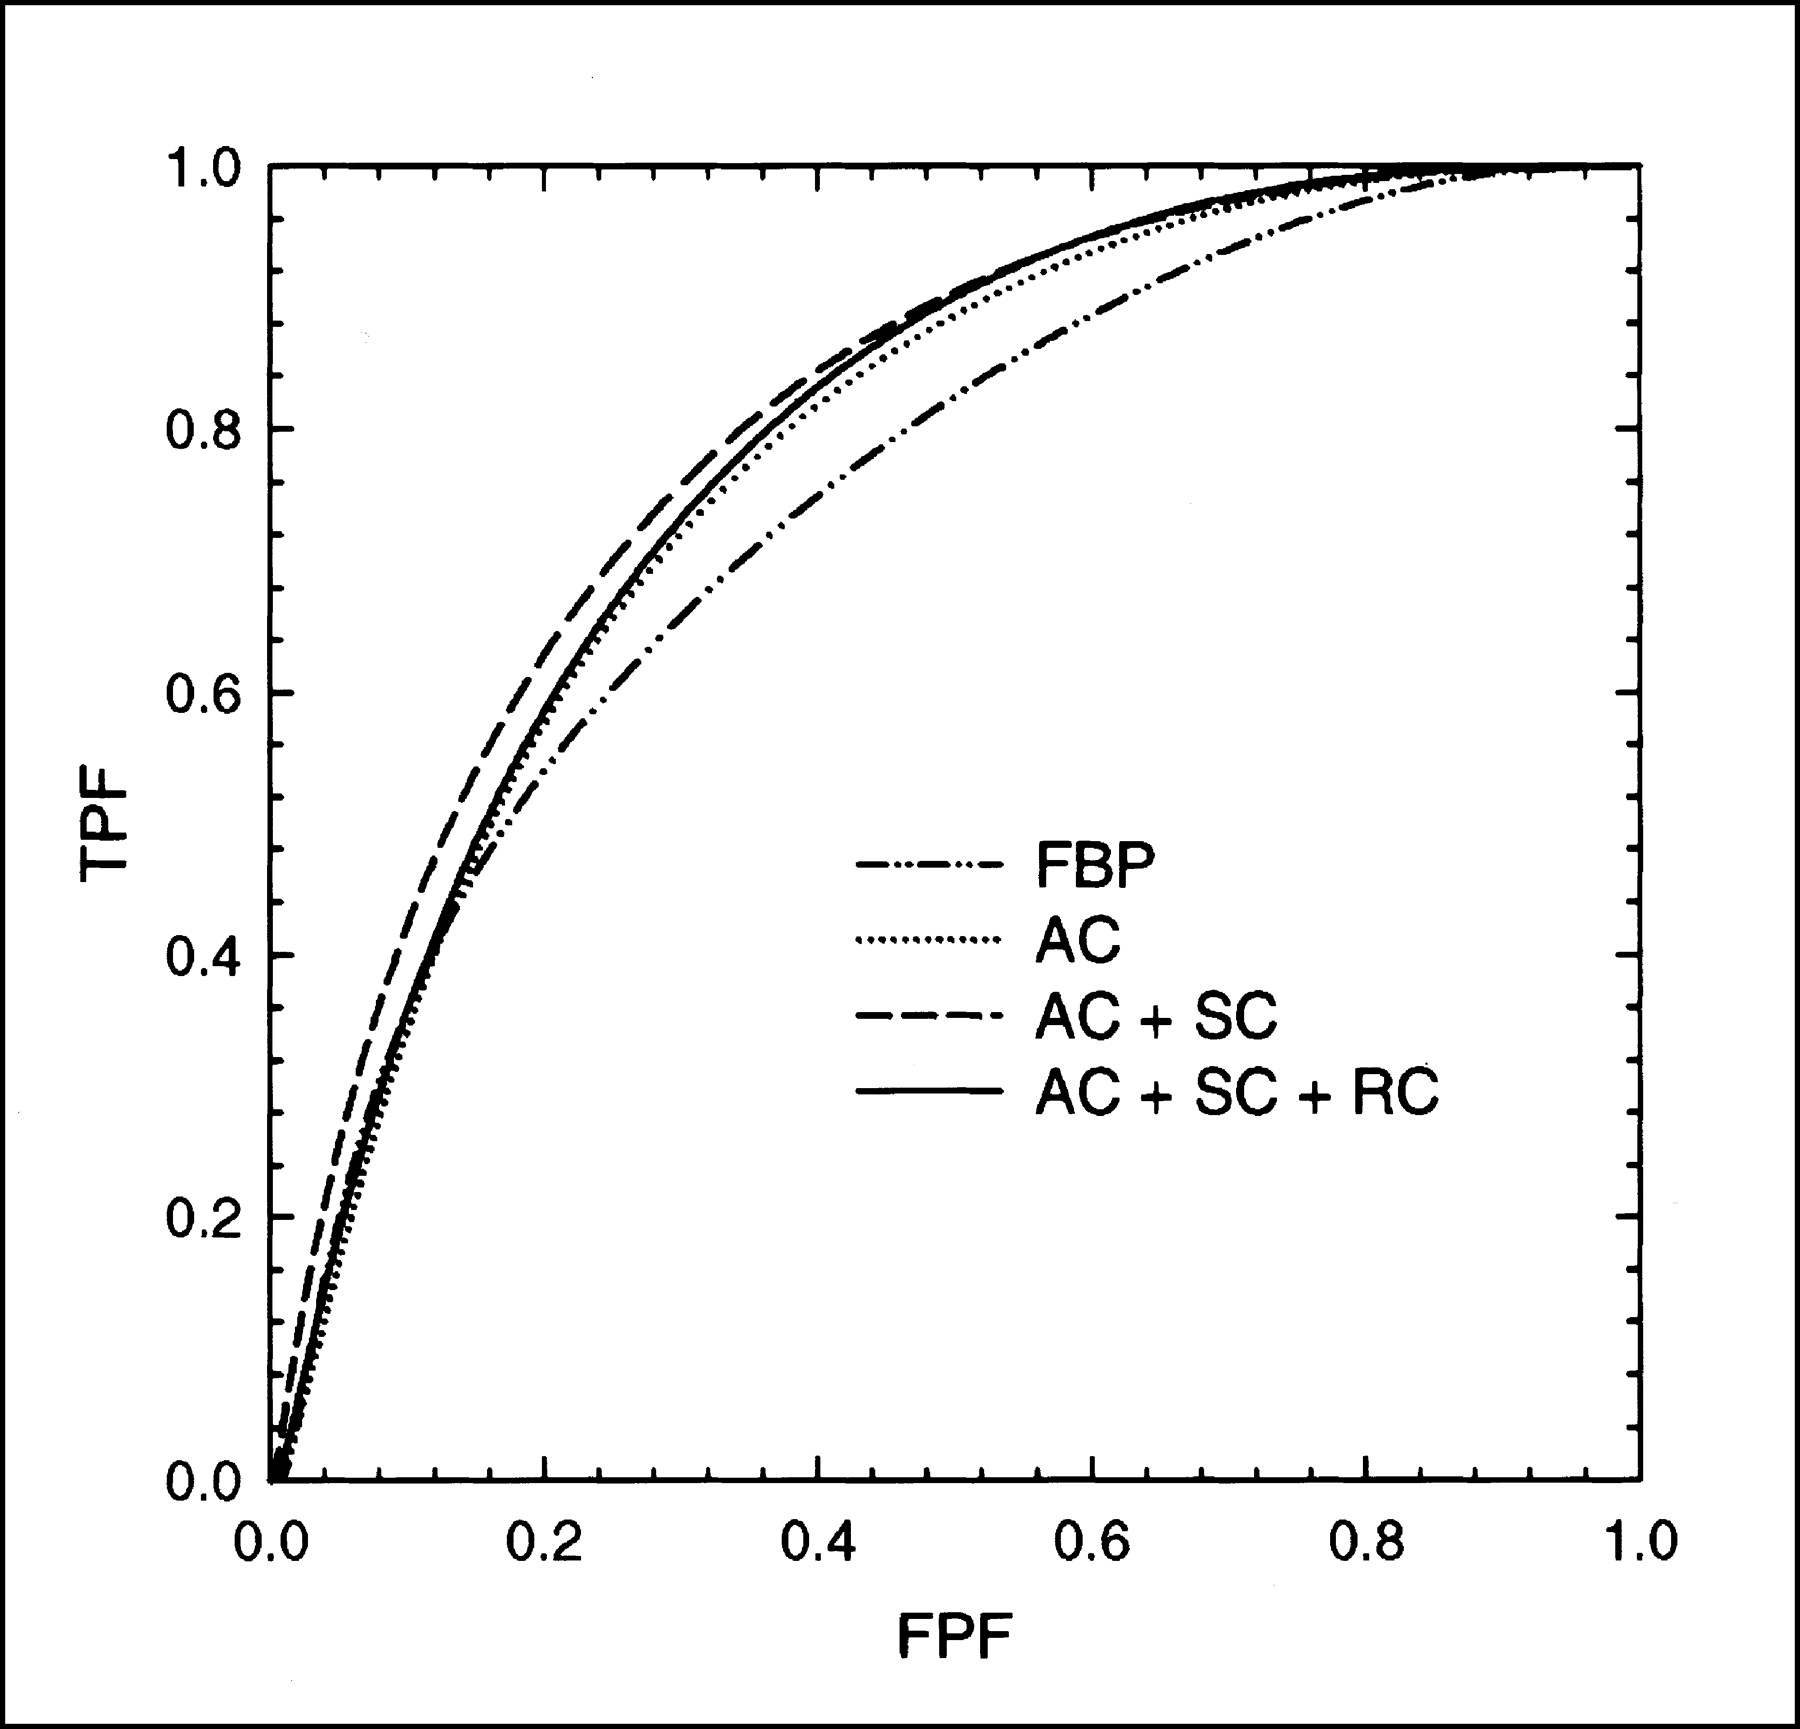
Figure 4 plots the average ROC curves for the localization of perfusion defects in the LAD territory. Az values (Table 1) again indicate a significant improvement in the detection of lesions in the LAD territory for OSEM images with AC + SC + RC compared with FBP images. As shown in Figure 4 and Table 2, OSEM reconstructions with AC + SC + RC had significantly higher detection sensitivities (at 80% specificity) than did FBP reconstructions. A comparison of the specificities in the LAD territory (Table 3) at a fixed sensitivity of 80% also indicates that OSEM images with AC as well as OSEM images with AC + SC + RC had significantly higher specificities than did FBP images.

Average ROC curves for LAD localization for FBP, OSEM with AC, OSEM with AC + SC, and OSEM with AC + SC + RC. TPF = true-positive fraction; FPF = false-positive fraction.
For LCx localization, there was a trend toward higher Az values with the progressive addition of corrections (Fig. 5; Table 1). OSEM images with AC + SC + RC showed significantly better detection performance than did FBP images. Note that there is some crossing over of the ROC curves at the lower left corner of Figure 5, indicating a reordering in the rankings at very high specificities (>80%). However, when we chose an operating point of 80% specificity (Table 2), we found that OSEM images with AC + SC + RC had higher (but not significantly different) sensitivities than did FBP images. Similarly, when we chose an operating point of 80% sensitivity (Table 3), we obtained significantly higher specificities when we implemented all 3 corrections (AC +SC + RC) with OSEM images than when we used FBP images.
Average ROC curves for LCx localization for FBP, OSEM with AC, OSEM with AC + SC, and OSEM with AC + SC + RC. TPF = true-positive fraction; FPF = false-positive fraction.
From Figure 6 and Table 1, it is evident that for RCA localization, the iterative methods had higher Az values than did FBP. We also noted that OSEM with AC + SC had statistically significantly higher Az values than did FBP. There was also some crossing over of the curves at high specificities in Figure 6. At an operating point of 80% specificity (Table 2), no significant differences were seen insensitivities among the 4 methods. When we chose an operating point of 80% sensitivity (Table 3), we found that all 3 iterative methods had significantly higher specificities than did FBP.

Average ROC curves for RCA localization for FBP, OSEM with AC, OSEM with AC + SC, and OSEM with AC + SC + RC. TPF = true-positive fraction; FPF = false-positive fraction.
Note that all statistically significant differences reported so far have been based on 2-way ANOVA results. In all comparisons, no statistically significant observer variability was found, indicating that differences (if any) were attributable primarily to variations in the reconstruction strategies. This aspect is also illustrated in Table 4, which shows a comparison of the average detection performance between the attending physicians and the cardiology fellows who participated in this investigation. No statistically significant difference between the attending physicians and the cardiology fellows was observed despite their difference in experience. This finding likely is attributable to the limitation of solely using the slice data for scoring and not providing the observers with the acquisition data and other information normally available at the time of clinical reading.
Comparison of Average Az Values Obtained by Attending Physicians (AP) and Cardiology Fellows (CF)
DISCUSSION
This ROC investigation demonstrates that compensating for attenuation, scatter, and nonstationary resolution significantly improves the detection of CAD over that obtained with FBP images. Furthermore, we have shown (Fig. 3) that detection performance steadily improves as AC, SC, and RC are progressively combined. With respect to individual vascular territories, we have shown an improvement in Az values for all 3 iterative methods over FBP. In particular, statistically significant improvements over FBP were seen in the LAD (AC + SC + RC), LCx (AC + SC + RC), and RCA (AC + SC) territories.
The results show that, although OSEM images with AC alone improve on FBP images for the detection of CAD, they are still suboptimal in comparison to reconstructions with AC + SC + RC. A semiquantitative study done previously with 200 healthy patients (31), including a subset of patients who had a low likelihood of CAD and who were included in this ROC investigation, indicated that AC alone tends to increase counts in the inferior walls, especially when there is significant scatter from extracardiac activity. That study also showed that SC in tandem with AC improves the uniformity of polar maps in most regions, offering an incremental improvement over the already substantial gains offered by AC. In this ROC investigation, the inclusion of RC in addition to AC + SC in general offered the best performance, with the exception of the RCA territory, for which AC + SC appeared to be the most effective strategy. These findings suggest the need for robust implementation of SC and RC in addition to AC to obtain consistent improvement in detection accuracy over that obtained with uncorrected images.
For the RCA territory, it might be argued that the differences in Az values (0.801 ± 0.019 for AC + SC and 0.785 ± 0.014 for AC + SC + RC) are within the error bars of each estimate. When we examined the results obtained by individual readers, we observed that AC + SC + RC did, on occasion, result in higher Az values than did AC + SC. Also, additional blurring in the RCA territory can occur because of respiratory motion (37). Correction for this motion is not included in RC, because it models solely the DDR of the system. Thus, the inclusion of RC in reconstructions would not be expected to correct respiratory motion blurring of subdiaphragmatic activity with the ventricular wall counts. Therefore, the inclusion of compensation for respiratory motion might be expected to improve further the accuracy of detection of defects in the RCA territory (38).
Although the FBP image sets were not identified as such during the actual human-observer ROC studies, it is possible that the observers were able to suspect when they were viewing FBP images as opposed to OSEM reconstruction images. Thus, it might not be completely accurate to describe the reading sessions as masked, at least in terms of FBP. However, this scenario might have provided a bias in favor of FBP, because it would be naive to believe that the training performed with the OSEM methods before the study was conducted would have provided the observers with the same opportunity to perfect their interpretation skills as they have with FBP.
The number of iterations and the SD of the 3D gaussian filter for OSEM reconstructions were not selected arbitrarily. Instead, they were determined previously by means of optimization ROC studies with hybrid images to be those which resulted in the best defect detection accuracy (18,19). The hybrid images were cardiac acquisitions that were interpreted as being normal clinically and to which synthetic perfusion defects were added. Perfusion defects of different sizes and extents were used to create the simulated hybrid images. The defects were located in all 3 vascular territories, and single-vessel, double-vessel, and triple-vessel diseases were simulated. Because these defects were added to clinical images acquired with the same acquisition protocol as the investigational images used in the ROC investigation reported here, the hybrid and investigational images matched in terms of anatomic structure variability and attenuation, scatter, resolution, and noise characteristics. We believe that this optimization of the OSEM reconstruction parameters, as opposed to their arbitrary selection, was required for a fair comparison of the reconstruction strategies. The Butterworth filter used with FBP was not similarly optimized. Instead, the filter to which the observers had become accustomed for clinical situations was used with FBP. The hybrid studies resulted in the use of 1 OSEM iteration for OSEM with AC and with AC + SC and 5 iterations for OSEM with AC + SC + RC. The reconstruction code started with a uniform first guess as to the count distribution in each slice. Thus, the result of using only 1 iteration of OSEM with AC and with AC + SC was that the reconstructions with the selected postreconstruction 3D gaussian filter appeared even smoother than the FBP slices. Similar findings regarding the number of iterations to be used with and without the inclusion of RC in OSEM were obtained previously for the detection of lesions in simulated 67Ga images (30). These findings might be attributable to the better noise properties obtained when DDR is included in reconstructions and to more iterations being beneficial, as the physics of imaging are modeled better in reconstructions.
It should be noted that about 65% of our patients referred for myocardial perfusion SPECT scans undergo a pharmacologic (dipyridamole) stress protocol. This protocol results in increased liver uptake, leading to increased levels of scatter from extracardiac structures. Thus, our patient population likely is considerably different from those included in previous investigations, especially for the RCA territory (2).
CONCLUSION
We demonstrated, through an ROC evaluation with 2 classes of observers (experienced attending physicians and cardiology fellows in training), that iterative methods with compensation strategies (AC, AC + SC, and AC + SC + RC) provided better performance than FBP reconstructions for the overall detection of CAD as well as for the localization of perfusion defects in the 3 arterial territories. For the overall detection of CAD, significantly higher Az values were obtained for OSEM reconstructions with AC + SC + RC than for FBP reconstructions. As expected, on the basis of the physics of imaging, we noted a steady improvement in detection as AC, SC, and RC were progressively combined in the reconstructions, suggesting that improved modeling of physical degradations can improve the quality of cardiac perfusion images. This investigation also demonstrated that OSEM with AC + SC + RC provided significantly higher detection accuracy than did FBP for the LAD and LCx territories, whereas OSEM with AC + SC was the optimal strategy for the RCA territory. For the patient population that was evaluated in this investigation with a PRISM 3000XP 3-headed system, we conclude that a combination of attenuation, scatter, and DDR compensation strategies improves diagnostic accuracy over that obtained with FBP with no corrections.
Acknowledgments
This work was presented in part at the 49th annual meeting of the Society of Nuclear Medicine, Los Angeles, CA, 2002. The authors thank Drs. Charles E. Metz, Harrison H. Barrett, and Howard C. Gifford for many helpful discussions and for providing valuable insights in setting up this study. The authors also thank all of the past members of the medical physics research group at the University of Massachusetts who assisted in developing the methods used in reconstruction as well as the nuclear medicine technologists who acquired the clinical studies. This work was supported by National Heart, Lung, and Blood Institute grant HL 50349. The contents are solely the responsibility of the authors and do not necessarily represent the official views of the National Institutes of Health. This work was also supported by a research grant from Picker International (currently Philips Medical Systems).
Footnotes
Received Dec. 12, 2002; revision accepted Jun. 10, 2003.
For correspondence or reprints contact: Michael A. King, PhD, Division of Nuclear Medicine, Department of Radiology, University of Massachusetts Medical School, 55 Lake Ave. N., Worcester, MA 01655.
E-mail: Michael.King{at}umassmed.edu
REFERENCES
In this issue


Jump to section
Related Articles
Cited By...
- Three-Dimensional Ordered-Subset Expectation Maximization Iterative Protocol for Evaluation of Left Ventricular Volumes and Function by Quantitative Gated SPECT: A Dynamic Phantom Study
- A Postprocessing Method for Compensation of Scatter and Collimator Blurring in SPECT: A Proof-of-Concept Study
- Half-Time SPECT Myocardial Perfusion Imaging with Attenuation Correction
- Recent Advances in SPECT Imaging
- Evaluation of 3D Monte Carlo-Based Scatter Correction for 201Tl Cardiac Perfusion SPECT
- Evaluation of 3D Monte Carlo-Based Scatter Correction for 99mTc Cardiac Perfusion SPECT
- The year in cardiac imaging