


Abstract
201Tl-Chloride (201Tl) is a myocardial perfusion SPECT agent with excellent biochemical properties commonly used for assessing tissue viability. However, cardiac 201Tl SPECT images are severely degraded by photons scattered in the thorax. Accurate correction for this scatter is complicated by the nonuniform density and varied sizes of thoraxes, by the additional attenuation and scatter caused by female patients' breasts, and by the energy spectrum of 201Tl. Monte Carlo simulation is a general and accurate method well suited to modeling this scatter. Methods: Statistical reconstruction that includes Monte Carlo modeling of scatter was compared with statistical reconstruction algorithms not corrected for scatter. In the ADS method, corrections for attenuation, detector response, and scatter (Monte Carlo–based) were implemented simultaneously via the dual-matrix ordered-subset expectation maximization algorithm with a Monte Carlo simulator as part of the forward projector. The ADS method was compared with the A method (ordered-subset expectation maximization with attenuation correction) and with the AD method (a method like the A method but with detector response modeling added). A dual-head SPECT system equipped with two 153Gd scanning line sources was used for simultaneously acquiring transmission and emission data. Four clinically realistic phantom configurations (a large thorax and a small thorax, each with and without breasts) with a cardiac insert containing 2 cold defects were used to evaluate the proposed reconstruction algorithms. We compared the performance of the different algorithms in terms of noise properties, contrast-to-noise ratios, the contrast separability of perfusion defects, uniformity, and robustness to anatomic variations. Results: The ADS method provided images with clearly better visual defect contrast than did the other methods. The contrasts achieved with the ADS method were 10%–24% higher than those achieved with the AD method and 11%–37% higher than those achieved with the A method. For a typical contrast level, the ADS method exhibited noise levels around 27% lower than the AD method and 34% lower than the A method. Compared with the other 2 algorithms, the ADS reconstructions were less sensitive to anatomic variations and had better image uniformity in the homogeneously perfused myocardium. Finally, we found that the improvements that can be achieved with Monte Carlo–based scatter correction are stronger for 201Tl than for 99mTc imaging. Conclusion: Our results indicate that Monte Carlo–based scatter correction is suitable for 201Tl cardiac imaging and that such correction simultaneously improves several image-quality metrics.
Thallium-201 chloride (201Tl) is a perfusion agent commonly used for myocardial perfusion SPECT. In addition to assessment of myocardial perfusion in both stress and rest situations, the unique redistribution property has made 201Tl SPECT an effective modality for identifying myocardial viability (1). However, because of the combined effects of some of the physical properties of 201Tl, the quality of SPECT images obtained with this perfusion agent is often suboptimal. Compared with 99mTc images, 201Tl images are more degraded by attenuation and scatter because of the lower energy of the dominant 201Tl x-ray photopeak. Furthermore, dosimetric considerations related to the long physical half-life of 201Tl restrict the allowed myocardial activity to levels as much as 4 times lower than typical 99mTc concentrations. These factors together result in a significantly higher noise level and lower quantitative accuracy for the reconstructed 201Tl images than for the 99mTc images. Despite the ongoing debate as to whether 99mTc-labeled perfusion agents should or could replace 201Tl for myocardial perfusion SPECT studies, the latter still is often used in clinical practice. According to a report (2), approximately 60% of the cardiac SPECT studies performed yearly in the United States in the late 1990s used 201Tl. A similar usage of 201Tl was also found by a more recent survey conducted in the United Kingdom (3). Therefore, improving the image quality for 201Tl cardiac SPECT remains clinically important.
Among all the image-degrading factors present in the cardiac SPECT studies, attenuation, collimator and detector blurring, and scatter have a large impact on the quantitative accuracy and the clinical diagnosis. Several experiments have shown that all these degradations have to be corrected for to optimize clinical SPECT images (4–9). The correction of attenuation and camera blurring is a relatively straightforward and well-established process. Accurate modeling of scatter is, however, complex because of the highly nonuniform density of thoraxes, variation in thorax dimensions, additional attenuation and scatter caused by female patients' breasts, and the complicated spectrum of 201Tl, which consists of multiple photopeaks. Unfortunately, scattered photons cannot simply be neglected because they account for 50% of the total amount of detected photons for a typical 201Tl cardiac SPECT study (10,11). Several authors have proposed various approximate, spatially variant models for scatter correction in iterative SPECT reconstruction (10,12–16). Most of these models perform well for uniform objects and with isotopes such as 99mTc (140 keV) but are less suitable for highly nonuniform media such as the thorax or for lower-energy isotopes such as 201Tl (72 keV). Monte Carlo–based scatter correction, on the other hand, is a more general and accurate correction method. Because of a prohibitively long computation time and huge memory requirement, fully 3-dimensional (3D) Monte Carlo–based statistical reconstruction has only recently become feasible. Our group has developed an accelerated Monte Carlo–based, fully 3D statistical reconstruction system (17). For a typical cardiac acquisition consisting of 64 projections with 64 × 64 binned data, our method can complete a reconstruction (15 iterations with 8 subsets) within a couple of minutes on a stand-alone personal computer with a dual central processing unit (2.66 GHz) (18).
Previously, we evaluated 3D Monte Carlo–based scatter correction for 99mTc imaging (19) and found moderate improvement in several image-quality metrics over triple-energy-window scatter correction and a method that does not correct for scatter. However, much more scatter needs correcting in 201Tl imaging than in 99mTc imaging (10,11). In addition, triple-energy-window correction is not suitable for the complicated spectrum of 201Tl. Other window-based scatter reduction methods require many energy windows, which often are not available. We therefore hypothesized that the Monte Carlo–based scatter correction could be an attractive option for 201Tl SPECT. Thus, our goal was to evaluate the effectiveness of 3D Monte Carlo–based scatter correction in 201Tl imaging. To this end, a series of physical phantom experiments, which represented a variety of realistic anatomic configurations, was performed. Statistical reconstruction including Monte Carlo–based scatter correction was compared with reconstruction methods that do not correct for scatter. We assessed the noise properties of Monte Carlo–based scatter correction, the robustness of this approach to anatomic variations, the contrast separability of perfusion defects, and the uniformity.
MATERIALS AND METHODS
Phantom Configurations
Four clinically realistic phantom configurations (Data Spectrum Corp.) were used for our evaluation: a large anthropomorphic thorax (model ECT/TOR/P), and a small anthropomorphic thorax (model ECT/LUNG/P), each with breasts (model ECT/SOL-BR/M) and without breasts (Fig. 1). The lateral and anteroposterior dimensions were 38 and 26 cm, respectively, for the large phantom and 32 and 24 cm, respectively, for the small phantom. Each phantom configuration comprised a cardiac insert (model ECT/CAR/I) representing the left ventricle, 2 lung inserts, a liver insert, and a spine insert. Two solid defects (2 mL each) were placed in the anterior and inferior walls of the cardiac insert. These 4 phantom configurations were also used without solid defects for the nondefect studies. The same configurations had been used in our recent publication about scatter correction for 99mTc SPECT (19).
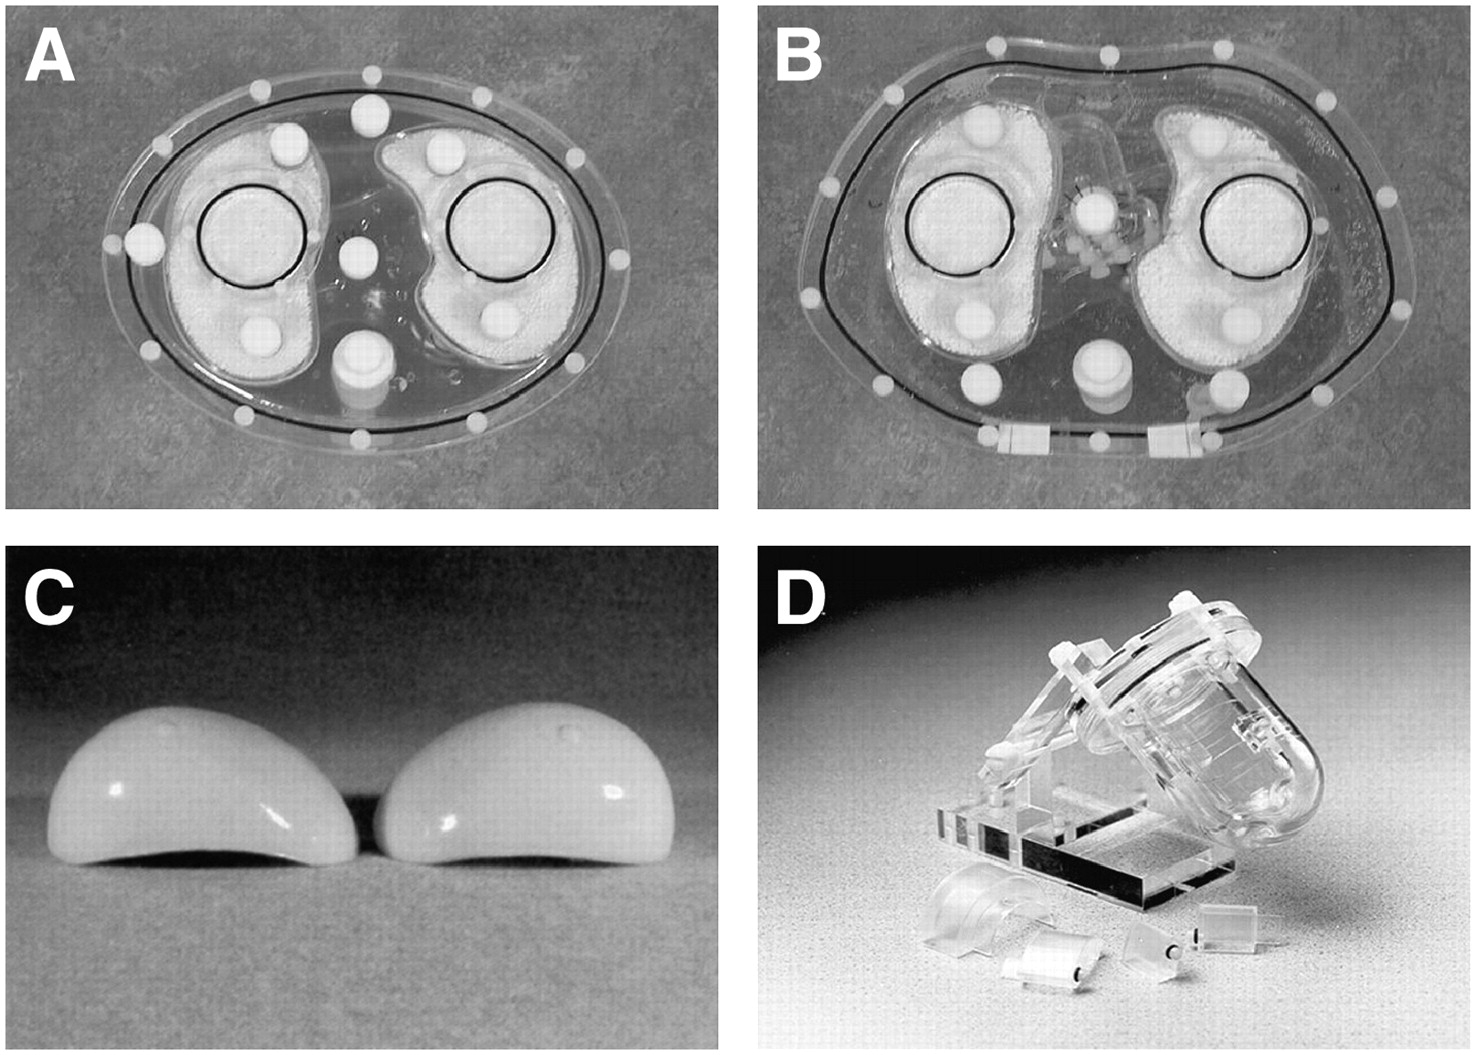
Photographs of the phantoms: small thorax (A), large thorax (B), breast attachments (C), and myocardial insert with solid defect set (D). (Images courtesy of Data Spectrum Corp.)
The relative activity concentration ratio myocardium:liver:lungs:background was 43:19:1:2, which reflects the distributions encountered in clinical 201Tl studies (20,21). Absolute activities in the myocardium were based on 3% uptake for 148 MBq of 201Tl.
Measurements
The measurements were performed using a dual-head camera (ADAC Vertex; Philips) equipped with extra-high-resolution collimators (Vantage; Philips) and with 2 scanning line sources containing approximately 5.5 GBq of 153Gd each. A 180° study for simultaneous transmission and emission scans was acquired in 64 projections. Projections were acquired from right anterior oblique (−45°) to left posterior oblique (+135°). To assess the noise properties of various reconstruction algorithms, we generated 10 noise realizations from a high-count emission scan. The acquisition time of this high-count emission scan was 4,000 s per projection, which is 100 times longer than for a normal clinical scan. The projections we obtained can therefore be regarded as containing a negligible amount of noise. To create realistic count levels, the almost noise-free projection data were downscaled by a factor of 100. For the dual-head system used here, this count level corresponds to a clinically realistic total acquisition time of 21.3 min. A set of noise realizations of projection data was generated by adding Poisson noise (22) to the scaled projections. A different random seed was used for each noise realization.
The 201Tl emission data were measured in the low and high 201Tl photopeak windows (72 keV ± 10% and 167 keV ± 10%) and then summed. During emission acquisitions, transmission data were collected in a 20% wide energy window centered at 100 keV inside a moving electronic window. The acquisition time was 39 s per projection. To correct for the downscatter of 201Tl γ-photons into the 100-keV transmission window, we used a 100-keV scatter window (100 keV ± 10%) covering the detector area outside the moving electronic window. The acquisition matrix was 128 × 128 with a pixel size of 4.72 mm for both emission and transmission data.
Image Reconstruction
Image reconstructions using ordered-subset expectation maximization (OS-EM) (23) algorithms with 3 different types of photon transport modeling were compared. In the first method (the A [i.e., attenuation] method), nonuniform attenuation correction was incorporated into the OS-EM method. Attenuation maps were used to perform nonuniform attenuation correction. The second method (the AD [i.e., attenuation and detector response] method) modeled both attenuation correction and detector response (collimator and detector blurring) during the reconstruction. We used precalculated point-spread function tables that describe the gaussian distance-dependent detector response of a point source in air. The full width at half maximum of the gaussian kernels was calculated on the basis of the geometric collimator resolution and intrinsic detector resolution (24). The third method (the ADS [i.e., attenuation, detector response, and scatter] method) was fully 3D Monte Carlo–based reconstruction performed using dual-matrix OS-EM (25,26). Attenuation and detector blurring were modeled in both the forward projection and the backprojection. Monte Carlo simulation of 201Tl self-scatter was, however, used only during calculation of the forward projection (17). The Monte Carlo simulator was accelerated using convolution-based forced detection (24), with which 105 photon paths per subset were found to be sufficient for reconstructions of cardiac perfusion studies (18). Seven orders of Compton scatter were generated. Downscatter of 201Tl photons to the 153Gd transmission window was corrected by using a scatter window. We elaborate on the issue of downscattered 153Gd photons to the 72-keV window in the “Discussion” section.
During OS-EM reconstruction, both resolution and noise increased with each iteration. The resolution of OS-EM reconstruction is also known to vary spatially. In addition, algorithms using different photon transport models have different convergence speeds, which depend on the activity distribution. Because overiteration followed by postfiltering can lead to more accurate results than does early stopping of the iteration process and ensures highly homogeneous resolution (27,28), we used a large number of updates (30 iterations with 8 subsets per iteration) to produce images with high resolution but with a higher noise level than would normally be ideal. Three-dimensional gaussian filters using various kernel sizes were then applied to these images. In this way, we obtained a series of images with a range of noise levels and associated contrast levels, facilitating the generation of contrast-to-noise curves and enabling us to compare the contrasts of postfiltered images obtained with different algorithms at an equal noise level.
Attenuation maps were reconstructed using the ordered-subset convex algorithm (29) with 8 subsets and 30 iterations. To reduce noise, we first filtered the attenuation maps using a 3D gaussian kernel (full width at half maximum, 2.5 pixels). Then, median filtering was applied twice using a 3D cubic kernel of 5 × 5 × 5 pixels (19).
Accuracy Check of Forward Projector for ADS
To evaluate the point source response calculated by our Monte Carlo simulator, we performed γ-camera measurements with a 201Tl point source in the center of a water-filled cylinder phantom with a radius of 11.1 cm. The distance between the point source and the collimator surface was 12.9 cm. The profiles of the measured and simulated point source responses matched perfectly in both 201Tl photopeak windows (Fig. 2). The same measurements were also performed with the point source in air. The profiles of the measured and simulated responses showed good agreement (Fig. 2).
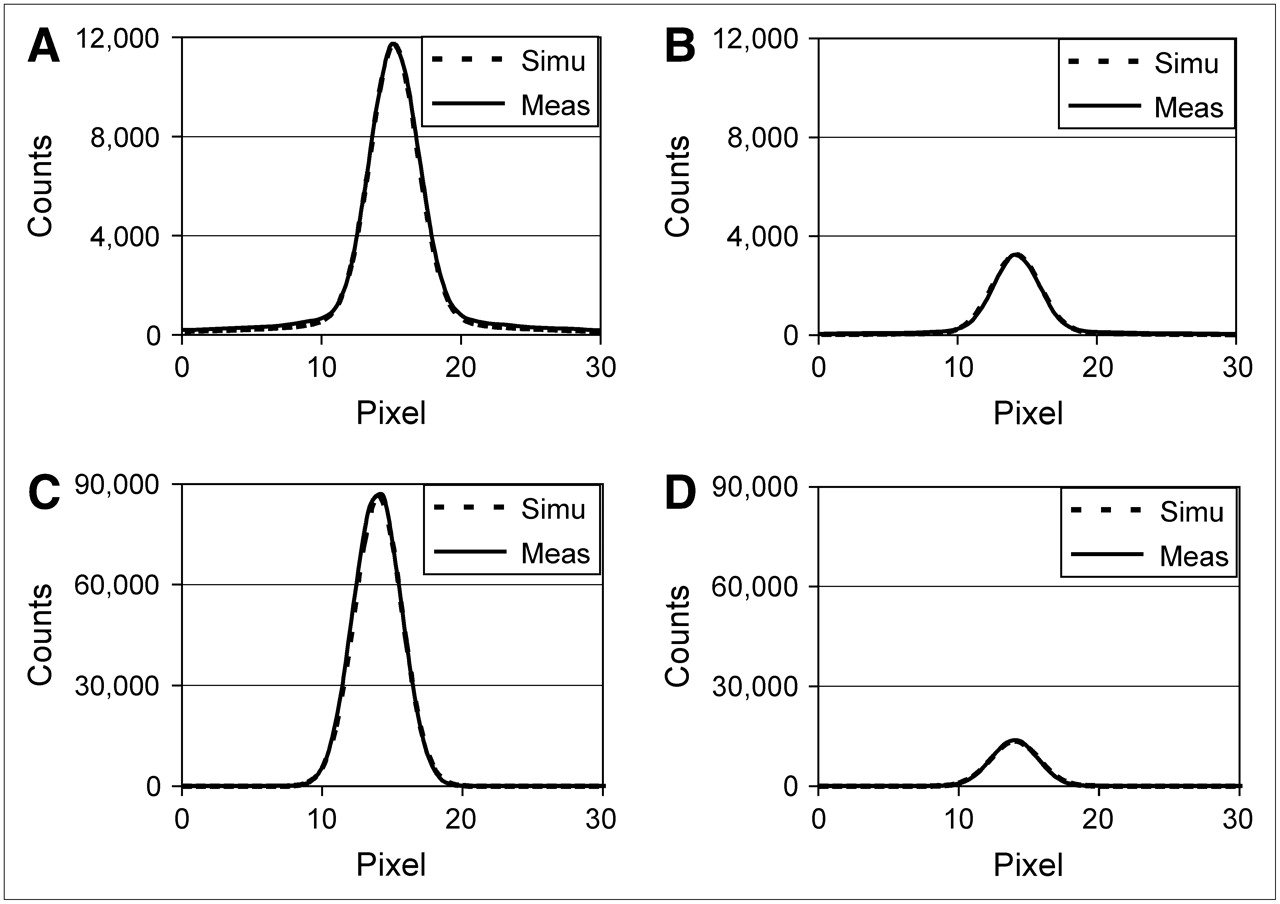
Comparisons of measured (Meas) and simulated (Simu) point-spread function tables for water-filled cylinder phantom (A and B) and for air (C and D), for both photopeak windows of 201Tl: 72 keV ± 10% (A and C) and 167 keV ± 10% (B and D).
Assessment of Reconstructed Images
This section describes the qualitative and quantitative methods we used to assess the reconstructed images. Several of these assessment procedures have already been introduced, extensively discussed, and used in a recent publication about scatter correction for 99mTc myocardial perfusion studies (19).
Circumferential Planes.
Quantitative analysis was performed using circumferential planes. Such planes are constructed by projecting the maximum-counts circumferential profiles onto a rectangular plane (Fig. 3). The anterior, lateral, inferior, and septal walls of the myocardium were sampled cylindrically, and the apex was sampled spherically (30,31).
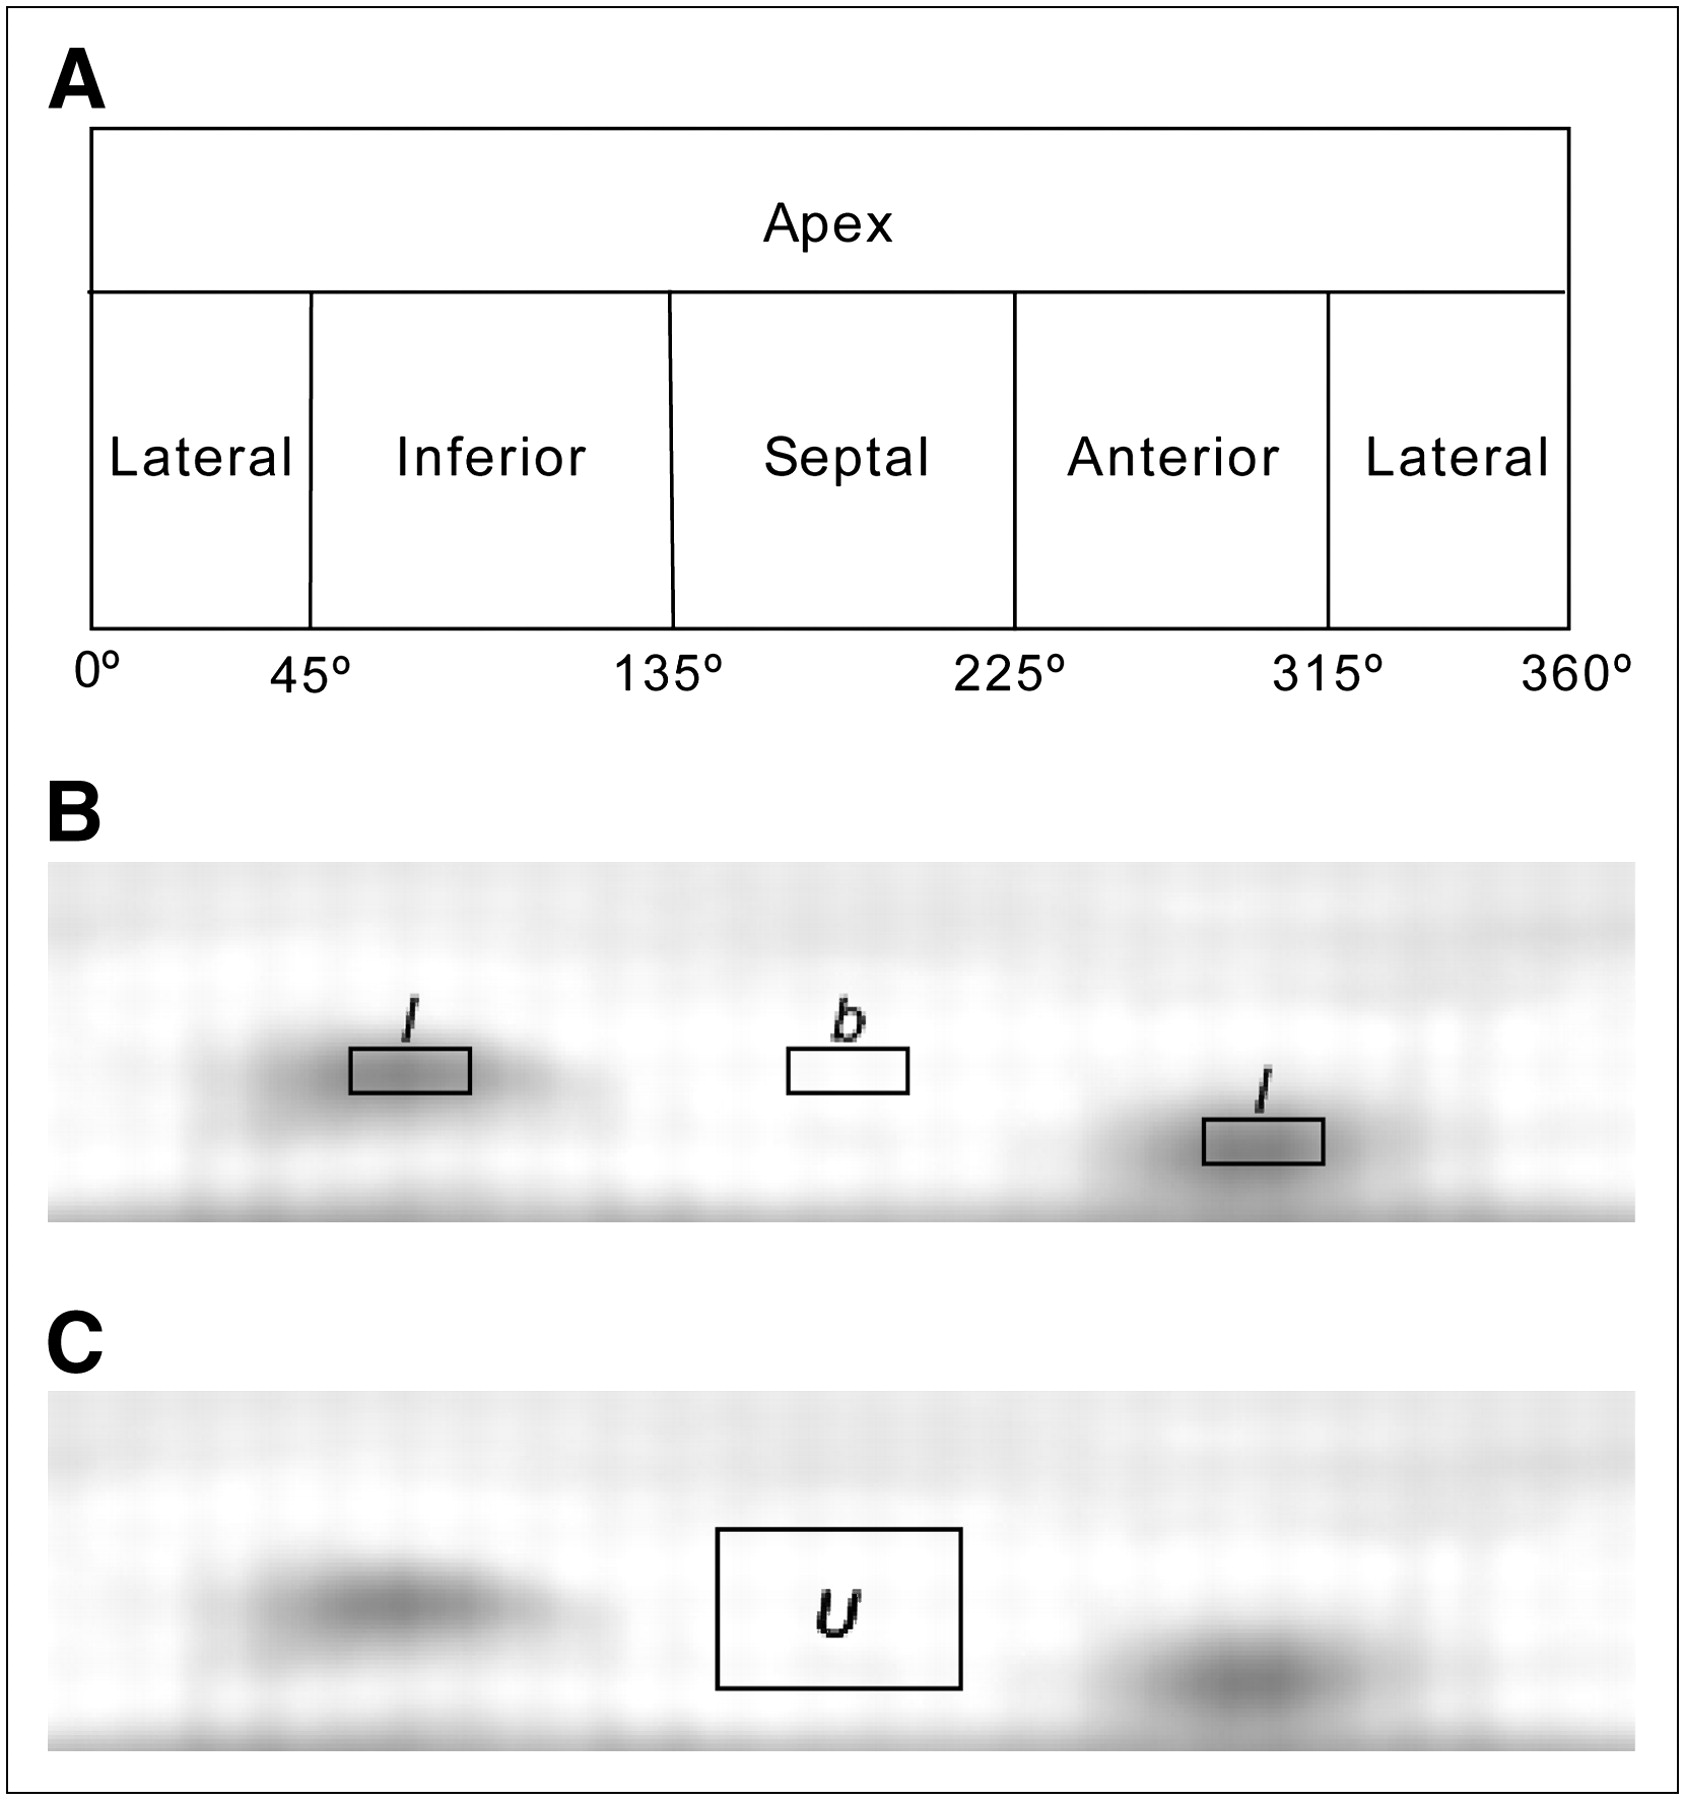
Illustrations of spherically sampled apex and cylindrically sampled myocardial wall in circumferential plane (A); locations of the 2 defect regions (l) and background region (b) in circumferential plane (B); and location, in circumferential plane, of uniform region U used for calculating noise (C).
Contrast.
Two types of contrast were used to assess the images: absolute contrast ( ) and relative contrast (
 )
) Eq. 1where l is the average pixel value in the 2 cold defects, which are located in the inferior and anterior walls, and b is the average pixel value in the background regions beside the defects. The defect and background regions are illustrated in Figure 3. The regions of interest for the defects were 60% of the true defect sizes and were centered at the minimum pixel value within each defect.
Noise Properties.
For each phantom configuration, the mean of the circumferential planes of the 10 noise realizations was subtracted from the circumferential plane of each noise realization. We determined the normalized SD in the uniform region U (Fig. 3) in the subtraction image. Eq. 2where
  is the nth pixel value within the region U in the subtraction image, N is the total number of pixels in the region, and u is the average pixel value of the region U in the circumferential plane of each noise realization.
Contrast Separability of Cold Defects.
The detectability index d (19,32) was used to assess the performance of each reconstruction method in quantitatively distinguishing the myocardium with defects from the myocardium without defects. Relative contrast  (Eq. 1) was calculated from both defect and nondefect reconstructions. The contrast values obtained for nondefect studies were due to noise and anatomic variation only and will be referred to as the reference contrast. At a fixed normalized SD level (obtained by 3D gaussian postprocessing filtering using various kernel sizes), both the defect and the nondefect classes contain 40 images (10 noise realizations times 4 different phantom configurations). Within each class, the relative contrasts of images have a certain mean (M) and a certain SD. The detectability index d is given by:
 Eq. 3where
  is the mean of Cr within the defect class,
  is the mean of Cr within the reference class,
  is the SD of Cr within the defect class, and
  is the SD of Cr within the reference class.
Robustness.
Because the same cardiac insert was used for each phantom configuration, we expected to obtain almost identical cardiac profiles among all the phantom configurations, when all the anatomy-dependent corrections were perfectly performed during reconstruction. Here, we used the robustness (R), described elsewhere (19), to measure the extent to which anatomic variations influenced the reconstructed myocardium; ideally, they should not exert any influence at all.
Let us first define the circumferential profile  , where i labels 1 of the 4 phantom configurations, n enumerates 1 of the 10 noise realizations, and α represents the angular sample in the polar coordinate system.
  is a 4-pixel-wide circumferential profile taken from the circumferential plane obtained from a nondefect study. The average of
  over all 4 phantom configurations and all noise realizations is denoted as
  .
.
The robustness  is defined as:
 Eq. 4where the average absolute defect contrast (AADC) is the average of
  over all 4 phantom configurations with myocardial defects, and the integration is divided by 360 because the integration is performed by summing 360 values that are 1° apart. The numerator of Equation 4 is based on nondefect phantom configurations and thus represents the anatomy-induced variations in the cardiac profiles. The robustness compares the strength of these anatomy-induced variations to the contrast induced by true defects (represented by AADC).
Uniformity.
For every noise realization, the accuracy of each reconstruction method for the homogeneously perfused myocardium can be assessed by calculating the uniformity: Eq. 5where
  is the SD of
  . Uniformity was expected to be equal to zero when all the image-degrading factors were perfectly corrected for during reconstruction.
RESULTS
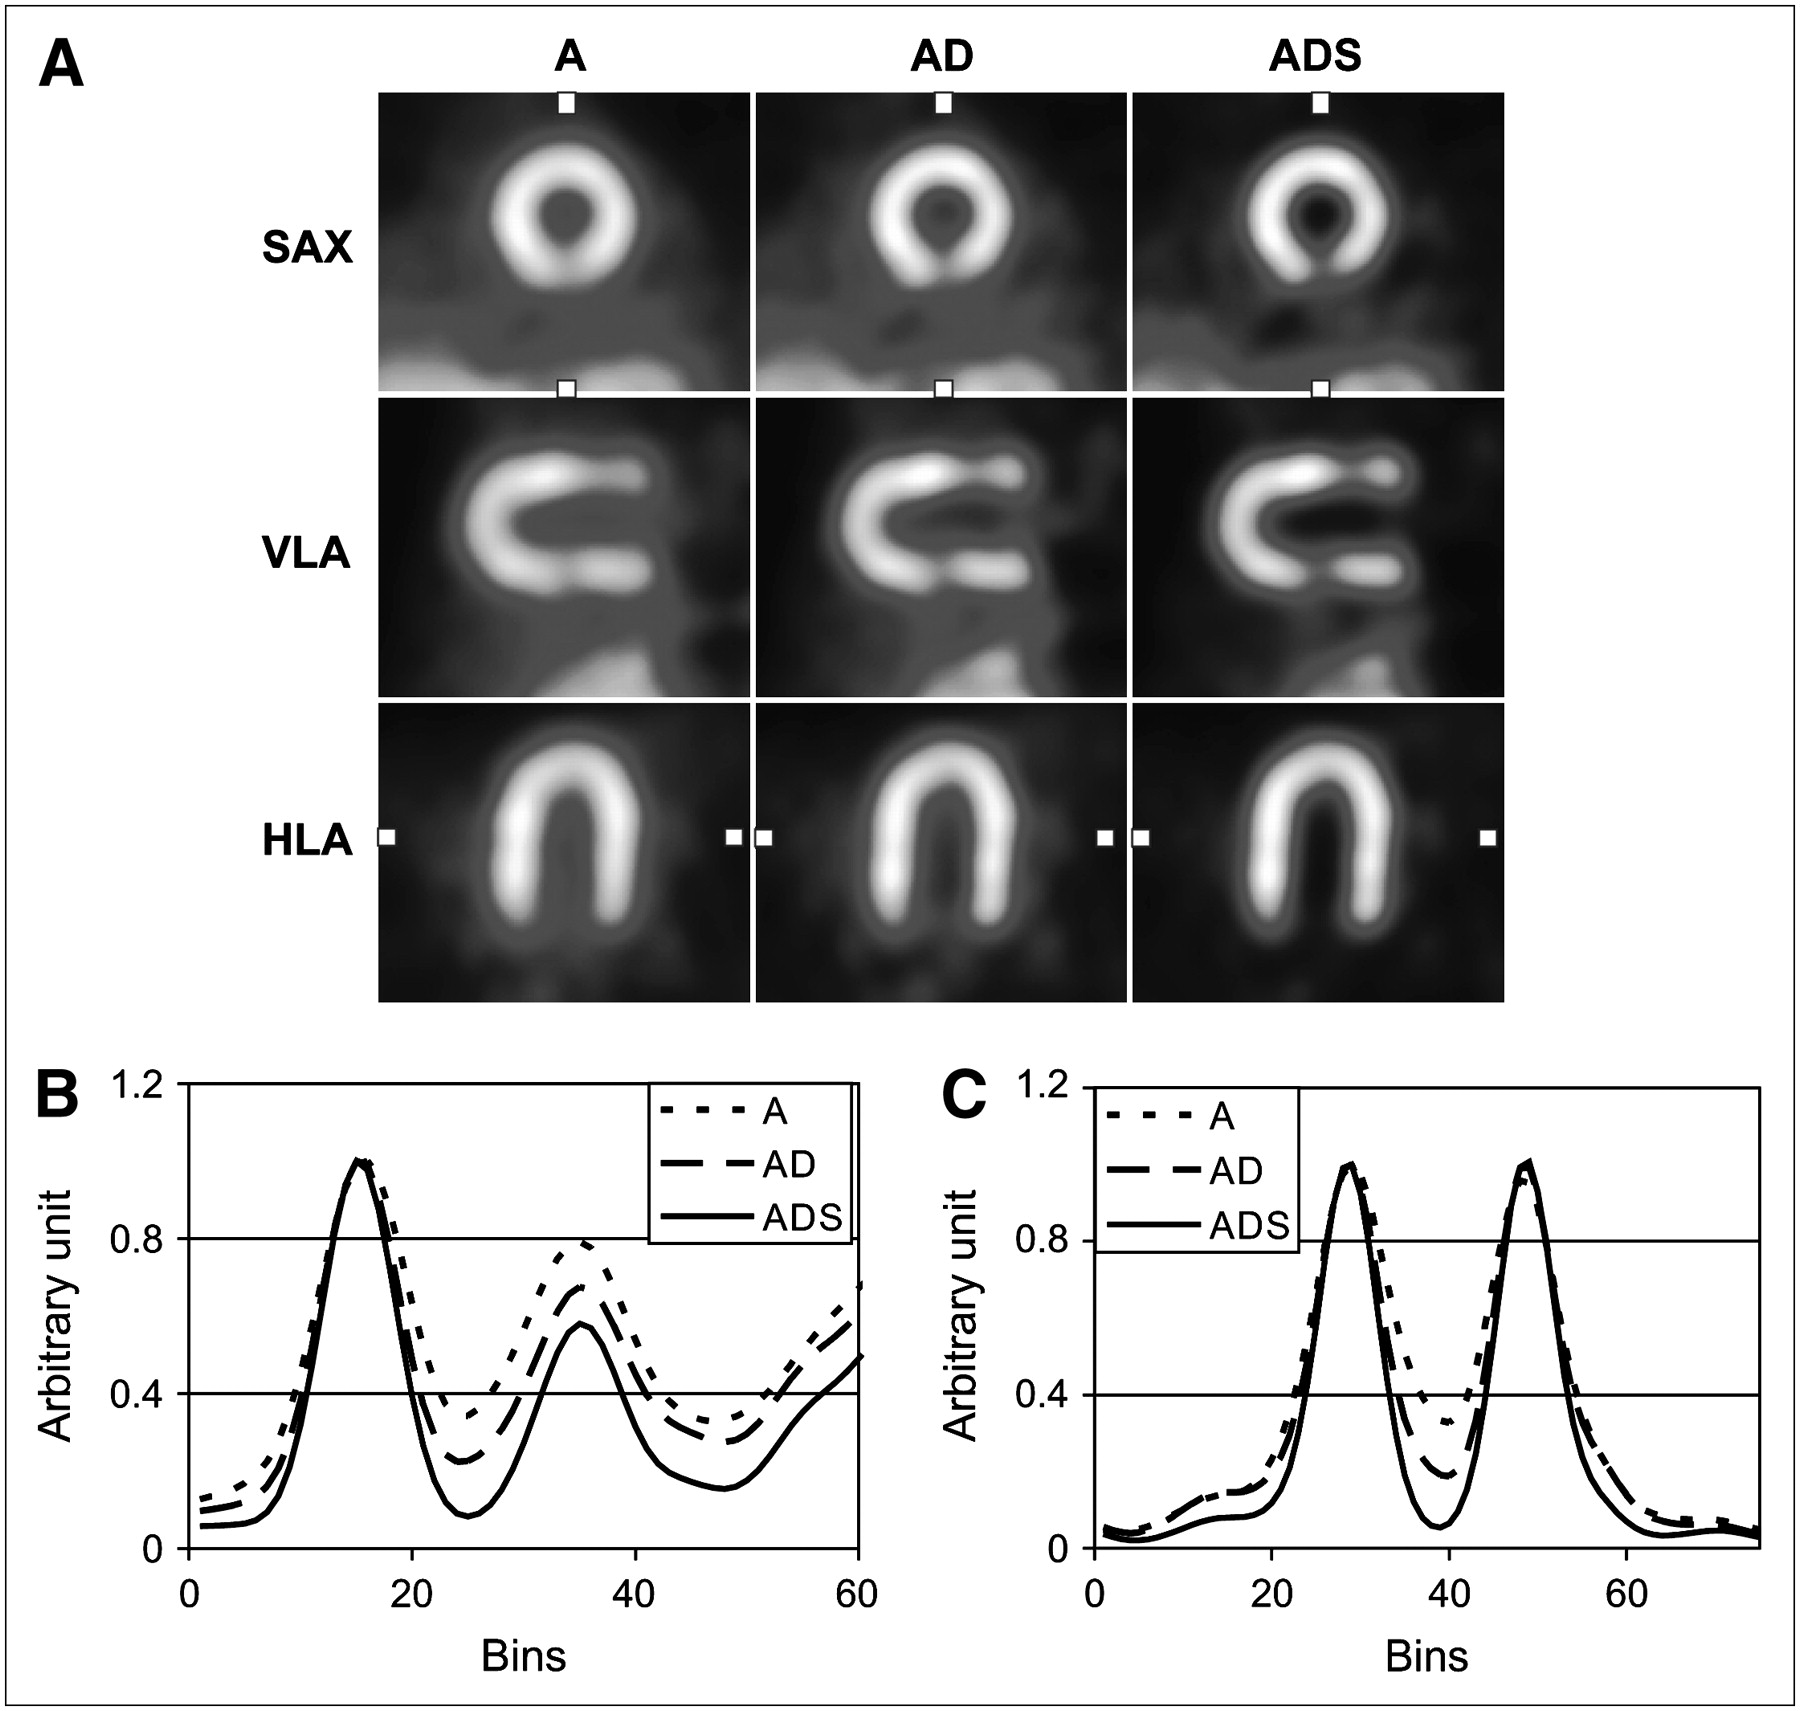
A typical reconstructed myocardium of the large thorax phantom with breasts is shown for each algorithm in Figure 4 at a noise level for which normalized SD is equal to 0.1. The images at this noise level were regarded by nuclear medicine specialists as having a typical noise level in clinics. Short-axis views, vertical-long-axis views, and horizontal-long-axis views are shown. The ADS images provide better visual defect contrast and less scatter contamination from liver activity than do the A and AD images. Vertical profiles through the inferior defect in the short-axis views confirmed that the ADS algorithm gives better defect contrast than do the other 2 methods. In all axial views and in the profiles, we obtained a better contrast between the myocardium and the chambers with the ADS method.

(A) Short-axis (SAX) views of reconstructions at typical noise level (normalized SD, 0.1), corresponding vertical long-axis (VLA) views, and corresponding horizontal long-axis (HLA) views. Two solid defects were placed in the anterior and inferior walls. Boxes in SAX and HLA views mark location of profiles. (B and C) Vertical profiles through inferior defect in SAX views (B) and horizontal profiles through uniformly perfused lateral and septal walls in HLA views (C). Each profile was normalized to its maximal pixel value.
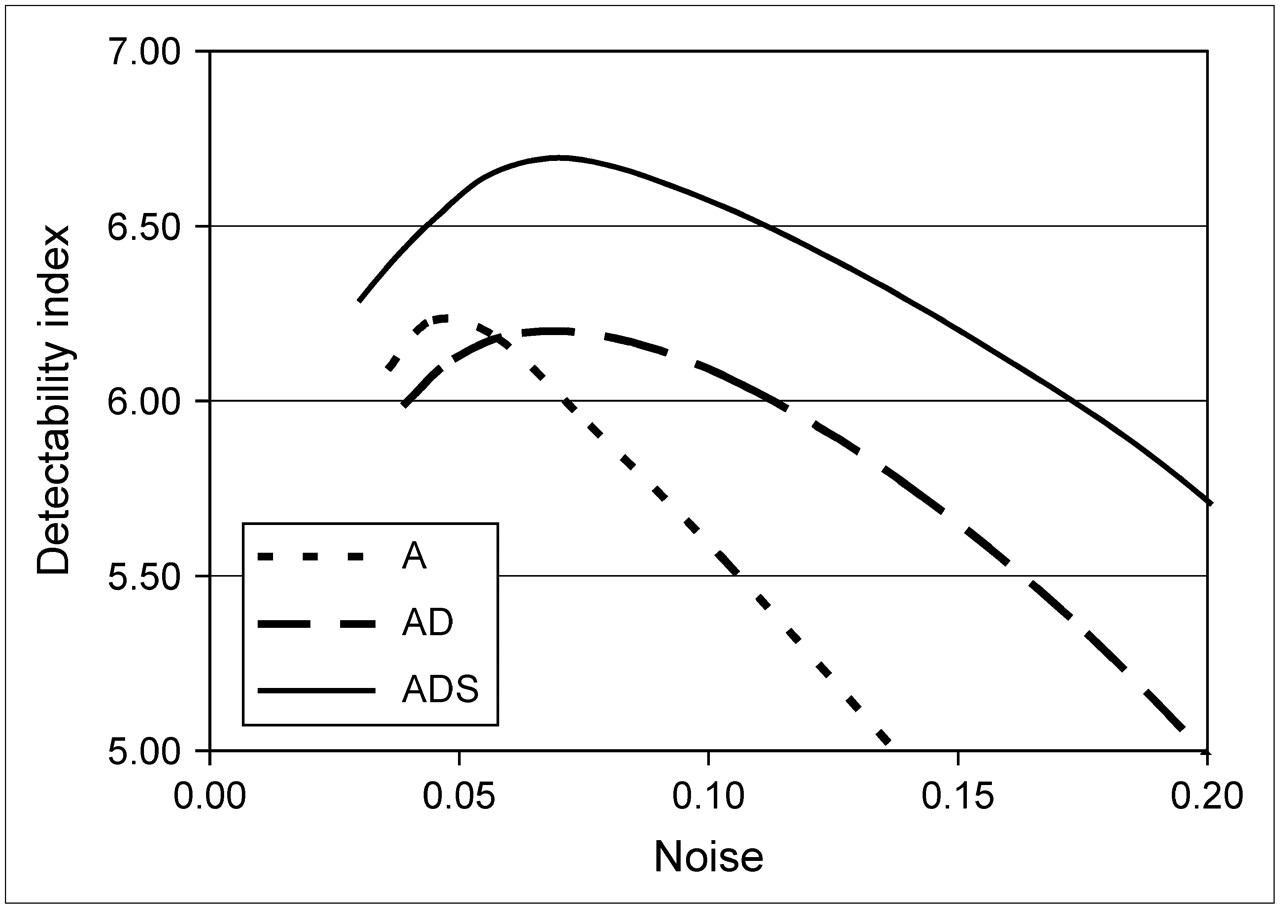
Figure 5 compares contrast-to-noise curves for different reconstruction methods. The noise was varied by changing the kernel size of the 3D gaussian postprocessing filter. For all methods, noise increased with increasing contrast. For each individual phantom configuration, the images reconstructed by the A and AD methods had lower overall contrast when compared at an equal noise level, and had higher noise when compared at an equal contrast level, than did the images reconstructed by the ADS method. The contrast–noise curves in Figure 5 show that the ADS method achieved contrast values that were approximately 10%–24% higher than those obtained with the AD method and 11%–37% higher than those achieved by the A method when compared at an equal noise level. Noise for the ADS method was approximately 27% lower than that for the AD method and 34% lower than that for the A method when comparisons were made at a typical contrast level ( ). Figure 6 shows that, for all phantom configurations, the ADS method provided better contrast separability than did the A or AD method.
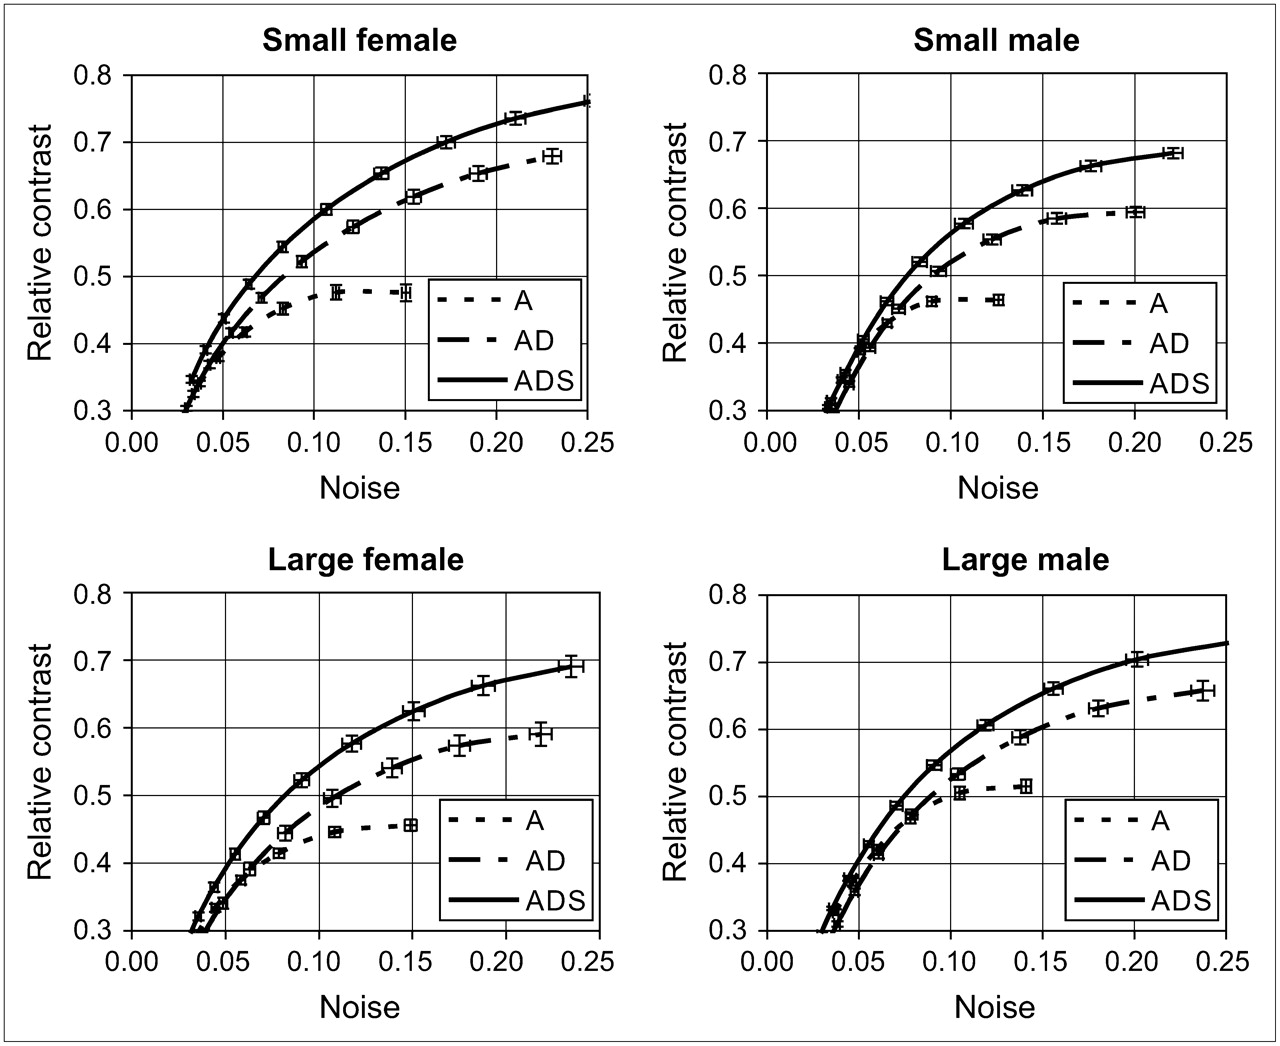
Defect contrast as function of noise in myocardium for each phantom configuration and for the 3 reconstruction algorithms. Error bars represent SE for both noise and contrast.

Comparison of defect contrast separability for the 3 reconstruction algorithms. Here, we compared which method best differentiated hearts with defects from hearts without defects, for all phantom configurations.
The robustness of each method at the noise level corresponding to a normalized SD of 0.1 is shown in Table 1. The smaller the value, the more robust (i.e., the less sensitive) was the algorithm to anatomic variations. Therefore, the ADS method was less sensitive to anatomically induced scatter and attenuation than was the A or AD method and clearly outperformed them in terms of robustness and uniformity. The results of the uniformity measurement at the same fixed noise level as was used for the robustness measurement are also shown in Table 1. The ADS method clearly provided a more uniform image of a homogeneously perfused heart than did the other methods.
Uniformity and Robustness Averaged over All Nondefected Phantom Configurations and All Noise Realizations for the 3 Different Methods
DISCUSSION
In this study, a fully 3D Monte Carlo–based scatter correction method (the ADS method) was compared with two other methods: one applying attenuation correction and resolution recovery (the AD method) and one applying only attenuation correction (the A method). The ADS method outperformed both of the other methods in terms of contrast-to-noise ratio, contrast separability of cold defects, uniformity, and robustness to anatomic variations. The superiority of the ADS method in these quantitative measures may lead to greater accuracy and sensitivity in the detection of coronary abnormalities, potentially avoiding false-negative diagnoses, with their associated downstream economic and health consequences, and false-positive diagnoses, which unnecessarily expose patients to risky interventions.
The 153Gd photons used to acquire the attenuation map in this work may downscatter into the 72-keV 201Tl photopeak window and deteriorate the accuracy of reconstructed images. To assess the severity of this contamination, we measured the number of 153Gd photons downscattered into the 72-keV emission window for the area of the myocardial envelope in the projection of the large thorax phantom without activity. This number was compared with the number of 201Tl photons for the large thorax phantom with the same absolute activities as were used in this work but without opening the two 153Gd line sources. For all projection angles, the number of 153Gd photons downscattered into the 72-keV window was about 0.6 per pixel in the myocardial envelope. The number of detected 201Tl photons in the 72-keV window was about 22 per pixel on average in the same region. Therefore, the contribution of downscattered 153Gd photons to the total detected signal was less than 3%. Our finding agreed well with that of Tan et al. (33), who showed that with a moving line source and a synchronously moved electronic window, cross-contamination from 153Gd to the 72-keV 201Tl window is negligible. We therefore neglected this contamination in our work.
No window-based scatter correction methods were included in the comparisons presented in this paper. The simplest of such methods, the triple-energy-window approach, is not particularly well suited to the complicated energy spectrum of 201Tl. More sophisticated methods would require even more energy windows, which may not be available on many SPECT cameras currently used in the clinic. Moreover, the use of additional windows requires ad hoc determination of scaling and associated filter parameters. Those parameters may change for different imaging situations—for example, for varied sizes of thoraxes. Finally, the use of noisy projections from small scatter windows inevitably amplifies noise in the reconstructed images. This is a serious disadvantage for 201Tl imaging, because it already suffers from much worse noise properties than does 99mTc-based cardiac SPECT.
In our previous work (19), we evaluated Monte Carlo–based scatter correction for 99mTc cardiac perfusion imaging. In that case, in comparison with AD, the use of ADS was found to lead typically to a 14% reduction in image noise when the contrast level was kept fixed. The current study showed that, for 201Tl imaging, significantly more noise is suppressed with Monte Carlo–based scatter correction. Depending on the desired contrast level, noise levels may be 25%–30% lower for ADS than for AD. Because noise levels are known to be higher for 201Tl imaging than for 99mTc SPECT, the substantial reduction of image noise that can be achieved by using Monte Carlo–based scatter correction may become crucial in diminishing the gap in overall image quality between 201Tl and 99mTc cardiac SPECT.
CONCLUSION
For 201Tl SPECT, our results indicate that the Monte Carlo–based scatter correction method yields a much better contrast-to-noise ratio than do the 2 methods that do not correct for scatter. The Monte Carlo–based algorithm also produces images with larger quantitative differences between defect and nondefect cases, shows better uniformity, and is less sensitive to anatomic variations. Although further tests in a clinical setting are necessary, our results indicate that Monte Carlo–based scatter correction may be decisive in improving the quality of 201Tl-based cardiac SPECT. It could thus facilitate further use of 201Tl in clinics, despite ongoing competition from other isotopes, such as 99mTc.
Acknowledgments
This research was supported by Philips Medical Systems, the Dutch Science and Technology Foundation (STW) (grant UGT.6069), the Dutch Organization for Scientific Research (NWO) (grant 917.36.335), and the Fund for Scientific Research–Flanders (FWO).
Footnotes
-
COPYRIGHT © 2007 by the Society of Nuclear Medicine, Inc.
References
- Received for publication October 18, 2006.
- Accepted for publication December 15, 2006.


