


Abstract
Cardiac SPECT images are degraded by photons scattered in the thorax. Accurate correction for scatter is complicated by the nonuniform density and varied sizes of thoraxes and by the additional attenuation and scatter caused by female patients' breasts. Monte Carlo simulation is a general and accurate method for detailed modeling of scatter. Hence, for 99mTc we compared statistical reconstruction based on Monte Carlo modeling of scatter with statistical reconstruction that incorporates the more commonly used triple-energy-window scatter correction. Both of these scatter correction methods were used in conjunction with attenuation correction and resolution recovery. Methods: Simultaneous attenuation, detector response, and Monte Carlo–based scatter correction were implemented via the dual-matrix ordered-subset expectation maximization algorithm with a Monte Carlo simulator as part of the forward projector (ADS-MC). ADS-MC was compared to (i) ordered-subset expectation maximization with attenuation correction and with detector response modeling (AD); (ii) like (i) but with scatter correction added using the triple-energy-window method (ADS-TEW). A dual-detector SPECT system equipped with 2 153Gd scanning line sources was used for acquiring 99mTc emission data and attenuation maps. Four clinically realistic phantom configurations (a large thorax and a small thorax, each with and without breasts) with a cardiac insert containing 2 cold defects were used to evaluate the proposed reconstruction algorithms. In these phantom configurations, we compared the performance of the algorithms in terms of noise properties, contrast-to-noise ratios, contrast separability of cold defects, and robustness to anatomic variation. Results: Noise was found to be approximately 14% lower in the ADS-MC images than in the ADS-TEW and AD images. Typically, the contrast obtained with the ADS-MC algorithm was 10%–20% higher than that obtained with the other 2 methods. Furthermore, compared with the other 2 algorithms, the ADS-MC method was less sensitive to anatomic variations. Conclusion: Our results indicate that the imaging performance of 99mTc SPECT can be improved more by Monte Carlo–based scatter correction than by window-based scatter correction.
SPECT images are degraded by photon attenuation, by detector and collimator blurring, and by the improper detection of scattered photons. These degradations can have a large impact on quantitative accuracy and on clinical diagnosis. First, inadequate correction for photon attenuation is a major cause of false-positive cardiac SPECT perfusion images, because the varying anatomy of patients leads to an undesirable variability in the reconstructed distribution. Correction for nonuniform attenuation can improve the diagnostic accuracy of cardiac perfusion SPECT (1,2). Second, collimator blurring degrades the resolution of SPECT images. Correcting for this effect using accurate models of camera blurring during iterative reconstruction improves the signal-to-noise ratio and resolution (3–5). Finally, the detection of scattered photons results in haziness and degraded quantitative accuracy. The effects of scatter also depend on the patient's anatomy. The use of accurate scatter models during statistical iterative reconstruction improves not only quantitative accuracy but also the signal-to-noise ratio and the detectability of small cold defects (6–10). Several experiments have shown that attenuation, blurring, and scatter all have to be corrected for to optimize clinical SPECT images (2,4,9,11–13).
Accurate modeling of scatter is complex because the shape of the scatter response depends on the location in a patient. To incorporate the scatter characteristics, several authors have proposed various approximate, spatially variant models for scatter correction in iterative SPECT reconstruction (14–19). Most of these models work well in uniform objects but fall short in a highly nonuniform medium such as the thorax. Monte Carlo–based scatter correction is a more general and accurate correction method. Our group has recently developed an accelerated Monte Carlo–based fully 3-dimensional (3D) scatter correction framework based on ordered-subset reconstruction (20). For a typical cardiac acquisition consisting of 64 projections with 64 × 64 binned data, our method can complete a reconstruction (30 iterations with 8 subsets) within 9 min on a stand-alone personal computer with a dual central processing unit (2.66 GHz) (21).
The goal of the present work was to evaluate the effects of 3D Monte Carlo scatter correction on image noise properties and to assess the robustness of this approach to anatomic variations. We therefore compared 3D Monte Carlo scatter correction with window-based scatter correction by performing a series of physical phantom experiments that represented a variety of realistic anatomic configurations.
MATERIALS AND METHODS
Phantom Configurations
Four clinically realistic phantom configurations (Data Spectrum Corp.) were used for our evaluation: a large anthropomorphic thorax (model ECT/TOR/P) and a small anthropomorphic thorax (model ECT/LUNG/P), each with breasts (model ECT/SOL-BR/M) and without breasts (Fig. 1). The lateral and anteroposterior sizes were 38 and 26 cm, respectively, for the large phantom and 31.8 and 23.5 cm, respectively, for the small phantom. Each phantom configuration comprised a cardiac insert (model ECT/CAR/I) representing the left ventricle, 2 lung inserts, a liver insert, and a spine insert. Two solid defects (2 mL for each) were placed in the anterior and inferior walls of the cardiac insert. The 4 phantom configurations were also used without solid defects for the nondefect studies.

Photographs of small thorax phantom (A), large thorax phantom (B), breast attachments (C), and myocardial insert with solid defect set (D). (Images courtesy of Data Spectrum Corp.)
To mimic the uptake ratios that have previously been observed in patient data, we filled the ventricular wall of the cardiac insert with 0.15 MBq of 99mTc-pertechnetate solution per milliliter, the liver with 0.070 MBq/mL, the lungs with 0.015 MBq/mL, and the background with 0.0075 MBq/mL (22).
Measurements
The measurements were performed using a dual-head ADAC Vertex camera (Philips) equipped with Vantage extra-high-resolution collimators (Philips) and with scanning line sources. Each line source contained approximately 5.5 GBq of 153Gd (23). The SPECT system resolution, measured according to the National Electrical Manufacturers Association protocol, was 0.72 cm (1.1 cm) in full width at half maximum for a point source at a distance of 10 cm (20 cm) from the collimator face. A 180° study for simultaneous transmission and emission scans was acquired in 64 projections. Projections were acquired from right anterior oblique (−45°) to left posterior oblique (135°). The acquisition time was 25 s per projection for the emission scan and 24 s for the transmission scan. The total acquisition time for this dual-head system was 13.3 min. The acquisition matrix was 128 × 128 with a pixel size of 4.72 mm for both sets of data. The 99mTc data were measured in the 99mTc photopeak window (140 keV ± 7.5%). Transmission data were collected in a 20% wide energy window centered at 100 keV inside an electronic moving window. An additional energy window centered at 123 keV with a 4% width was used to correct the 99mTc photopeak data for scatter using a triple-energy-window method (24–26). To assess the noise properties of various reconstruction algorithms, we generated 8 noise realizations by sequentially repeating this acquisition 8 times. During the sequential studies, we corrected for decay by adjusting the duration of each acquisition.
Image Reconstruction
Ordered-subset expectation maximization (OS-EM) (27) image reconstruction algorithms with 3 different types of photon transport modeling were compared. Each algorithm included correction for attenuation and detector response (AD), and 2 of them included either Monte Carlo– or triple-energy-window–based scatter correction (ADS).
The AD method models both attenuation and detector response (collimator and intrinsic detector blurring) during reconstruction. Attenuation maps were used to perform nonuniform attenuation correction. We used precalculated point spread function tables that describe the gaussian distance-dependent detector response of a point source in air. The values for the full width at half maximum of the gaussian kernels were calculated on the basis of the geometric collimator resolution and intrinsic detector resolution (28).
For the ADS method in which scatter was estimated using a triple-energy-window method (ADS-TEW), the projections in the scatter window were prefiltered with a Butterworth filter of order 4 and a cutoff frequency of 0.127 cycles/cm (29) to suppress noise amplification in the corrected images. The scatter component was then incorporated by adding it as a background term to the denominator of the OS-EM algorithm.
Fully 3D Monte Carlo–based reconstruction (ADS-MC) (20) was performed using dual-matrix OS-EM (30,31). Attenuation and detector blurring were modeled in the forward projection and the backprojection. Monte Carlo simulation of scatter was used during the calculation of the forward projections (20). The Monte Carlo simulator was accelerated using convolution-based forced detection (28). With convolution-based forced detection, 105 photon paths per subset were found to be sufficient for reconstructions of cardiac perfusion studies (21), and this number was used in this work. Three orders of Compton scatter were generated.
During OS-EM reconstruction, both resolution and noise increase with iterations. The OS-EM reconstructed resolution is also known to be spatially variant. In addition, algorithms using different photon transport models have different convergence speeds, which depend on the activity distribution. Because overiteration followed by postfiltering can lead to more accurate results than does early stopping of the iteration process and ensures a highly homogeneous resolution (32,33), we used a large number of updates (30 iterations with 8 subsets per iteration) to produce images with high resolution but with a higher noise level than would normally be ideal. These images were then filtered with 3D gaussian filters using various kernel sizes. In this way, we obtained a series of images that had a range of noise levels and associated contrast levels. Such a series facilitates the generation of contrast-to-noise curves and enables us to compare the contrast of postfiltered images obtained with different algorithms at an equal noise level.
Attenuation maps were reconstructed using the ordered-subset convex algorithm (34) with 8 subsets and 30 iterations. A 100-keV energy window (100 keV ± 10%) located outside the electronic moving window was used to estimate and correct for the downscatter of 99mTc photons into the 100-keV electronic moving window. To reduce noise, we first filtered the attenuation maps using a 3D gaussian kernel (full width at half maximum, 2.5 pixels). Then, median filtering was applied twice using a 3D cubic kernel of 5 × 5 × 5 pixels.
Accuracy Check on the Forward Projector for ADS-MC
To evaluate the point source response calculated by our Monte Carlo simulator, we performed γ-camera measurements with a 99mTc point source in the center of a water-filled cylinder phantom with a radius of 11.1 cm. The distance between the point source and the collimator surface was 12.9 cm. The profiles of the measured and the simulated point source responses matched perfectly (Fig. 2). The same measurements were also performed with the point source in air. The profiles of the measured and the simulated responses agreed well (Fig. 2).

Comparisons of measured (Meas) and simulated (Simu) point spread functions in water-filled cylinder phantom and in air.
The scatter-to-primary ratio is a sensitive measure of the accuracy of a simulator (35). We measured the scatter-to-primary ratio according to a previously described method (36) and found good agreement between the measured value (0.530 ± 0.008) and the value obtained with the ADS-MC forward projector (0.524).
Assessment of Reconstructed Images
Circumferential Planes.
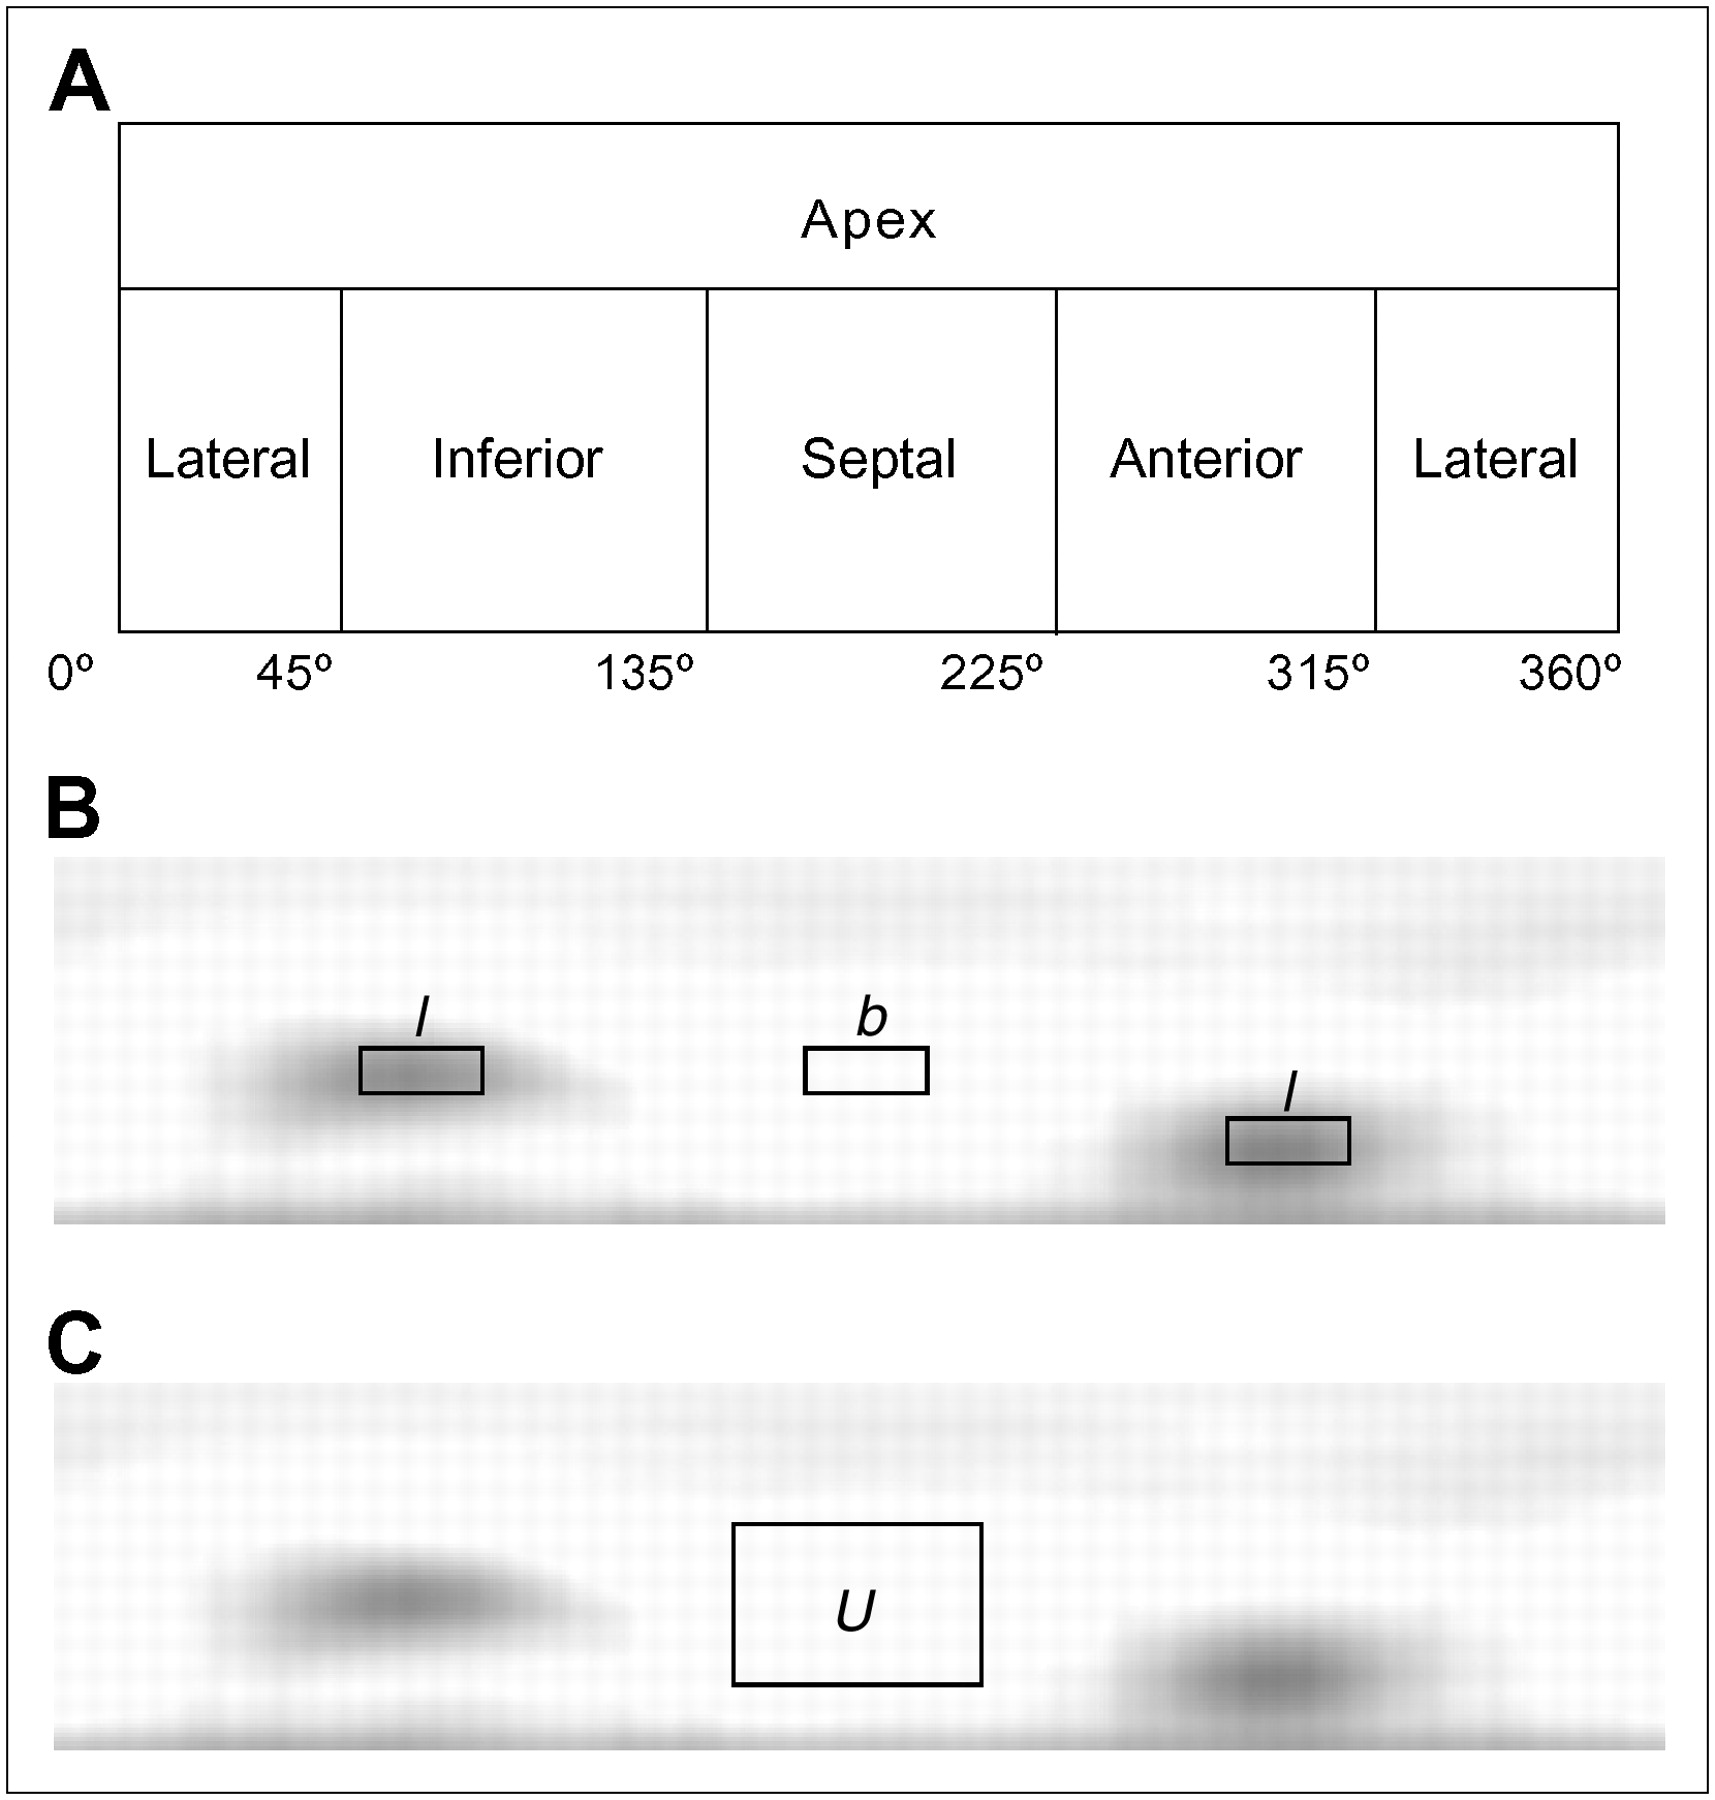
Quantitative analysis was performed using circumferential planes. Such planes are constructed by projecting the maximum-count circumferential profiles onto a rectangular plane (Fig. 3). The anterior, lateral, inferior, and septal walls of the myocardium were sampled cylindrically, and the apex was sampled spherically (37,38). Four-pixel-wide circumferential profiles were taken from the cylindrically sampled myocardial wall in the circumferential plane. This plane was constructed from the average myocardium computed from the 8 noise realizations.

Illustrations of spherically sampled apex and cylindrically sampled myocardial wall in circumferential plane (A), locations of 2 defect regions (l) and background region (b) in circumferential plane (B), and location of region U in circumferential plane (C).
Noise Properties and Contrast.
Two types of contrast are used to assess the images: absolute contrast (Ca) and relative contrast (Cr): Eq. 1where l is the average pixel value in the 2 cold defects located in the inferior and anterior walls, and b is the average pixel value in the background region between the defects. The defect and background regions are drawn on the circumferential plane as illustrated in Figure 3. Photons from surrounding perfused regions are smeared in the defect regions because of the partial-volume effect, limited camera resolution, and scatter; we therefore selected regions of interest 60% of the true defect sizes and centered them at the minimum pixel value within each defect.
To assess the image noise in the myocardium, we reconstructed the projections for 8 different noise realizations and 4 phantom configurations using each algorithm. For each phantom configuration, the mean of the circumferential planes of the 8 noise realizations was subtracted from the circumferential plane of each noise realization. We determined the normalized SD in a uniform region U (Fig. 3) in the subtraction image by averaging the variance over all pixels in the region U and dividing the variance by the mean count in the same region. The normalized SD in the region U with pixels labeled n is given by Eq. 2where
  represents the pixel value within the region U in the subtraction image, N is the total number of pixels in the region, and u is the average pixel value of the region in the circumferential plane of each noise realization. The contrast-to-noise ratio is given by
 Eq. 3
Eq. 3
For each reconstruction algorithm, Cr was calculated as a function of noise level (normalized SD) by low-pass filtering of the images with 3D gaussian kernels of different sizes. For the contrast-to-noise ratio curves, the normalized SD values and contrasts were averaged over 8 noise realizations.
Defect Intensity Ratio.
The performance of scatter compensation methods can also be assessed by calculating the defect intensity ratio: the ratio between the average intensities of the anterior and inferior defects. Because the defect in the inferior wall is close to the 99mTc-perfused liver and is therefore likely to be smoothed by the scattered photons that originate from the liver, the intensity ratio between 2 defects ideally should be 1.0 if scatter from the liver is successfully removed from the inferior defect.
Contrast Separability of Cold Defects.
To assess which method is best for distinguishing defects quantitatively, we used the measure of separability of contrasts. For this measurement, defect reconstructions were aligned with the corresponding nondefect reconstructions. Relative contrast was calculated for both cases on the basis of the background and defect regions that were used for the defect study. The “defect contrast” due to noise and anatomic variation only, which is calculated for the nondefect studies, is called the reference contrast. At an equal normalized SD level (obtained by 3D gaussian postprocessing filtering using various kernel sizes), the collection of defect contrasts is compared with the collection of reference contrasts. The 32 contrasts (4 phantom configurations, each with 8 noise realizations) have a certain mean and an SD. A common figure of merit for assessing how well 2 corresponding classes can be separated is the detectability index d (39): Eq. 4where
  is the mean of Cr within the defect class,
  is the mean of Cr within the reference class,
  is the SD of Cr within the defect class, and
  is the SD of Cr within the reference class.
Equation 4 gives the class separability due to the difference between the class means weighted by the class separability due to the variance of the 2 classes. Here, we assume that contrasts between the defect class and the reference class are uncorrelated. The detectability index d will be plotted against noise level for each reconstruction algorithm.
Robustness.
Variations in anatomy, such as the size of the thorax or breasts, can cause bias in different parts of the reconstructed myocardium if attenuation and scatter are not properly corrected for, potentially resulting in an incorrect diagnosis. Because the same cardiac insert is used for each phantom configuration, one expects to obtain almost identical cardiac profiles among all the phantom configurations when all anatomy-dependent corrections are performed during reconstruction. To measure this ability for different algorithms, we introduce a metric that we call robustness (R). Robustness reflects to what extent anatomic variations influence the reconstructed myocardium; ideally, they should have no influence at all.
For each algorithm, the overall robustness,  , is assessed by calculating the deviation between the circumferential profile of the myocardium without defects for a certain phantom configuration and the mean of the circumferential profiles for all the nondefect phantom configurations: The circumferential profiles from the 2 cases are subtracted. In detail, the circumferential profile of the averaged circumferential plane over 8 noise realizations is first averaged over the longitudinal coordinate (4 pixels wide). The result of the longitudinal averaging will be denoted as
  , where
  represents the angular sample in the polar coordinate system, and i labels 1 of the 4 phantom configurations. The average of
  over all the phantom configurations will be denoted as
  . Then, the difference between the circumferential profiles and their mean is
 Eq. 5
Eq. 5
To determine how these differences  compare with contrast induced by a real defect, we divided the differences by the average absolute defect contrast from the defect studies for that specific algorithm. We define the average absolute defect contrast (AADC) as
 Eq. 6where
  are the absolute contrasts, according to Equation 1, and
  is the average for all 4 phantom configurations with myocardial defects.
Then, the normalized subtraction profiles (NSP) are given by: Eq. 7
Eq. 7
This NSP shows the degree of difference between different circumferential profiles compared with Ca. Next,  is defined as the mean of the absolute value of the NSP for all 4 phantom configurations:
 Eq. 8The overall robustness assesses how severe the anatomy-induced variations in the cardiac profiles are in comparison to defect contrast. To this end, the robustness values of different algorithms are compared at an equal noise level.
We also calculated separately the robustness to the presence of breast attachments,  , for each thorax phantom.
  is calculated in the same way as
  , except that we use different definitions for
  and AADC. The difference in the circumferential profiles between a phantom with breasts (w/) and a phantom without breasts (w/o) is now
 Eq. 9
Eq. 9
The AADC for the influence of breasts is Eq. 10
Then, Rb is given by: Eq. 11
In short, robustness is assessed by comparing NSPs, which are defined as the differences between cardiac profiles of various phantom configurations divided by the AADC (to relate the effects of anatomic variability to the strength of a signal caused by a real defect). The advantage of such a metric over the use of uniformity as a quality measure is that robustness is not affected by the incorrect, almost uniform scatter background components in the heart region. These components do not add relevant information to the image but smooth the myocardium, thereby appearing to improve the uniformity.
RESULTS
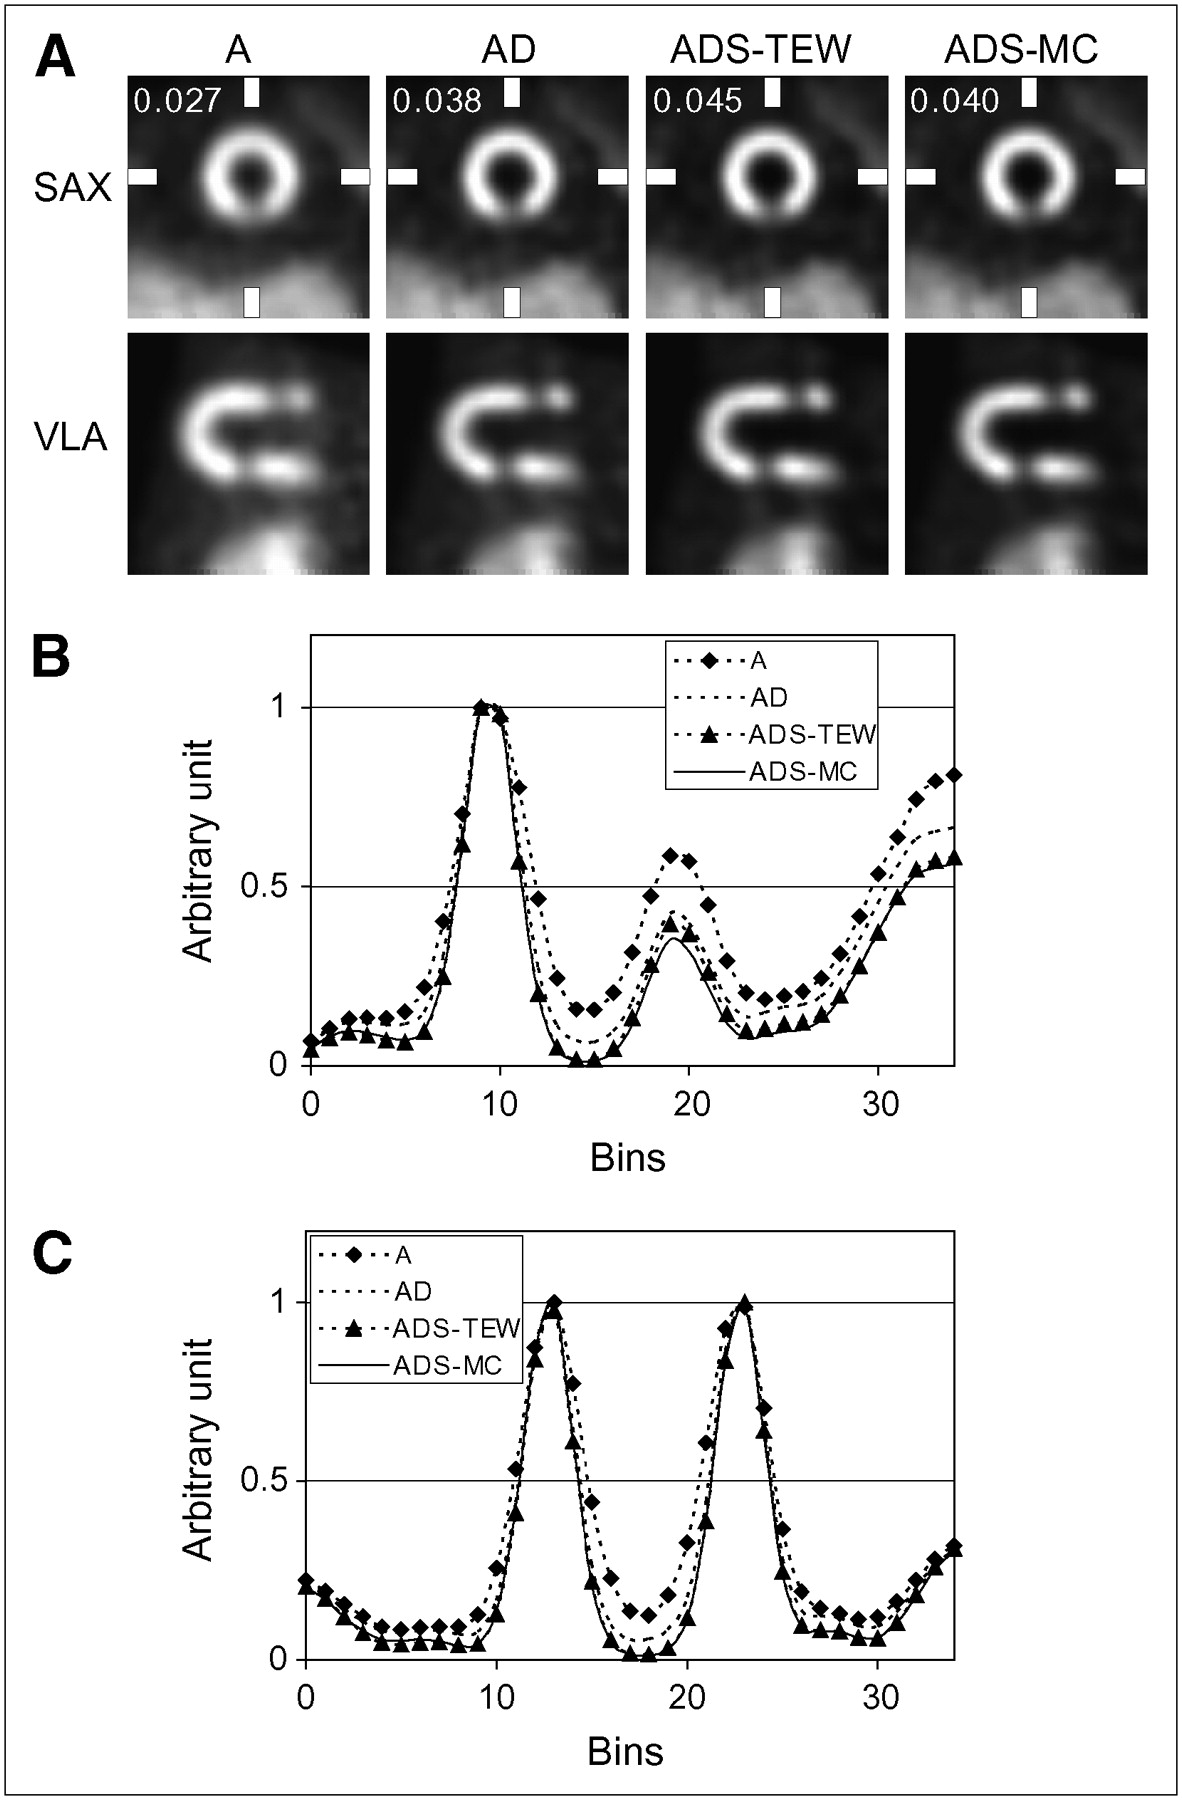
A typical reconstructed myocardium of the large thorax phantom with breasts is shown for each algorithm in Figure 4. Short-axis (SAX) views, their horizontal and vertical profiles, and vertical long-axis (VLA) views are shown. Vertical profiles through the inferior defect show that ADS-MC gives slightly better defect contrast than does ADS-TEW. For comparison, images obtained with OS-EM incorporating only attenuation correction are also presented.

(A) Top row: short-axis (SAX) views of reconstructions, postfiltered by 3D gaussian filter (σ = 0.48 cm). Associated noise level is illustrated in each image. Bottom row: corresponding vertical long-axis (VLA) images. (B and C) Vertical profiles through inferior defect (B) and horizontal profiles (C) in SAX images (each profile was normalized to its maximal pixel value). A = images obtained with OS-EM incorporating only attenuation correction.
Figure 5 compares contrast-to-noise ratio curves for different reconstruction methods. The noise is varied by changing the kernel size of the 3D gaussian postprocessing filter. For all methods, noise increases with increasing contrast. For all phantom configurations, images reconstructed by the AD and ADS-TEW algorithms have lower overall contrast when compared at equal noise and have higher noise when compared at equal contrast than do images reconstructed by the ADS-MC algorithm (Fig. 5). Quantitatively, the contrast achieved with the ADS-MC algorithm is approximately 10%–20% higher, when measured at an equal noise level, than is the contrast achieved with the other 2 methods. Noise is approximately 14% lower for the ADS-MC reconstruction algorithm than for the other 2 methods, when comparison is made at equal contrast. The same trend is also visible in the contrast-to-noise ratio curves of each individual phantom configuration.

(A) Average defect contrast as function of average noise in myocardium for 4 different phantom configurations for different reconstruction algorithms. Error bars represent SE for both noise and contrast. (B) Separate plots for each phantom configuration.
For further quantitative illustration, the Cr averaged over all the phantom configurations and noise realizations is shown in Table 1 for a typical noise level corresponding to a normalized SD of 0.04. Table 1 shows not only Cr based on the average intensity of the 2 defects (Eq. 1) but also Cr based on a single defect, both for the anterior and the inferior defects. The defect intensity ratios at the same noise level as for Cr, averaged over all the phantom configurations and noise realizations, are also shown in Table 1.
Cr Values and Defect Intensity Ratios at a Typical Noise Level (normalized SD = 0.04)
As shown in Figure 6, for all the phantom configurations, the images reconstructed by the ADS-MC algorithm provided better overall contrast separability than did the images reconstructed by the AD and ADS-TEW algorithms.
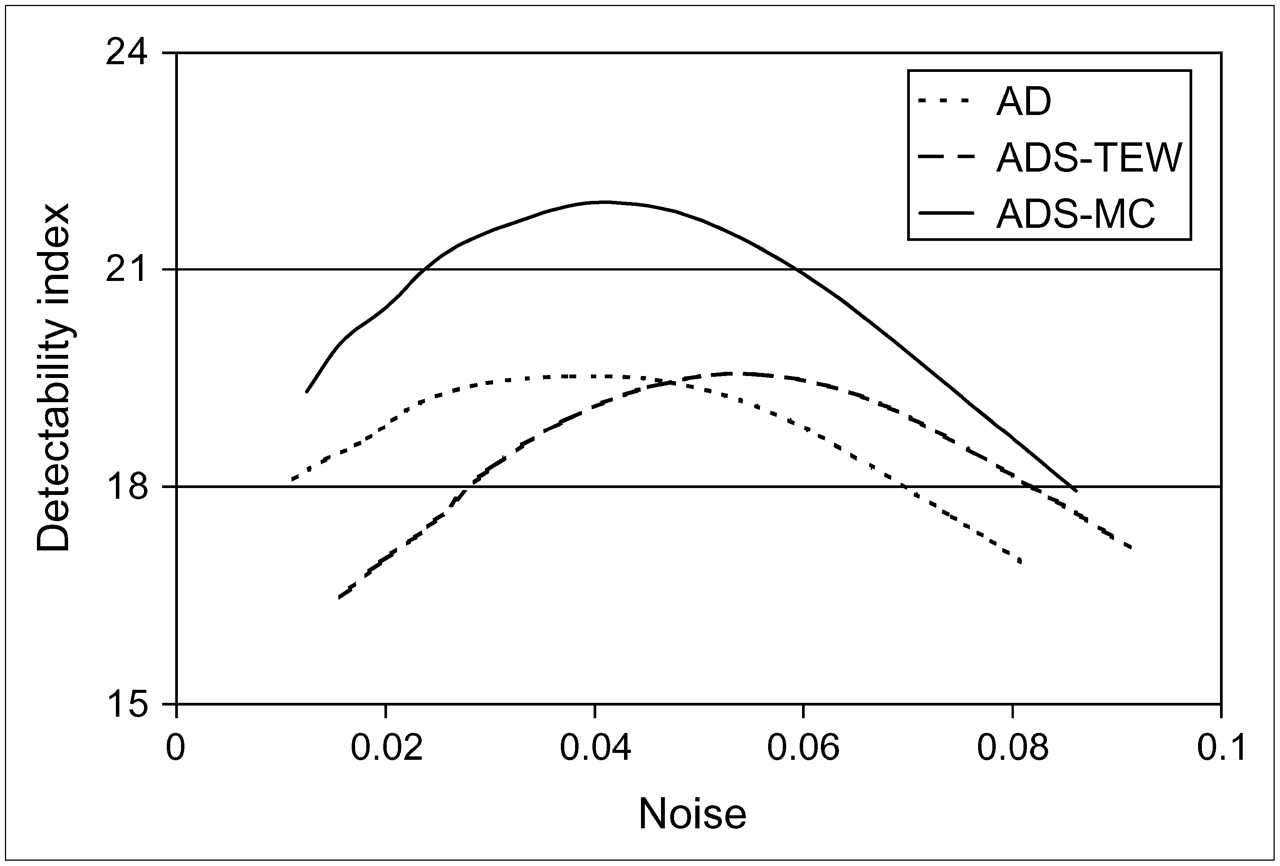
Comparison of the ability of the 3 reconstruction algorithms to differentiate hearts with defects from hearts without defects, for all phantom configurations.
The robustness of each method at the noise level corresponding to a normalized SD of 0.04 is shown in Table 2. The smaller the value, the more robust is the algorithm to the anatomic variations. Therefore, according to both robustness measures (Ro and Rb), ADS-MC is less sensitive to anatomically induced scatter and attenuation than are AD and ADS-TEW.
Robustness for Small and Large Thorax Phantoms and for Each Reconstruction Algorithm
DISCUSSION
In this study, the ADS-MC method was compared with the ADS-TEW method and with the AD method. ADS-MC was found to outperform the other methods in contrast-to-noise ratio, contrast separability of cold defects, and robustness to anatomic variations. For 99mTc cardiac imaging, the main advantages of ADS-MC over ADS-TEW are its superior noise properties. This partially explains why, of the 2 scatter-correction algorithms, only ADS-MC showed an improvement in contrast over AD when the comparison was made at a fixed noise level. The ADS-TEW method did also correct for scatter and increase the defect contrast, but these effects were achieved at the cost of higher image noise than was found for ADS-MC. When the AD and ADS-TEW images were compared at equal blurring widths (Fig. 4), the ADS-TEW images showed better defect contrast than did the AD images. However, because the ADS-TEW images have more noise, more blurring has to be performed on the ADS-TEW images than on the AD images to equalize their noise levels. As a consequence, when compared at an equal noise level (Fig. 5), the ADS-TEW method does not produce better contrast than the AD method.
Table 1 shows that the mean defect intensity ratios of the ADS-TEW and ADS-MC methods are closer to 1 than is the mean defect intensity ratio of the AD method. This finding indicates that scatter is successfully removed by both methods. However, the differences among these 3 methods are not statistically significant. This insignificance may be explained by the fact that not much scatter from the liver reaches the inferior defect, because of the liver-to-inferior-defect distance that was chosen. Although the heart-to-liver distance was set to a typical clinically realistic distance of 1.2 cm, the inferior defect is not located at the spot in the inferior wall that is closest to the liver (Fig. 4).
Attenuation maps acquired with moving line sources, which are currently widely used in clinics, are suboptimal in noise and resolution and are sensitive to downscatter from 99mTc. Nevertheless, to remain as close as possible to clinical reality, we evaluated our Monte Carlo method using such a suboptimal attenuation map. This use may have caused a mismatch between the Monte Carlo forward-modeled projections and the measured projections, possibly explaining the noticeable increase in  between the small and the large thorax phantoms in Table 1 for ADS-MC only and not for the other 2 methods. Better attenuation maps may improve attenuation and Monte Carlo scatter correction, because iterative reconstruction is sensitive to the quality of the attenuation map (40).
Our study was based on physical phantom experiments, which are time and labor consuming and allow for the imaging of only a limited set of phantom configurations. An alternative would be to use digital phantoms, which would allow for straightforward inclusion of a beating heart and for the simulation of an almost unlimited number of anatomic and uptake variations. A drawback of a simulation study based on digital phantoms is, however, that some aspects of the image formation process—for example the detector response, camera electronics, camera orbits, and use of nonideal attenuation maps—may be neglected or simplified. An advantage of the physical phantom studies, such as the one presented here, is that no simplifications are made with respect to the SPECT system.
ADS-MC is more time consuming than ADS-TEW, although the 9 min of reconstruction time required by ADS-MC for 64 cubic data may already be acceptable in some clinics. Nevertheless, ADS-MC has good scalability and can be sped up almost linearly with the number of processors available. With the help of both parallelization and code optimization, we expect that within the next few years reconstructions will take less than a minute.
CONCLUSION
Our results indicate that, for 99mTc SPECT, ADS-MC yields a better contrast-to-noise ratio than does ADS-TEW. ADS-MC also produces images with larger quantitative differences between defect and nondefect cases and shows less sensitivity to anatomic variations than does ADS-TEW or AD. The next step in the evaluation of our Monte Carlo scatter correction scheme is to move to clinical studies, including the assessment of human observer performance. This step should allow us to address several limitations of this study, such as the inclusion of only a limited range of anatomic variations and the lack of uptake variations and respiratory and myocardial motions. Because image quality metrics used in this work are based on basic image properties such as noise and contrast, they are not directly linked to the performance of human observers in complex clinical tasks. Tests in a clinical environment are therefore necessary. Nevertheless, our results indicate that Monte Carlo–based scatter correction certainly deserves the attention of the medical community, because the method may lead to improvements in cardiac diagnosis.
Acknowledgments
This research was supported by the Dutch Science and Technology Foundation (grant UGT.6069), the Dutch Organization for Scientific Research (grant 917.36.335), and Philips Medical Systems. We thank Wojtek Zbijewski for constructive comments.
Footnotes
-
COPYRIGHT © 2006 by the Society of Nuclear Medicine, Inc.
References
- Received for publication September 20, 2005.
- Accepted for publication June 26, 2006.


