


Abstract
Intramedullary apoptosis of hematopoietic tissue is believed to play a major role in the pathophysiology of myelodysplastic syndrome. Annexin V, a specific marker of the early to intermediate phases of apoptosis, has been applied to the in vitro study of bone marrow aspirates. A noninvasive measure of intramedullary apoptosis in vivo that could serially monitor the clinical progression of myelodysplastic syndrome may be helpful. Methods: We used 99mTc-radiolabeled annexin V and radionuclide gamma camera imaging to serially study the sites, extent, and severity of intramedullary apoptosis induced by cyclophosphamide treatment. Results: Intravenously administered radiolabeled annexin V localized preferentially in the femur, pelvis, vertebrae, and spleen; increased uptake in these organs was easily visualized as early as 8 h after injection of 100 mg/kg cyclophosphamide in 8- to 10-wk-old animals. Higher doses of cyclophosphamide (150 mg/kg) in animals of the same age increased annexin V uptake in the bone marrow and splenic tissue and delayed recovery of these organs as seen histologically compared with lower doses. Older animals, 5–6 mo old, showed a slower response to cyclophosphamide treatment and delayed recovery of bone marrow and splenic tissues. Conclusion: Radiolabeled annexin V can be used to detect and directly quantify the degree of intramedullary and splenic apoptosis in a noninvasive fashion using current clinical radionuclide imaging equipment. Annexin V imaging may be useful clinically in the diagnosis and management of myelodysplastic syndrome.
Increased rates of intramedullary apoptosis have been reported in a variety of bone marrow disorders, including, myelodysplasia (1–9), aplastic anemia (10), Fanconi’s anemia (11), and α- and β-thalassemia (12). These diseases are usually investigated with bone marrow aspiration or biopsy to make a definitive diagnosis. We recently described a radionuclide imaging technique to detect apoptosis in vivo using annexin V (14), a human protein commonly labeled with fluorescent markers for in vitro detection and quantification of apoptotic cells (15,,16). Radionuclide images of sites of apoptotic cell death can be recorded in vivo after intravenous administration of radiolabeled annexin V.
Annexin V has a reversible, strictly calcium-dependent, nanomolar affinity for the membrane aminophospholipid, phosphatidylserine (PS) (15). PS comprises 10%–15% of the total phospholipid content of plasma cell membrane and is normally restricted to the inner leaflet of the plasma membrane lipid bilayer by an adenosine triphosphate–dependent translocase (17,18). However, with the onset of apoptosis, PS is rapidly redistributed onto the cell surface (19). The number of annexin V binding sites per cell with the onset of apoptosis increases 100- to 1,000-fold during apoptosis, reaching values of 3–4 million in some cell lines (20,21). PS exposure on the cell surface closely follows caspase-3 activation and occurs well before DNA fragmentation (22). Annexin V, therefore, is a sensitive marker of the early to intermediate phases of apoptosis.
Apoptosis has been imaged in vivo after intravenously administered radiolabeled annexin V in experimental models of apoptosis induced by anti-Fas antibody (Jo2) (13) and alloreactive T lymphocytes in the course of acute transplant rejection of the heart (23), liver (24), and lung (25). During our imaging investigation of the effects of chemotherapy on experimental murine tumors we also observed an increase in the localization of radiolabeled annexin V within the bone marrow (13). This observation suggested that intramedullary apoptosis could be evaluated with annexin V imaging.
The current study was undertaken to compare the degree of annexin V uptake with the induction of apoptosis in the rodent bone marrow and spleen after a single dose of cyclophosphamide. We also studied the effects of age and dose on the time course of annexin V uptake within these organs. Our results indicate that radiolabeled annexin V may provide noninvasive serial assessments of cell death in the bone marrow and spleen using existing protein radiolabeling and imaging technologies.
MATERIALS AND METHODS
Animal Model
Young male (150–200 g; 8–10 wk old) and older male (350–450 g; 5–6 mo old) Sprague-Dawley rats (Simonsens, Gilroy, CA) were housed and treated in a humane manner in accordance with institutional guidelines for animals. Young males were treated with one dose of 100 or 150 mg/kg cyclophosphamide (Sigma, St. Louis, MO) reconstituted in 1 mL physiologic phosphate-buffered saline (PBS) injected intraperitoneally. Older males were treated with a single dose of 100 mg/kg cyclophosphamide injected intraperitoneally. All animals were killed immediately after imaging at 8, 24, and 72 h after injection of cyclophosphamide for biodistribution or scintillation well counting assay. Control animals for each experimental group did not receive cyclophosphamide and were imaged and killed within 24 h of experimental animals.
Preparation of 99mTc-HYNIC–Annexin V
Human annexin V (molecular weight, 35,806) was produced by expression in Escherichia coli as described (26); this material retains membrane-bound PS binding activity equivalent to that of native annexin V. Derivatized hydrazinonicotinamide (HYNIC)–annexin V was prepared as described without affecting membrane-bound PS activity (13). Derivatized HYNIC–annexin V was radiolabeled with a [99mTc]tricine precursor complex according to Larsen et al. (27). After chelation with the [99mTc]tricine precursor complex, the volume of the reaction mixture was brought to 1 mL with PBS, pH 7.4, and collected in 1-mL fractions eluted from a Sephadex G-25 column (Pharmacia, Piscataway, NJ). Fractions 3 and 4 contained 70%–80% of total derivatized protein and 95.7%–99.4% of total 99mTc activity as determined by previously described methods (28). The pool of fractions 3 and 4 had a radiopurity of 92%–97%, determined by instant thin-layer chromatography using 0.9% PBS as a solvent. The radiolabeled material prepared as above had calculated specific activities ranging from 3.7 to 7.4 MBq/μg protein.
Radionuclide Imaging
Animals were injected in the tail vein with 18.5–37 MBq (0.5–1 mCi; 20–40 μg/kg protein) radiolabeled annexin V 1 h before radionuclide imaging and killing. At the time of imaging rats were sedated with a mixture of 80 mg/kg acepromazine and 40 mg/kg ketamine injected intramuscularly. A Technicare 420 mobile scintillation camera (Technicare; Solon, OH) equipped with a low-energy, high-resolution, parallel-hole collimator was used to record the 99mTc-HYNIC–annexin V distribution. Data were recorded using a 20% window centered on the 140-keV photopeak of 99mTc into a 256 × 256 matrix of a dedicated computer system for digital display and analysis (ICON; Siemens, Hoffman Estates, IL). All images were recorded for a preset time of 10 min.
Image Analysis
Region-of-interest (ROI) image analysis was performed to determine relative counts in one femur (corrected for background in the adjacent soft tissue of the thigh) in comparison with that of the whole body. The result was expressed as the percentage of the whole-body activity.
Scintillation Well Counting
Samples were weighed and then counted in a Cobra II γ counter (Packard Instrument Company, Meriden, CT). The energy windows were set at a lower level of 120 keV and an upper level of 170 keV for 99mTc for the counting of annexin V activity. Standards of 1% of injected activity (1 mL in a 100-mL dilution of injected dose) were counted along with samples from each subgroup of animals. Data were recorded as percentage injected dose/gram (%ID/g) of tissue corrected for background and decay.
Histologic Analyses
Whole femurs and spleens from each animal were placed in 10% phosphate-buffered formalin before scintillation well counting. Fixed specimens were then decalcified (i.e., only the femur) using standard media and embedded in paraffin; 5-μm histologic sections were obtained subsequently and stained with hematoxylin and eosin for microscopic analysis.
Statistical Analyses
All variables were expressed as average values ± SDs. All statistical comparisons of average values were performed with the Student t test (two tailed) for significance using the null hypothesis. Linear correlation coefficients were calculated using a least-squares linear regression analysis. The significance of the linear correlation was calculated using the null hypothesis with ρ (slope) = 0, n − 2 degrees of freedom, the t-distribution, and a two-tailed test of significance. P < 0.05 was considered significant.
RESULTS
ROI Analysis and Scintillation Well Counting of Femur Activity
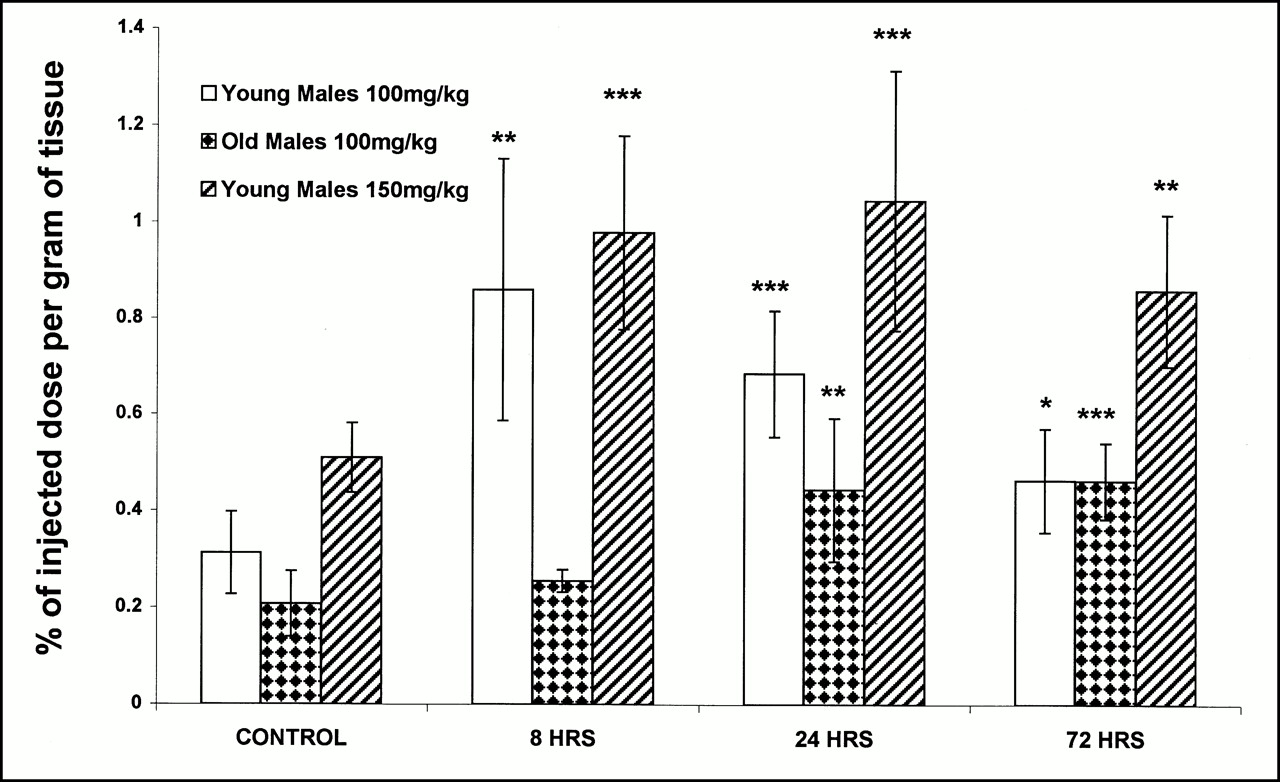
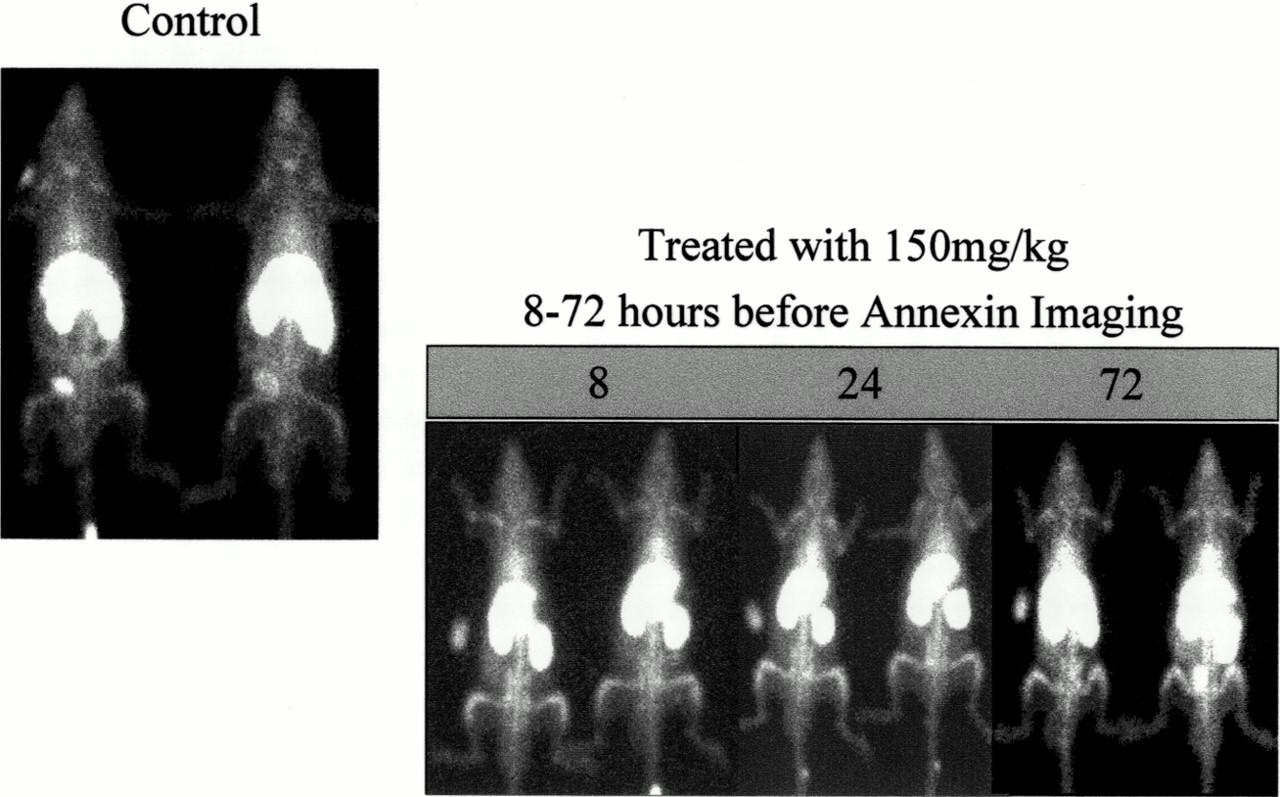
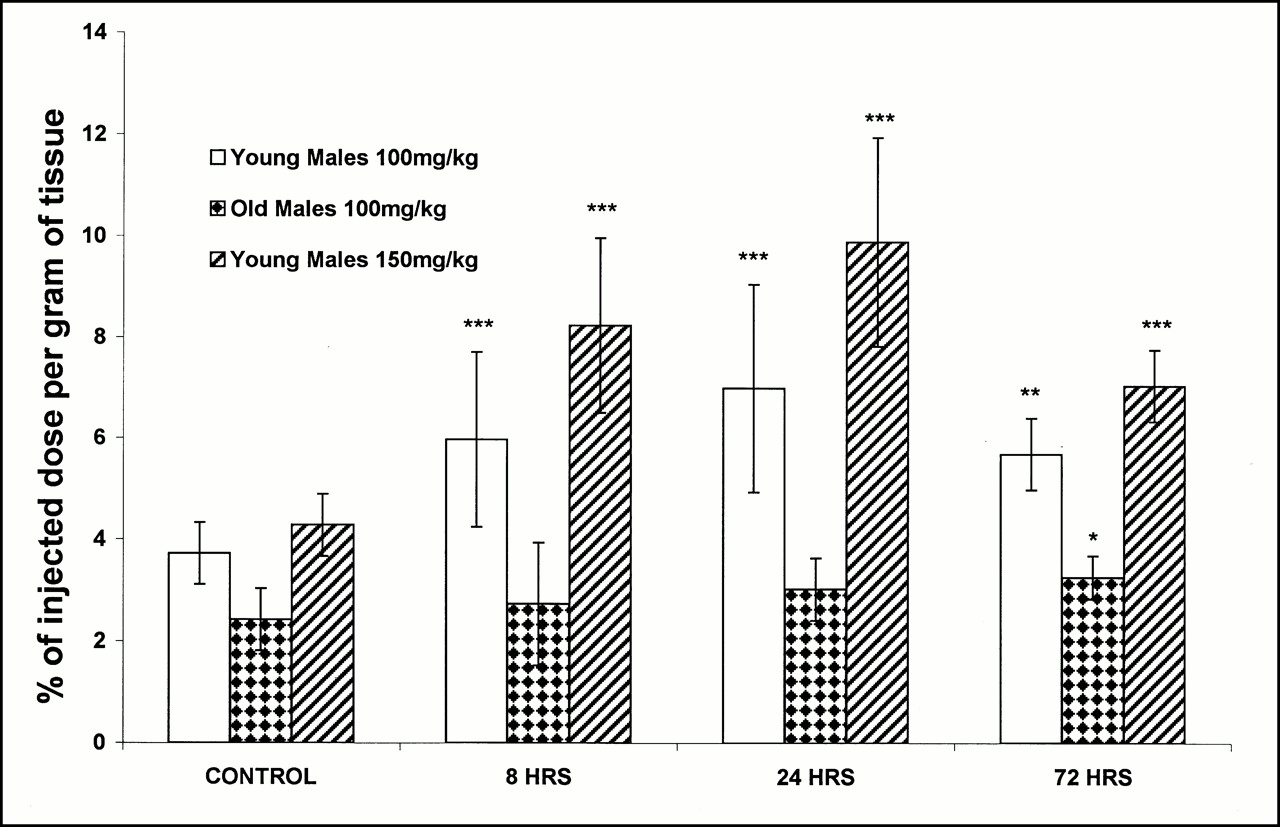
Control ROI values were comparable in all three groups, although there was borderline, but not significant (P = 0.0615), elevation in annexin V femoral uptake in older animals (Fig. 1). Eight hours after treatment, young adult rats had highly significant (P < 0.005) elevations of femoral annexin V uptake (as seen by ROI analysis) of 58.2% and 105.9% above control animals in the 100 and 150 mg/kg cyclophosphamide groups, respectively. Increased annexin V uptake in the femurs, pelves, and vertebrae was also readily visualized on the scintigraphic images of young adult rats 8 h after treatment (Fig. 2). At 24 h, femoral annexin V uptake reached plateau values of 60% and 122% above control activity in the 100 and 150 mg/kg young adult groups, respectively, after which there was a recovery toward control values. The fall in femoral annexin V uptake at 72 h was significantly less rapid in the 150 mg/kg young adult group compared with that of the 100 mg/kg group (104% vs. 42% above control values, respectively; P < 0.0005).

ROI image analysis of femoral uptake of radiolabeled annexin V. Bar graph of femoral annexin V uptake seen at radionuclide imaging is shown. Horizontal axis represents time after injection of cyclophosphamide of each group of animals. Vertical axis represents percentage of whole-body activity for one femur per animal averaged for each time point for each of three treatment groups. Student t tests compared controls and each time point after treatment separately for three groups of experimental animals: *P < 0.05; **P < 0.005; ***P < 0.0005. Error bars represent ±1 SD of mean value at each time point.

Annexin V images of treated animals. Representative annexin V radionuclide images of animals from time course of young rats treated with 150 mg/kg cyclophosphamide injected intraperitoneally. Rats were imaged in supine posterior projection using 10-min acquistions, 256 × 256 imaging matrix, parallel-hole, high-sensitivity collimation 1 h after intravenous injection of 18.5–37 MBq (0.5–1.0 mCi) radiolabeled annexin V. Standards (1/100 of injected activity) were placed adjacent to right flank of each pair of animals during image acquisition.
The time course of femoral annexin V uptake as seen by ROI analysis in old adults was markedly different from that of young animals receiving the same dose of cyclophosphamide (i.e., 100 mg/kg). Peak annexin V uptake occurred at a later time in the older animals. At 8 h, annexin V uptake increased only 9% above control values. Annexin V uptake reached a plateau between 24 and 72 h, 43% and 46% above control values, respectively. However, the absolute average values of femoral annexin V uptake in older animals at 24 and 72 h were significantly greater than those of younger adults also receiving 100 mg/kg cyclophosphamide, as shown in Figure 1 (P < 0.005 and P < 0.0005, respectively).
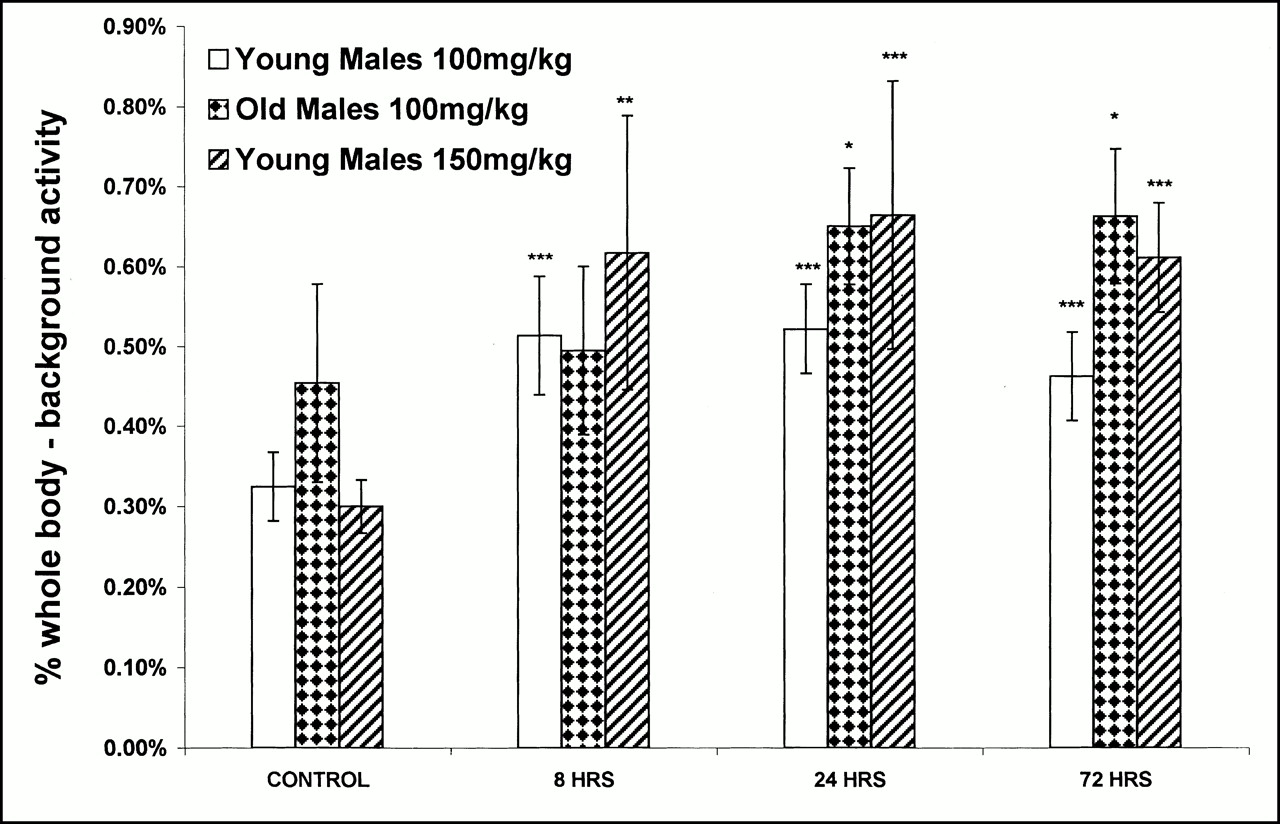
Femoral annexin V uptake, observed by ROI analysis, correlated with the well counting data presented in Figure 3. The 100 and 150 mg/kg young animals and the 100 mg/kg old rat groups had linear regression correlation coefficients of r = 0.639 (P < 0.005; n = 23), r = 0.863 (P < 0.0005; n = 21), and r = 0.544 (P < 0.01; n = 21), respectively.
Change in annexin V biodistribution with treatment. Time course of uptake of radiolabeled annexin V as determined by scintillation well counting of femurs is represented by bar graph for each of three treatment groups. Vertical axis represents percentage injected activity from one femur of each animal per gram of femoral weight. Student t tests compared controls and each time point after treatment separately for three groups of experimental animals: *P < 0.025; **P < 0.005; ***P < 0.0005. Error bars represent ±1 SD of mean value at each time point.
Histologic Study of Treated Bone Marrow
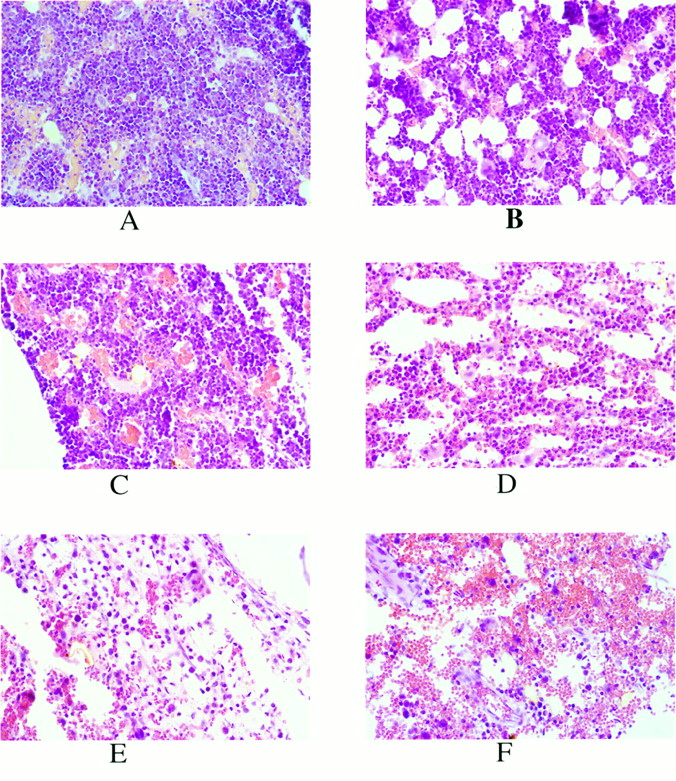
The number of rats studied at each dose and time point is shown in Table 1. Young adult control animals had highly cellular marrow with homogeneous nuclei and few red blood cells (RBCs) with little to no fat (<10% of total marrow volume) as shown in Figure 4. Older adult control animals had decreased cellularity compared with that of young control animals with more fat (>10%) and RBCs. Eight hours after therapy all groups showed mild decreases in marrow cellularity predominately affecting mononuclear cells, scattered hemorrhages with dilation of sinusoids, and mild cellular atypia. By 24 h, there was a marked marrow hypocellularity affecting mononuclear cells to a greater degree than RBC precursors, although both cell lineages showed marked nuclear atypia and fragmentation characteristic of apoptosis. Apoptotic changes at 24 h were also associated with further increases in sinusoidal dilation and hemorrhage. At 72 h, marrow from all groups was hypocellular with dilated sinusoids and variable degrees of fibroblast proliferation, hemorrhage, and cellular atypia.

Histologic changes of bone marrow with treatment. Representative 5-μm histologic sections of coronally oriented decalcified bone marrow specimens are shown (hematoxylin and eosin, ×40). Femurs of young adult animals at 0 h (A), 8 h (C), 24 h (D), and 72 h (E) after cyclophosphamide treatment (100 mg/kg intraperitoneally). Femurs of older adult animals at 0 h (B) and 72 h (F) after cyclophosphamide treatment (100 mg/kg intraperitoneally). Note hypercellularity of young (A) compared with older (B) control rats in which there was markedly more adipose tissue and RBCs. At 8 h (C) and 24 h (D), there was progressive decrease in marrow cellularity affecting white blood cell nuclei with increasing atypia and nuclear fragmentation (apoptosis) and areas of hemorrhage of both groups. At 72 h, bone marrow of young animals (E) was markedly hypoplastic with few white blood cells (normal in appearance) and fibroblasts seen against backgound of RBCs. In contrast, older animals (F) had marked fatty fibrotic changes in hypoplastic marrow with numerous RBCs.
Treatment Group Sizes
Time Course of Splenic Uptake of Annexin V
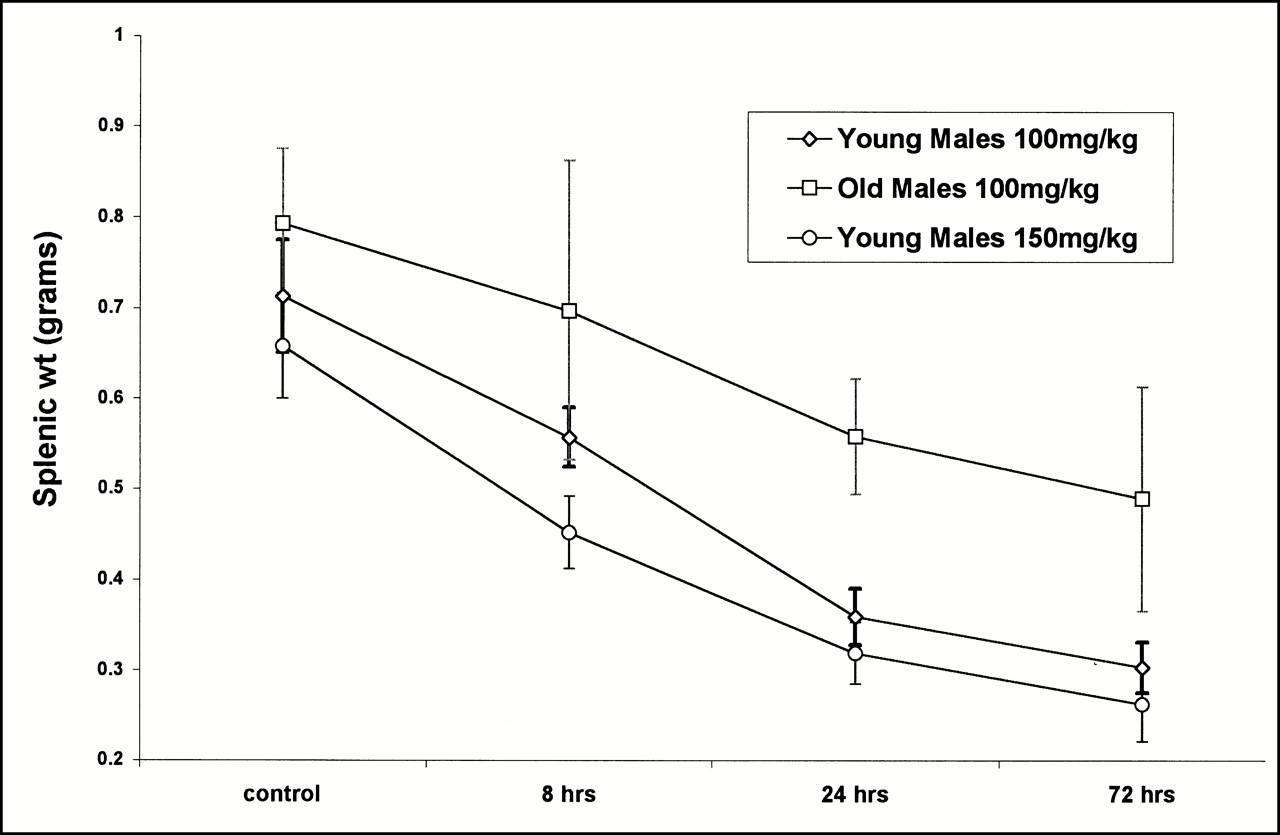
Because the rat spleen was superimposed over the left kidney on radionuclide imaging, the time course of annexin V activity of the spleen was obtained solely from well counting data (Fig. 5). Average splenic weights in young rats decreased after treatment (∼50% of control values 24 h after treatment) as shown in Figure 6. The young adult 100 and 150 mg/kg treatment groups also had highly significant (P < 0.0005) increases in the specific activity of the spleen as early as 8 h after cyclophosphamide treatment (60.4% and 92.1% of control specific activities, respectively). Specific activity within these groups peaked at 24 h; this was followed by a trend toward control values at 72 h. These groups also had parallel decreases in splenic weight at 8 and 24 h after treatment but remained at <50% of control values at 72 h.

Change in splenic uptake of annexin V. Well counting data of annexin V uptake of spleen expressed as percentage injected activity per gram of splenic tissue for each of three groups of experimental animals are shown. Student t tests compared controls and each time point after treatment separately for three groups of experimental animals: *P < 0.025; **P < 0.005; ***P < 0.0005. Error bars represent ±1 SD of mean value at each time point.

Change in splenic weight (wt) after treatment. Average weights ± SDs of each experimental group after cyclophosphamide treatment are plotted. Error bars represent ±1 SD of mean value at each time point.
Old adult rats treated with 100 mg/kg cyclophosphamide had a markedly different time course with no significant rises in splenic activity or decreases in weight at 8 h (12.5% above and 87.9% of control values, respectively). At 24 h, there was a modest increase of 24.5% in splenic activity and a fall in splenic weight to 70.4% of control values. At 72 h, there was a further increase in splenic activity (34% of control) and a decrease in weight (61.7% of control values).
Histologic Study of Treated Splenic Tissue
The red and white splenic pulp was sharply demarcated in control animals of all groups as shown in Figure 7. At 8 h, all three groups showed mild decreases in white pulp mass with scattered pyknotic fragments and focal areas of apoptotic cells as well as increased numbers of RBCs with expansion of red pulp. At 24 h, the white pulp continued to decrease as red pulp and the number of splenic RBCs increased. There was also marked apoptosis with multiple sites of phagocytosis of apoptotic bodies (starry sky pattern). At 72 h in both groups of young adult males, there was a significant number of regions showing recovery of white pulp mass toward normal and a marked fall in the number of atypical nuclei. The splenic tissue of the older male group showed hemorrhagic eosinophilic exudate with fibrotic bands but little nuclear atypia.

Histologic changes of spleen with treatment. Representative 5-μm histologic sections of spleen specimens are shown (hematoxylin and eosin, ×40). Spleens of young adult rats at 0 h (A), 8 h (C), 24 h (D), and 72 h (E) after cyclophosphamide treatment (100 mg/kg intraperitoneally). Spleens of older adult animals at 0 h (B) and 72 h (F) after cyclophosphamide treatment (100 mg/kg intraperitoneally). (A and B) Both groups at 0 h had well-defined regions of red and white splenic pulp. At 8 h (C) and 24 h (D), there was progressive loss of white pulp and relative increases in red pulp. Associated with these changes were increasing numbers of apoptotic nuclei with ingestion of these particles by adjacent cells in a starry sky pattern. At 72 h, young animals (E) showed significant recovery of white pulp with more normal-appearing nuclei and absence of starry sky patterns. However, older animals (F) showed blunted recovery of white pulp with hemorrhagic eosinophilic infiltrate with dense fibrotic bands.
DISCUSSION
These data suggest that cyclophosphamide-induced intramedullary apoptosis in the long bones, pelvis, and vertebrae can be monitored noninvasively using radiolabeled annexin V and gamma camera imaging. Annexin V detects apoptotic cells by binding to PS, a constitutive membrane aminophosholipid selectively exposed during the early and intermediate phases of apoptosis before DNA fragmentation (19). The number of receptor sites for annexin V increases by a factor of 100–1,000 with the onset of apoptosis, sometimes reaching >4 × 10⁶ sites per cell (20,21). In general, in vivo radionuclide receptor imaging requires a minimum of 50,000–100,000 receptor sites per cell with a binding affinity of better than 10−8 mol/L (29). Annexin V exceeds by several orders of magnitude these theoretic requirements for receptor imaging in vivo.
Annexin V radionuclide imaging demonstrated apoptosis in the bone marrow and spleen with both organs showing uptakes of >150% of control values as early as 8 h after cyclophosphamide administration. The imaging data correlated with well counting data and the observed histologic changes within the bone marrow and spleen. The type of stromal, vascular (endothelial), and hematopoietic injuries and cell depletion found in our study were similar to those of prior animal studies on the response of the bone marrow to single doses of cyclophosphamide (30,31). The precise temporal relationships of different cell types, cell number, and fraction of cells undergoing apoptosis to annexin V uptake could not be determined from our set of experiments. Apoptosis of endothelial, stromal, and other bone marrow tissues likely contributed to femoral uptake, which was noted to plateau or increase at 24 h after cyclophosphamide injection, despite the marked loss of hematopoietic tissue seen histologically. Although fewer cells are present, the remaining cells bind more annexin V, suggesting that they are apoptotic.
Anton (30) observed marked dilation of sinusoids associated with apoptosis of endothelial cells as well as the presence of mature RBCs within regions of hematopoietic parenchyma after cyclophosphamide treatment. Because apoptosis of endothelial cells is associated with increases in annexin V binding (32), endothelial cells may contribute to the observed increase in annexin V uptake in hematopoietic tissues. Anton also noted that recovery and regrowth of stromal tissue and the endothelial cells of the sinusoids lagged significantly behind the restoration of hematopoietic parenchyma that occurred days after cyclophosphamide treatment.
Stromal and other supportive cells appear to play major roles in the maintenance of normal bone marrow and in myelodysplastic disease (3). Intramedullary stromal tissue in particular cannot be aspirated easily and often requires biopsy to obtain adequate amounts of material for assay. Annexin V imaging, though not cell specific, may provide serial, noninvasive assessments of stromal and other supportive tissues in many different hematopoietic disorders.
The spleen represents another type of tissue that is not easily accessible to biopsy. The results of this study and previous work (13) have shown that apoptosis within the spleen can be detected using radiolabeled annexin V. Because of the small size of the rat and the overlap of the spleen and the left kidney on planar imaging we could not directly perform ROI analysis of the spleen. In larger animal models and in patients, SPECT imaging would permit the direct imaging of splenic parenchymal activity.
The slow response of the bone marrow and spleen with respect to annexin V uptake in old adult rats after cyclophosphamide administration was unexpected. Age-related susceptibility of CD4+ and CD8+ human peripheral blood lymphocytes to Fas-mediated apoptosis associated with increased expression of T-cell Fas and FasL has been reported (33). Fatty replacement of hematopoietic marrow with age was also observed in our older animals. Fatty replacement of the bone marrow has been well described as part of normal maturation in rabbits (34,35) and in humans (36,37). It is unclear how these and other unknown factors contribute to the slow response to cyclophosphamide treatment and delay in marrow and splenic recovery of the older animals in our study.
Slow or poor responses to chemotherapy, determined by bone marrow biopsy within the first weeks of treatment, have correlated with poor outcome in patients with acute lymphoblastic leukemia (38–40). Serial annexin V imaging maybe helpful in these individuals as a noninvasive surrogate marker of treatment response and prognosis. Annexin V imaging compared with bone marrow biopsy or aspiration would also be free of potential sampling errors in diseases or treatment responses of the bone marrow that are not necessarily uniform.
We did not quantify the many histomorphometric variables of the femur marrow, including marrow cellularity, fatty infiltration, fatty degeneration, osteoid volume, osteoid surface, osteoid thickness, and so forth. These parameters are known to change significantly with age and race (36). The ratio of these parameters, such as marrow cellularity to the volume of bone, fat, and presumably total femoral weight, may have directly affected (decreased) the degree of annexin V uptake determined by well counting assay in older animals.
CONCLUSION
Radiolabeled annexin V preferentially localizes to regions of intramedullary and splenic apoptotic injury induced by cyclophosphamide treatment in rats. Radiolabeled annexin V may have a future role in the serial noninvasive assessment of chemotherapy-induced intramedullary and intrasplenic apoptosis.
ACKNOWLEDGMENTS
The authors acknowledge the efforts of Bonnie Bell and Stan D. Spilman for their efforts in the animal care and preparation of pathologic material for assay and histology. This work was supported in part by the National Institutes of Health (grants HL-47151 and HL-61717).
Footnotes
Received May 15, 2000; revision accepted Sep. 14, 2000.
For correspondence or reprints contact: Francis G. Blankenberg, MD, 725 Welch Rd., Palo Alto, CA 94304.
REFERENCES
In this issue


Jump to section
Related Articles
Cited By...
- Annexin A5-Conjugated Polymeric Micelles for Dual SPECT and Optical Detection of Apoptosis
- Prediction of antitumour necrosis factor clinical efficacy by real-time visualisation of apoptosis in patients with Crohn's disease
- Enhanced Apoptotic Reaction Correlates with Suppressed Tumor Glucose Utilization After Cytotoxic Chemotherapy: Use of 99mTc-Annexin V, 18F-FDG, and Histologic Evaluation
- Evaluation of 18F-Annexin V as a PET Imaging Agent in an Animal Model of Apoptosis
- Time Course of Apoptotic Tumor Response After a Single Dose of Chemotherapy: Comparison with 99mTc-Annexin V Uptake and Histologic Findings in an Experimental Model
- Detection of Cardiomyocyte Death in a Rat Model of Ischemia and Reperfusion Using 99mTc-Labeled Annexin V
- Visualization of antitumor treatment by means of fluorescence molecular tomography with an annexin V-Cy5.5 conjugate
- Imaging Apoptosis with 99mTc-Annexin-V in Experimental Subacute Myocarditis
- Near-Infrared Fluorescent Imaging of Tumor Apoptosis
- Detection of Apoptotic Tumor Response In Vivo After a Single Dose of Chemotherapy with 99mTc-Annexin V
- Imaging Apoptosis in Rheumatoid Arthritis
- Increased Uptake of the Apoptosis-imaging Agent 99mTc Recombinant Human Annexin V in Human Tumors after One Course of Chemotherapy as a Predictor of Tumor Response and Patient Prognosis